2623
Preoperative brain MRI features and postoperative delirium1Department of Intensive Care, University Medical Center Utrecht, Utrecht, Netherlands, 2Department of Radiology, University Medical Center Utrecht, Utrecht, Netherlands, 3Department of Radiology, Leiden University Medical Center, Leiden, Netherlands, 4Department of Anesthesiology and Operative Intensive Care Medicine, Charité Universitätsmedizin, Berlin, Germany
Synopsis
Postoperative delirium is associated with impaired cognitive outcome, longer hospital stay and an increased risk of dementia. To date, the pathophysiology of delirium remains largely unknown. Therefore, we studied the association of preoperative brain MRI features and the occurrence of postoperative delirium in a large group of older patients. We measured preoperative brain volumes, white matter hyperintensity shape, cerebral infarcts and cerebral perfusion. Preoperative cortical brain infarct volume was associated with postoperative delirium. Other preoperative brain MRI features were not significantly associated with postoperative delirium. Patients with a larger burden of cortical infarcts may have a decreased brain reserve, increasing the risk of postoperative delirium.
Introduction
Postoperative delirium is characterized by an acute change in attention and awareness after surgery1. Postoperative delirium is common in older patients and associated with impaired cognitive outcome, longer hospital stay and an increased risk of dementia2. To date, the pathophysiology of delirium remains largely unknown. Previous studies on preoperative brain MRI markers for postoperative delirium have shown conflicting results on the relation between global brain volumes and delirium, whereas white matter hyperintensities and presence of cerebral infarcts may be related to postoperative delirium3,4. However, these studies were small and often underpowered. Therefore, we studied the association of both common used and novel preoperative brain MRI features and the occurrence of postoperative delirium in a large group of older patients.Methods
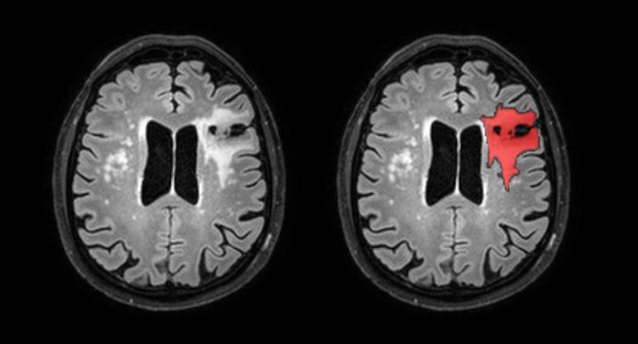
We included 182 non-demented patients from a prospective observational study: the Biomarker Development for Postoperative Cognitive Impairment (BioCog) consortium study5. All patients were scheduled for major elective surgery (e.g. cardiothoracic, orthopedic, gastrointestinal, gynecologic, urologic) of ≥ 60 minutes, were ≥ 65 years of age and received a brain MRI scan before surgery. Brain volumes (total brain, gray matter, white matter, white matter hyperintensities and intracranial volume (ICV)) were automatically segmented on 3D T1 and 3D FLAIR images by the lesion prediction algorithm (Schmidt, 2017, Chapter 6.16), a lesion filling algorithm and CAT12 using statistical parametric mapping version 12 (SPM12; Wellcome Institute of Neurology, University College London, UK, http://www.fil.ion.ucl.ac.uk/spm/doc/). White matter hyperintensity shape features were calculated by in-house developed software describing the complexity of these shapes7. Cerebral perfusion (gray matter, white matter) was determined from pCASL images by the ExploreASL toolbox8. Cerebral infarcts (cortical, subcortical and lacunar) were rated by two neuroradiologists using 3D FLAIR, 3D T1 and DWI images, according to the STRIVE criteria9. Logistic regression analyses were performed with postoperative delirium as dependent variable. All logistic regression analyses were adjusted for age and sex and in the case of brain volumes additionally for intracranial volume.Results
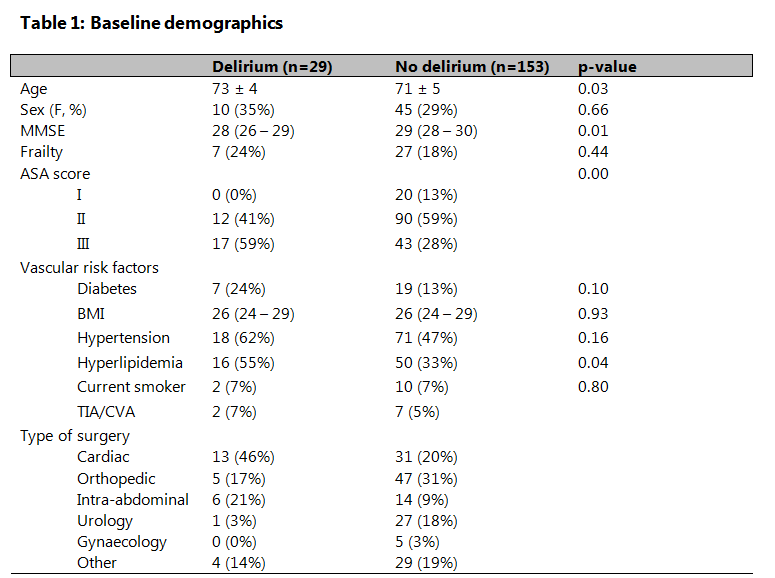
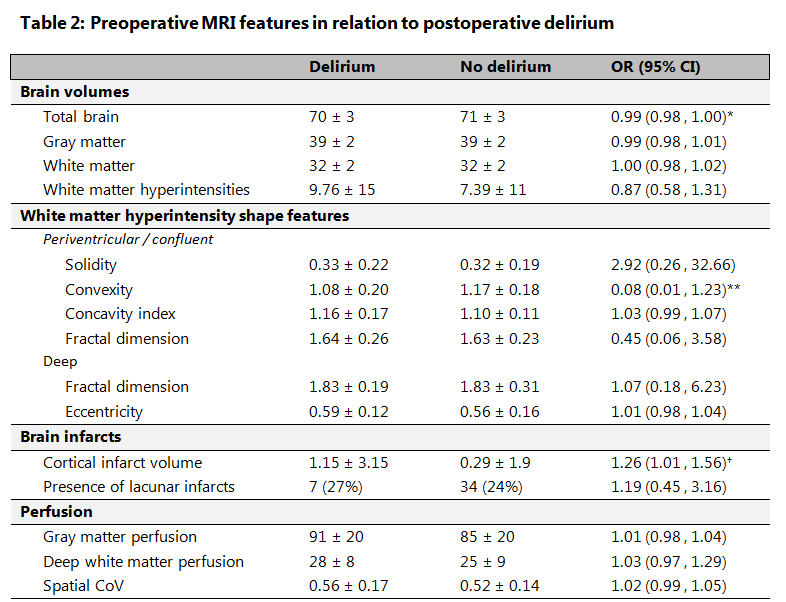
Patients who had a postoperative delirium were generally older, had lower preoperative MMSE scores, more often hyperlipidemia and higher preoperative disease severity score (see table 1). Cortical brain infarct volume showed a significant association with postoperative delirium (OR=1.26, 95% CI: 1.01 to 1.56). Brain volumes (gray matter, white matter, total brain volume, white matter hyperintensity volume), white matter hyperintensity shape features, presence of subcortical or lacunar infarcts and gray matter and white matter perfusion were not significantly associated with postoperative delirium (see table 2). However, there was a trend for the association between a lower total brain volume (ml) (OR=0.99, 95% CI: 0.98 to 1.00) and a more complex shape of white matter hyperintensities (lower concavity index: OR=0.08, 95% CI 0.01 to 1.23) and postoperative delirium.Discussion and conclusion
We showed that preoperative cortical brain infarct volume seems to be associated with the occurrence of postoperative delirium. Furthermore, we did not find a significant association of MRI features related to neurodegenerative disease (total brain volume, gray matter volume, white matter volume), and MRI features related to small vessel disease (white matter hyperintensity volume, white matter hyperintensity shape and presence of lacunar infarcts) with postoperative delirium. To the best of our knowledge, we are the first to have assessed preoperative white matter hyperintensity shape features and cortical infarct volume in relation to delirium. In previous community-based studies, the presence of cortical brain infarcts increases vulnerability for developing cognitive decline and dementia10. The presence of cortical brain infarcts, and a higher cortical brain infarct volume may therefore also lead to a decreased brain reserve and increased vulnerability for postoperative delirium.Acknowledgements
No acknowledgement found.References
1. American Psychiatric Association. Diagnostic and Statistical Manual of Mental Disorders (5th Ed.). Washington, DC; 2013.
2. Inouye SK, Westendorp RGJ, Saczynski JS. Delirium in elderly people. Lancet. 2014;383(9920):911-922. doi:10.1016/S0140-6736(13)60688-1.Delirium
3. Cavallari M, Hshieh TT, Guttmann CRG, et al. Brain atrophy and white matter hyperintensities are not significantly associated with incidence and severity of postoperative delirium in older persons without dementia. Neurobiol Aging. 2015. doi:10.1016/j.neurobiolaging.2015.02.024
4. Otomo S, Maekawa K, Goto T, Baba T, Yoshitake A. Pre-existing cerebral infarcts as a risk factor for delirium after coronary artery bypass graft surgery. Interact Cardiovasc Thorac Surg. 2013;17(5):799-804. doi:10.1093/icvts/ivt304
5. Winterer G, Androsova G, Bender O, et al. Personalized risk prediction of postoperative cognitive impairment – rationale for the EU-funded BioCog project. Eur Psychiatry. 2018;0(0):4-9. doi:10.1016/J.EURPSY.2017.10.004
6. Schmidt P. Bayesian inference for structured additive regression models for large-scale problems with applications to medical imaging. 2017.
7. Ghaznawi R, Geerlings MI, Jaarsma-coes MG, et al. The association between lacunes and white matter hyperintensity features on MRI : The SMART -MR study. 2018. doi:10.1177/0271678X18800463
8. Mutsaerts HJMM, Petr J, Thomas DL, et al. Comparison of arterial spin labeling registration strategies in the multi-center GENetic frontotemporal dementia initiative (GENFI). J Magn Reson Imaging. 2018;47(1):131-140. doi:10.1002/jmri.25751
9. Wardlaw JM, Smith EE, Biessels GJ, et al. Neuroimaging standards for research into small vessel disease and its contribution to ageing and neurodegeneration. Lancet Neurol. 2013;12(8):822-838. doi:10.1016/S1474-4422(13)70124-8
10. Sigurdsson S, Aspelund T, Kjartansson O, et al. Incidence of brain infarcts, cognitive change and risk of dementia in the general population: The AGES - Reykjavik Study. Stroke. 2017;48(9):2353-2360. doi:10.1161/STROKEAHA.117.017357.Incidence
Figures