2621
Quantitative R2 mapping reveals information of myelin content in rat brain at 7T1Department of Medical Imaging and Radiological Sciences, Chung Shan Medical University, Taichung, Taiwan, 2Department of Medical Imaging, Chung Shan Medical University Hospital, Taichung, Taiwan, 3School of Biomedical Engineering, College of Biomedical Engineering, Taipei Medical University, Taipei, Taiwan, 4Department of Biological Science and Technology, China Medical University, Taichung, Taiwan, 5Research Center of Translational Imaging, School of Medicine, Taipei Medical University, Taipei, Taiwan, 6Department of Biomedical Imaging and Radiological Sciences, Yang Ming University, Taipei, Taiwan, 7Graduate Institute of Biomedical Electronics and Bioinformatics, National Taiwan University, Taipei, Taiwan
Synopsis
Information of myelin content can reflect the microstructural difference between brain white matter (WM) and gray matter (GM), and particularly facilitating in detection of WM abnormalities during disease progression. This study aims to optimize a quantitative R2 mapping method of rat brain at 7T MRI and to evaluate the relationship between the measured R2 values and myelin content in discrepant brain tissues. Our findings demonstrated that quantitative R2 measurements could be an alternative to provide information of myelin content in rat brain at 7T, which may have potential to assess microstructural changes of brain WM and GM in demyelinating diseases.
Introduction
Information of myelin content can reflect the microstructural difference between brain white matter (WM) and gray matter (GM), and particularly facilitating in detection of WM abnormalities during disease progression [1]. In clinical examination of the demyelinating diseases, WM lesions have been frequently assessed using conventional MR T2-weigted FLAIR images, on which hyperintensities indicates possible underlining neural inflammation and demylination. Although several advanced imaging techniques, such as myelin water imaging and diffusion-based schemes, have been proposed [1,2], the specificity is not good and need more validations due to the complicated pathophysiological mechanism of brain demyelination. The transverse relaxation rates, R2 (1/T2) values, has been demonstrated to have the ability to reveal tissue composition and differentiate the enhancing lesions from normal brain tissues in patients with multiple sclerosis [3]. However, there is still lack of histological confirmation for further applications. Therefore, the purpose of this study is to optimize a quantitative R2 mapping method of rat brain at 7T MRI and to evaluate the relationship between the measured R2 values and myelin content in discrepant brain tissues.Methods
Four Sprague Dawley (SD) rats (8 weeks of age) had stand rodent lab chow were enrolled in this preliminary study. The MR imaging was performed on a 7.0T animal MR scanner (PharmaScan, Bruker, Erlangen, Germany) with a 72 mm transmitting coil and a quadrature surface coil for receiving after anesthesia. After conventional sequences, a multislice multiecho spin-echo imaging was used to obtain 25 images with different echo time (TE) ranging from 6.5 to 163.6 ms. Other imaging parameters are as follow: TR = 2000 ms, FOV=25x25 mm2, matrix size = 256x256 (zero-filled to 512x512), slice thickness = 1 mm, NEX = 4, and total scan time less than 1.5 hour. The R2 maps were calculated using the least-square single exponential curve-fitting method on the Matlab 2013b software platform. Region-of -interests (ROIs) were manually selected on the area of the corpus callosum, thalamus, hippocampus, and brain cortex, based on the previous report [4]. Mean R2 value and the standard deviation of each region were calculated first. Additionally, immunohistochemical (IHC) analysis of myelin basic protein (MBP) was performed to assess the discrepant myelin contents of the brain tissues.Results
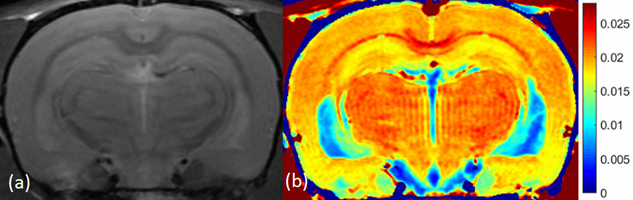
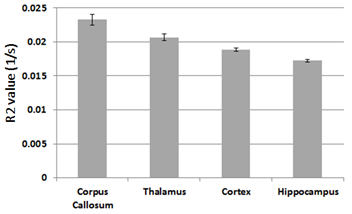
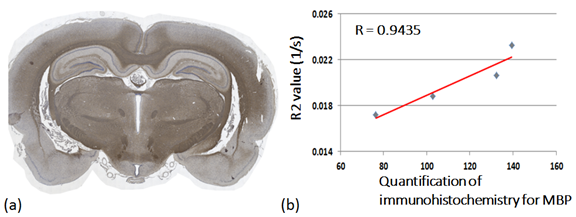
The obtained proton density-weighted (PDW) image and the corresponding R2 map from one normal rat were shown in Figure 1. Four WM and GM brain structures abovementioned were selected for further comparison of discrepant myelin contents. The mean and standard deviations of the R2 values in the corpus callosum, thalamus, hippocampus, and brain cortex were displayed in Figure 2, respectively. Significant differences were found in the R2 values among the four selected brain structures consisting with discrepant myelin contents using one-way ANOVA analysis conjugated with post-hoc correction (P < 0.05). Figure 3 (a) shows the IHC analysis of the myelin basic protein (MBP) in rat brains. Dark brown color on the WM, such as corpus callosum, reveals a more dense MPB content as compared with other GM structures in the rat. More importantly, a great correlation (R = 0.9435) between the mean R2 values and the quantified myelin contents in the four regions was shown in figure 3 (b).Discussion
To our best knowledge, this is the first report to demonstrate the relationship between the measured R2 values and quantified myelin content with histological confirmation in rat brain at 7T. Our findings indicated the feasibility of assessing information of myelin content in in vivo rat brain using non-invasive quantitative MR R2 mapping. Although some reports indicated that R2* mapping could provide information about myelin content as well as white matter orientation, the results can be dramatically interfered by the field inhomogeneity and susceptibility effect, restricting further clinical applications [5]. In our preliminary result, significant differences of the R2 values were shown among the selected WM and GM structures, and the values correlate well with the quantified myelin content from IHC analysis, suggesting the possibility of detecting demyelination. To sum up, quantitative R2 measurements could provide information of myelin content in rat brain at 7T, which may have potential to assess microstructural changes of brain WM and GM in demyelinating diseases.Acknowledgements
This study was supported by the Ministry of Science and Technology, Taipei, Taiwan (MOST 107-2314-B-040-027).References
1. Bouhrara M, Reiter DA, Bergeron CM, et al. Evidence of demyelination in milde cognitive impairment and dementia using a direct and specific magnetic resonance imaging measure of myelin content. Alzheimers Dement 2018;14(8):998-1004.
2. Jelescu IO, Zurek M, Winters KV, et al. In vivo quantification of demyelination and recovery using compartment-specific diffusion MRI metrics validated by electron microscopy. Neuroimage 2016;132:104-114.
3. Blystad I, Håkansson I, Tisell A, et al. Quantitative MRI for analysis of active multiple sclerosis lesions without Gadolinium-based contrast agent. AJNR Am J Neuroradiol 2016;37(1);94-100.
4. Liachenko S, Ramu J. Quantification and reproducibility assessment of the regional brain T2 relaxation in naïve rats at 7T. J Magn Reson Imaging 2017;45(3);700-709.
5. Rudko DA, Klassen LM, de Chichera SN, et al. Origins of R2* orientation dependence in gray and white matter. Proc Nati Acad Sci USA 2014;111(1):E159-167.
Figures