2618
Gradient profiles of myelin and microstructure metrics across the developing brain1Cardiff University Brain Research Imaging Centre, Cardiff, United Kingdom, 2Developmental Imaging, Murdoch Children’s Research Institute, Parkville, Australia, 3Department of Paediatrics, University of Melbourne, Parkville, Australia, 4University of Sherbrooke, Sherbrooke, QC, Canada
Synopsis
Myelinogenesis follows a protracted sequence, with distinct pathways being myelinated at various times throughout development. To test this with MRI, we used magnetization transfer and diffusion metrics with tractography to investigate along-tract profiles of myelin and microstructure metrics in children and adolescents. Profiles demonstrated sensitivity to along-tract metrics, with midline regions having increased myelin and restricted diffusion indices indicative of maturation.
Introduction
Histological studies have demonstrated a protracted temporal and spatial sequence related to myelogenesis throughout development. In general, pathways supporting sensory systems mature before motor, then projection before association, reflecting the dynamic requirements and complexity of brain function over the lifespan1. Detection of these subtle effects remains challenging with magnetic resonance imaging (MRI) as standard metrics are typically nonspecific to biophysical properties and averaged over large regions of interest. To address this, we used both magnetization transfer (MT) and diffusion-weighted imaging data to create composite indices sensitive to properties of myelin and microstructure. We then used tractography to parse out fine-scale segments along developmentally sensitive brain pathways in a cohort of healthy children and adolescents. We hypothesized this segmented approach would enable us to detect gradient-like profiles of maturity relative to myelin and microstructure maturation. In addition, we investigated the sensitivity of this method to detect age-related differences along each pathway.Methods
Sixteen participants, ages 8-18 years, were scanned on a 3T Siemens Connectom scanner with 300 mT/m gradients and a 32-channel receive array.
Acquisition and Processing: MT data were collected as three multi-echo 3D FLASH scans (TE=2.46-19.68, ES=2.46, resolution=1.5mm3) with either T1-, PD-, or MT-weighting by varying the TR and flip angle, α, or 23ms/28°, 23ms/5°, 42ms/7°, respectively. For MT-w, an off-resonance Gaussian RF pulse was applied prior to excitation. Data were corrected for bias receive field artifacts and Gibbs ringing. MT data corrected for T1 effects (MT-sat)2 were generated using qMRLab software3. Multi-shell diffusion-weighted imaging data were collected (TE/TR = 48/2600 ms; voxel size = 2x2x2mm; b-values= 0 (14 vols), 500;1200(30 dirs), and 2400;4000;6000(60 dirs)s/mm2). Data were acquired in an anterior-posterior (AP) phase-encoding (PE) direction, with one additional PA volume. Preprocessing included denoising, correction for signal drift, motion, distortion, gradient non-linearities and Gibbs ringing. In-house fitting routines were used to generate parameter maps of fractional anisotropy (FA), axial diffusivity (AD), radial diffusivity (RD), apparent fiber density (AFD), number of fiber orientations (NuFO) and restricted diffusion signal fraction (FR). Images were registered to diffusion space using ANTS4.
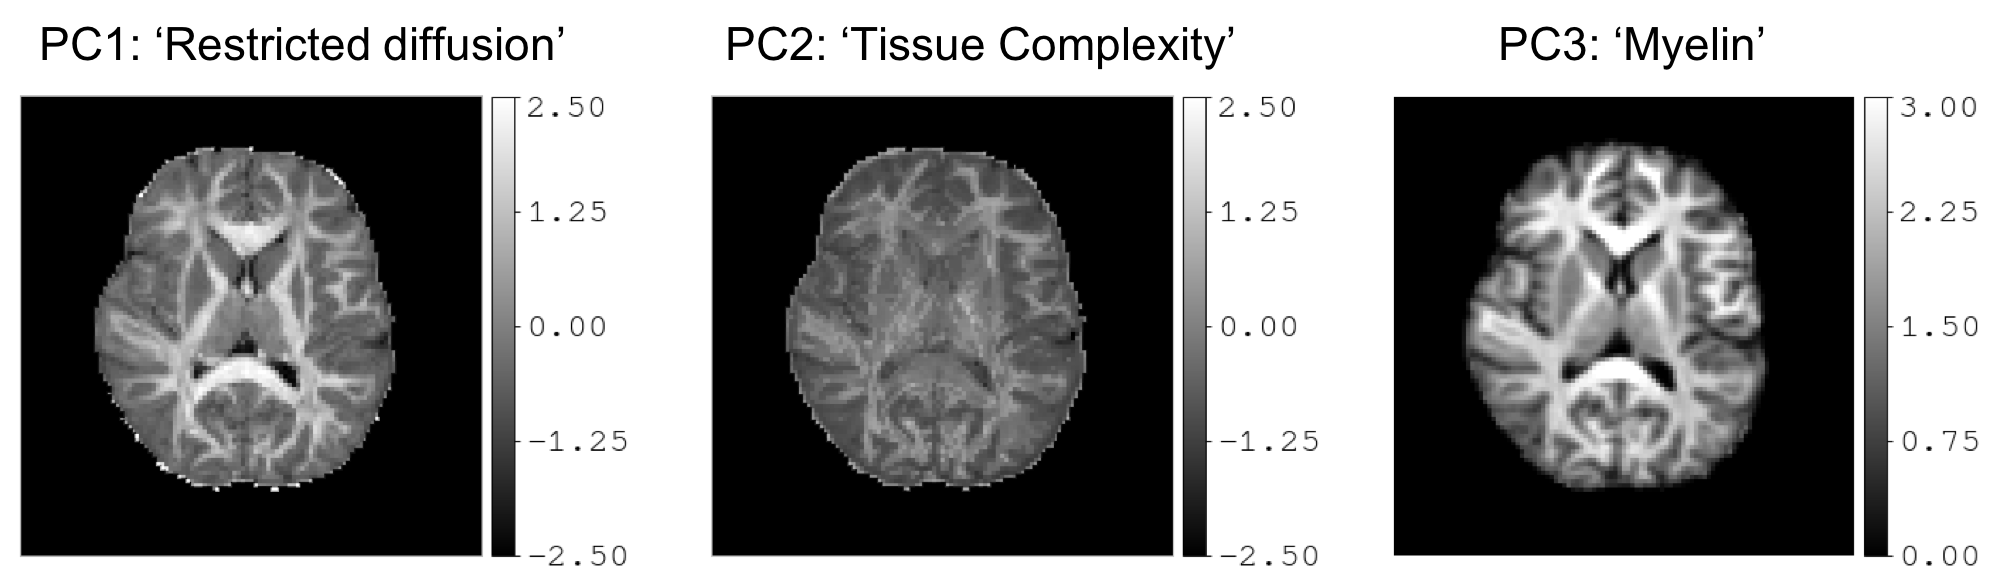
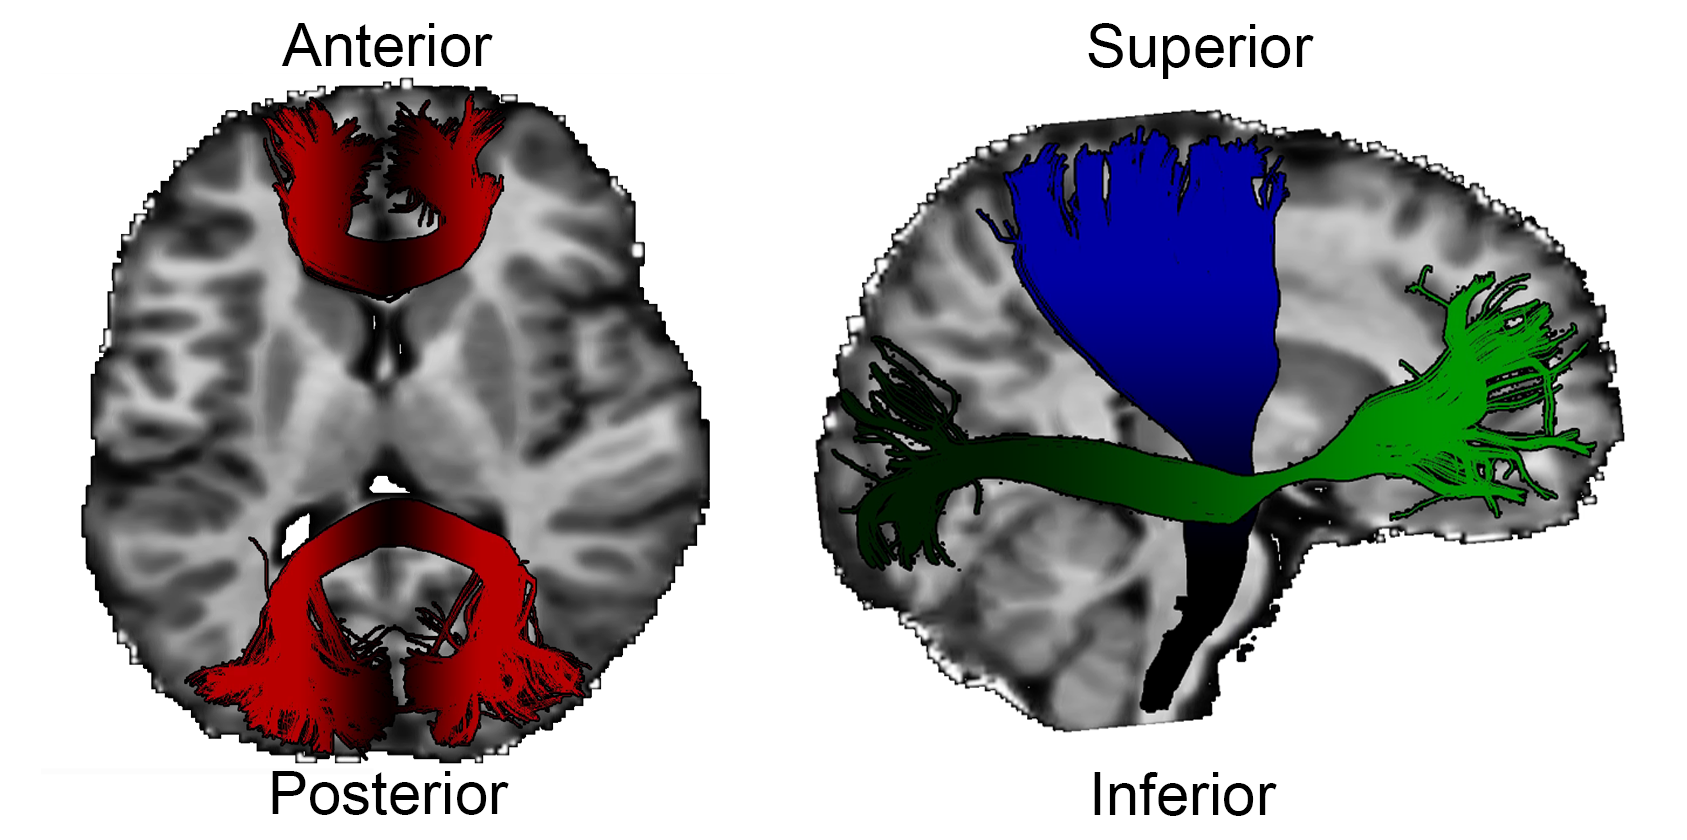
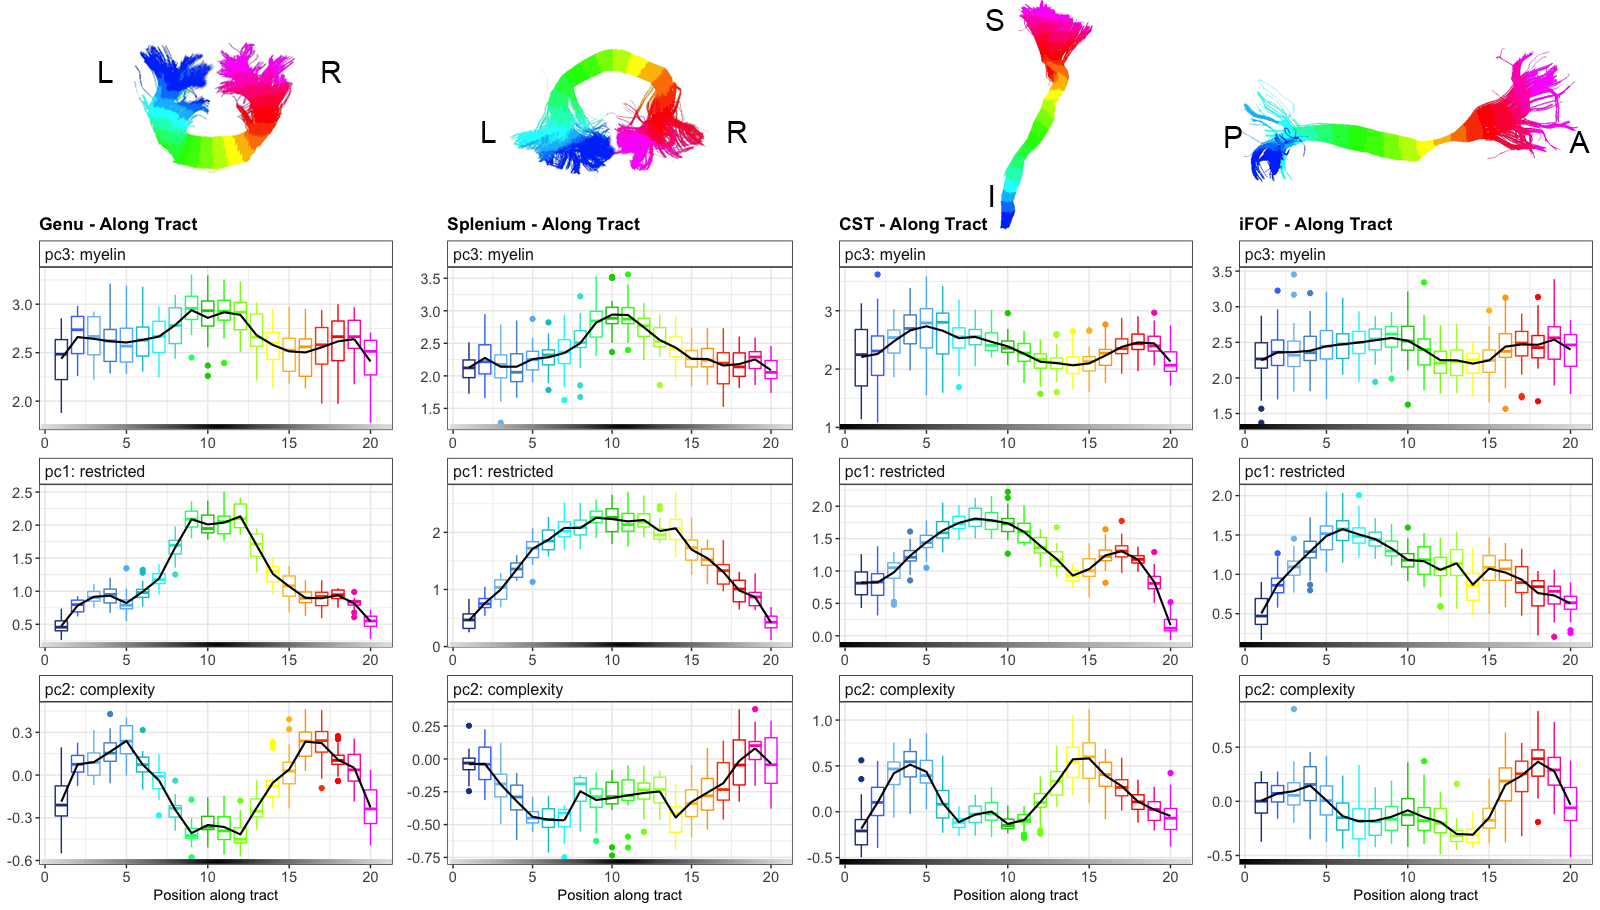
Statistical analysis: Principal component analysis (PCA) was applied to all available parameter maps to reduce data complexity and increase statistical power of subsequent comparisons. This resulted in PC1, capturing diffusion metrics sensitive to hindrance/restriction (FA, RD, FR, AFD); PC2, describing diffusion metrics sensitive to dispersion and complexity (NuFO, AD); and PC3, predominantly comprising MT-sat which is sensitive to myelin (Figure 1). The corticospinal tract (CST), inferior fronto-occipital fasciculus (iFOF), and bilateral projections of the genu and splenium were selected as regions sensitive to age-related development in children and adolescents5,6. Fiber bundles were identified using FiberNavigator software7 and along-tract profiles of the three PC maps were extracted as 20 segments for each pathway8. To test for age effects, we fitted a simple linear regression model across all participants at each segment to estimate the change in each principal component per year.
Results
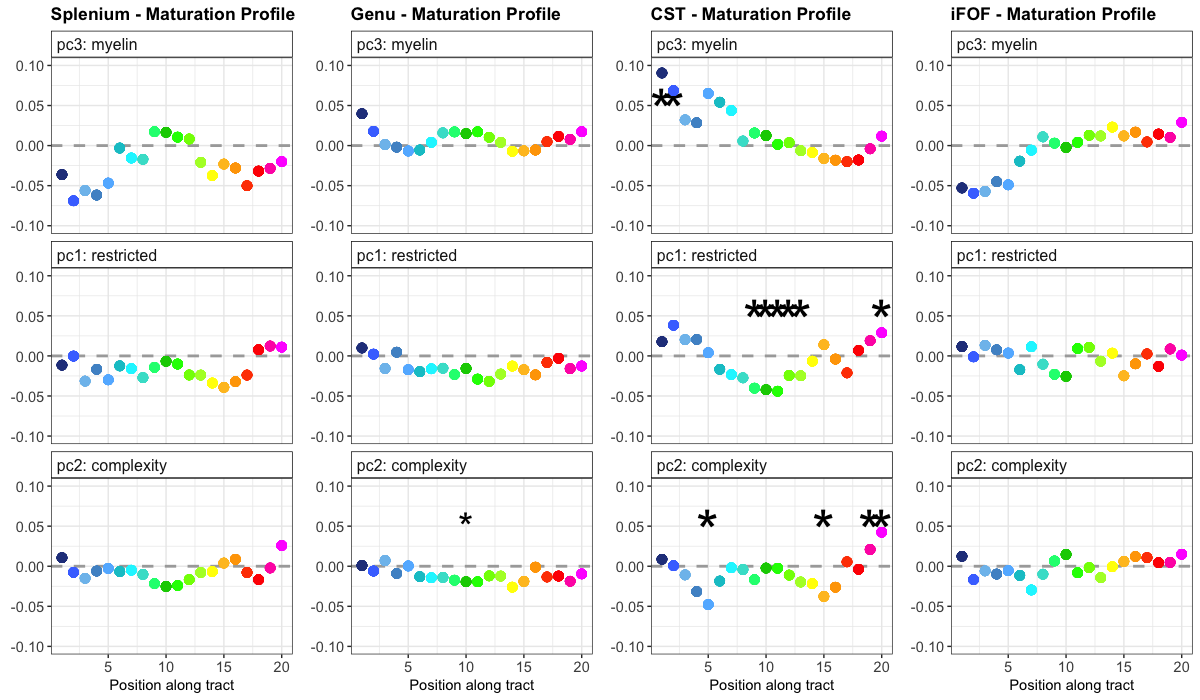
As expected, the complexity of myelin and diffusion representation in the mid-sagittal slice of the corpus callosum was low (PC2), likely due to the highly organized single-fibers in this section. Whereas the high variability in peripheral regions may be influenced by tract bending and fanning patterns. The myelin component had similar profiles across the genu and splenium (PC3), however restricted diffusion profiles were slightly different between the two tracts (PC2). We observed a smoother representation of restricted diffusion in the splenium, compared with a sharper transition on either side of the genu mid-line. This is likely due to the earlier development of the splenium starting from the mid-line and projecting peripherally. In the genu, this profile appeared to be more protracted, whereby peripheral segments of the genu were less represented by the restricted diffusion component. The superior segment of the CST, and the posterior segment of the iFOF, also exhibit proportionally lower restricted diffusion, compared with the myelin component. We observed age-effects for some segments of the CST and genu with the regression analysis (p<0.01) (Figure 5). For myelin (PC3), there was an increase with age in the inferior aspect of the tract that is consistent with age-related maturation, but PC1 was unexpectedly negative in the CST.Discussion
Previous findings have shown that g-ratio, the ratio between the radius of the restricted compartment and overall fiber, is relatively stable over the lifespan9. However, we show that in a tighter age-range of children and adolescents, that there may be subtle differences in the timing of myelination and microstructural properties. Future work should directly compare these profiles longitudinally, to identify regions of myelin or axonal growth acceleration.Acknowledgements
Special thanks to the qMR Lab development team for assistance with MT-sat processing. ER is supported by a UK Marshall-Sherfield Fellowship. MC is supported by the Postdoctoral Fellowships Program from the Natural Sciences and Engineering Research Council of Canada (NSERC). CMWT is supported by a Rubicon grant from the NWO. This work was also funded by a Wellcome Trust Strategic Award and a Wellcome Trust New Investigator Award.References
1. Flechsig, P. Anatomie des menschlichen Gehirns und Rückenmarks auf myelogentischer Grundlage. (1920).
2. Helms, G., Dathe, H., Kallenberg, K. & Dechent, P. High-resolution maps of magnetization transfer with inherent correction for RF inhomogeneity and T1 relaxation obtained from 3D FLASH MRI. Magn. Reson. Med. 60, 1396–1407 (2008).
3. Cabana, J.-F. et al. Quantitative magnetization transfer imaging made easy with q MTL ab : Software for data simulation, analysis, and visualization. Concepts Magn. Reson. Part A 44A, 263–277 (2015).
4. Avants, B. B. et al. The Insight ToolKit image registration framework. Front. Neuroinform. 8, 1–13 (2014).
5. Lebel, C., Treit, S. & Beaulieu, C. A review of diffusion MRI of typical white matter development from early childhood to young adulthood. NMR Biomed. 1–23 (2017). doi:10.1002/nbm.3778
6. Yakovlev, P. I. & Lecours, A.-R. The myelogenetic cycles of regional maturation of the brain. in Regional Development of Brain in Early Life 3–70 (1967).
7. Chamberland, M., Whittingstall, K., Fortin, D., Mathieu, D. & Descoteaux, M. Real-time multi-peak tractography for instantaneous connectivity display. Front. Neuroinform. 8, 1–15 (2014).
8. Cousineau, M. et al. A test-retest study on Parkinson’s PPMI dataset yields statistically significant white matter fascicles. NeuroImage Clin. 16, 222–233 (2017).
9. Berman, S., West, K. L., Does, M. D., Yeatman, J. D. & Mezer, A. A. Evaluating g-ratio weighted changes in the corpus callosum as a function of age and sex. Neuroimage 1–10 (2017).
Figures
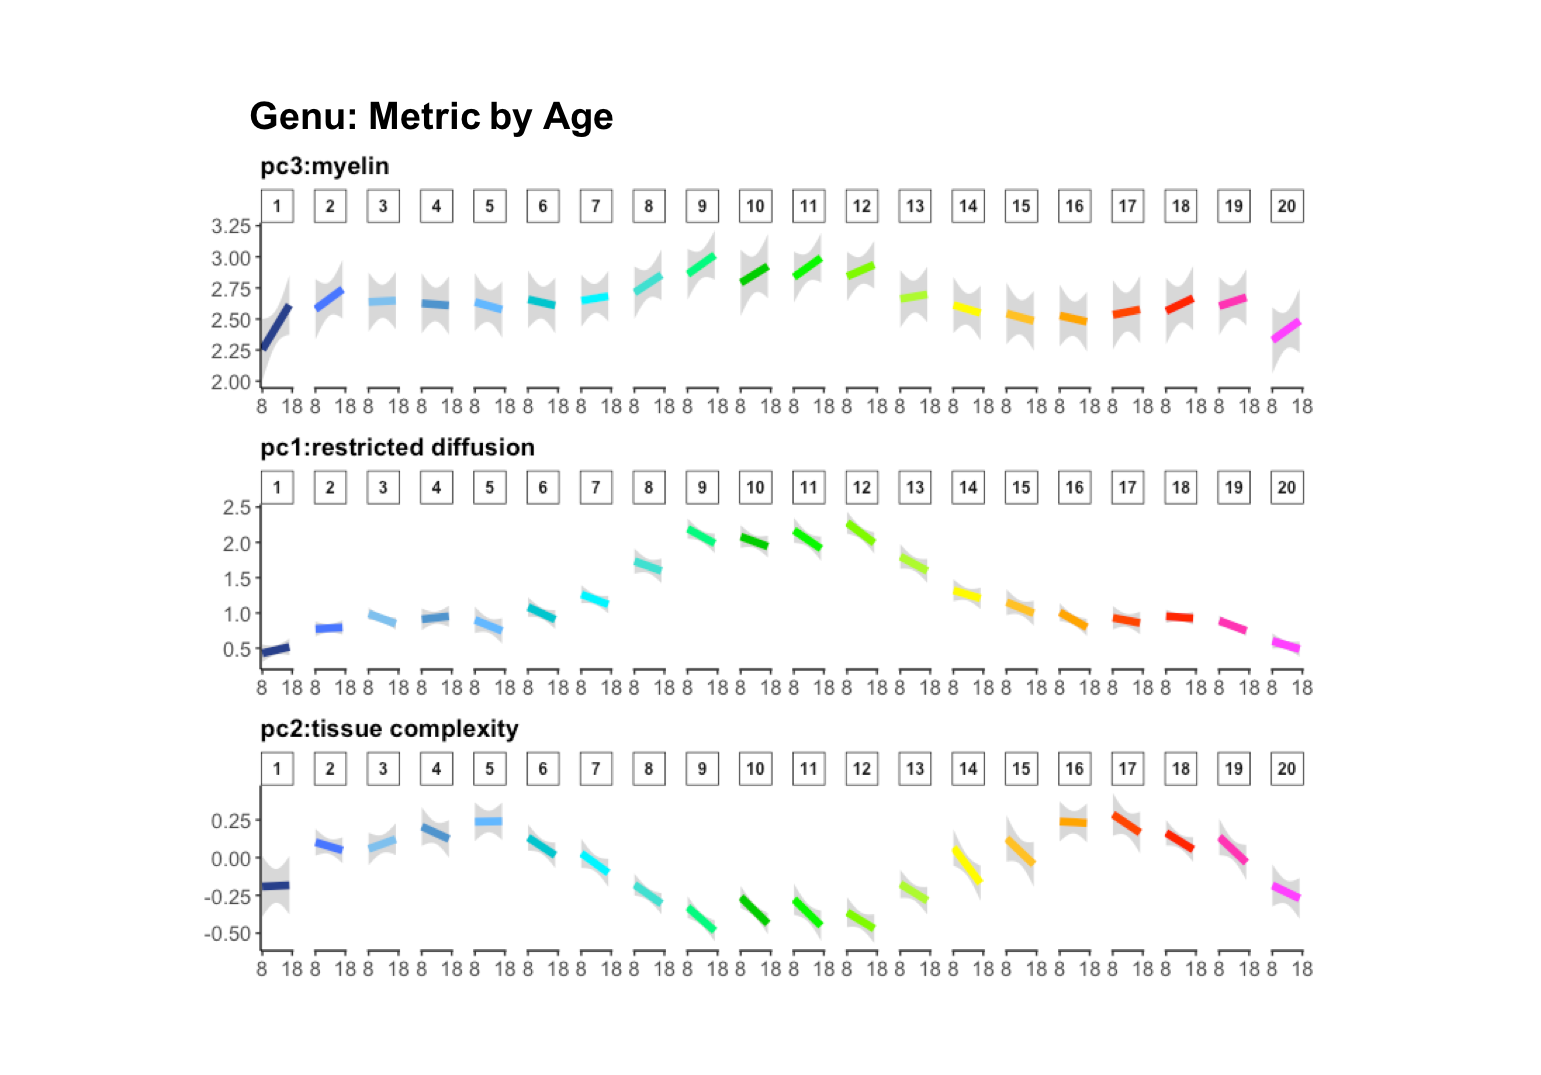
Simple linear regression was applied across all participants to estimate age-dependent gradient profiles for each metric. The genu was selected to illustrate this effect.