2615
Ex-vivo MR investigation of microstructures in globus pallidus in QSM: a histological validation study1Radiology, Seoul St. Mary's Hospital, College of Medicine, The Catholic University of Korea, Seoul, Korea, Republic of, 2Department of Anatomy, College of Medicine, The Catholic University of Korea, Seoul, Korea, Republic of, 3Catholic Institute for Applied Anatomy, College of Medicine, The Catholic University of Korea, Seoul, Korea, Republic of
Synopsis
Linear paramagnetic structures were frequently seen in globus pallidus (GP), and interesting calcific densities are overlapping on these paramagnetic structures. This study aimed to explore the microstructural findings of GP using ex-vivo MRI scan and histologic validation. We found that the source of paramagnetism were mineral deposition of perforating vessels in GP. Those mineral depositions were paramagnetic on MR images, and calcific density on CT scan. Histologic study showed simultaneous deposition of iron and calcium along the arterial wall. High resolution MRI might have potential to demonstrate vascular degeneration and mineral deposition, which might be associated with aging and metabolic brain diseases.
Introduction
Recently, clinical usefulness of magnetic susceptibility contrast has been addressed.1 Because several clinically important substances, such as iron and calcium, had good susceptibility contrast, previous studies explored the contribution of them to quantitative susceptibility mapping (QSM) of human brain structures.2-4 For example, globus pallidus (GP) is a major area of cerebral iron storage and metabolism, and in-vivo assessment of GP iron is one of the important clinical implications of QSM.3-6
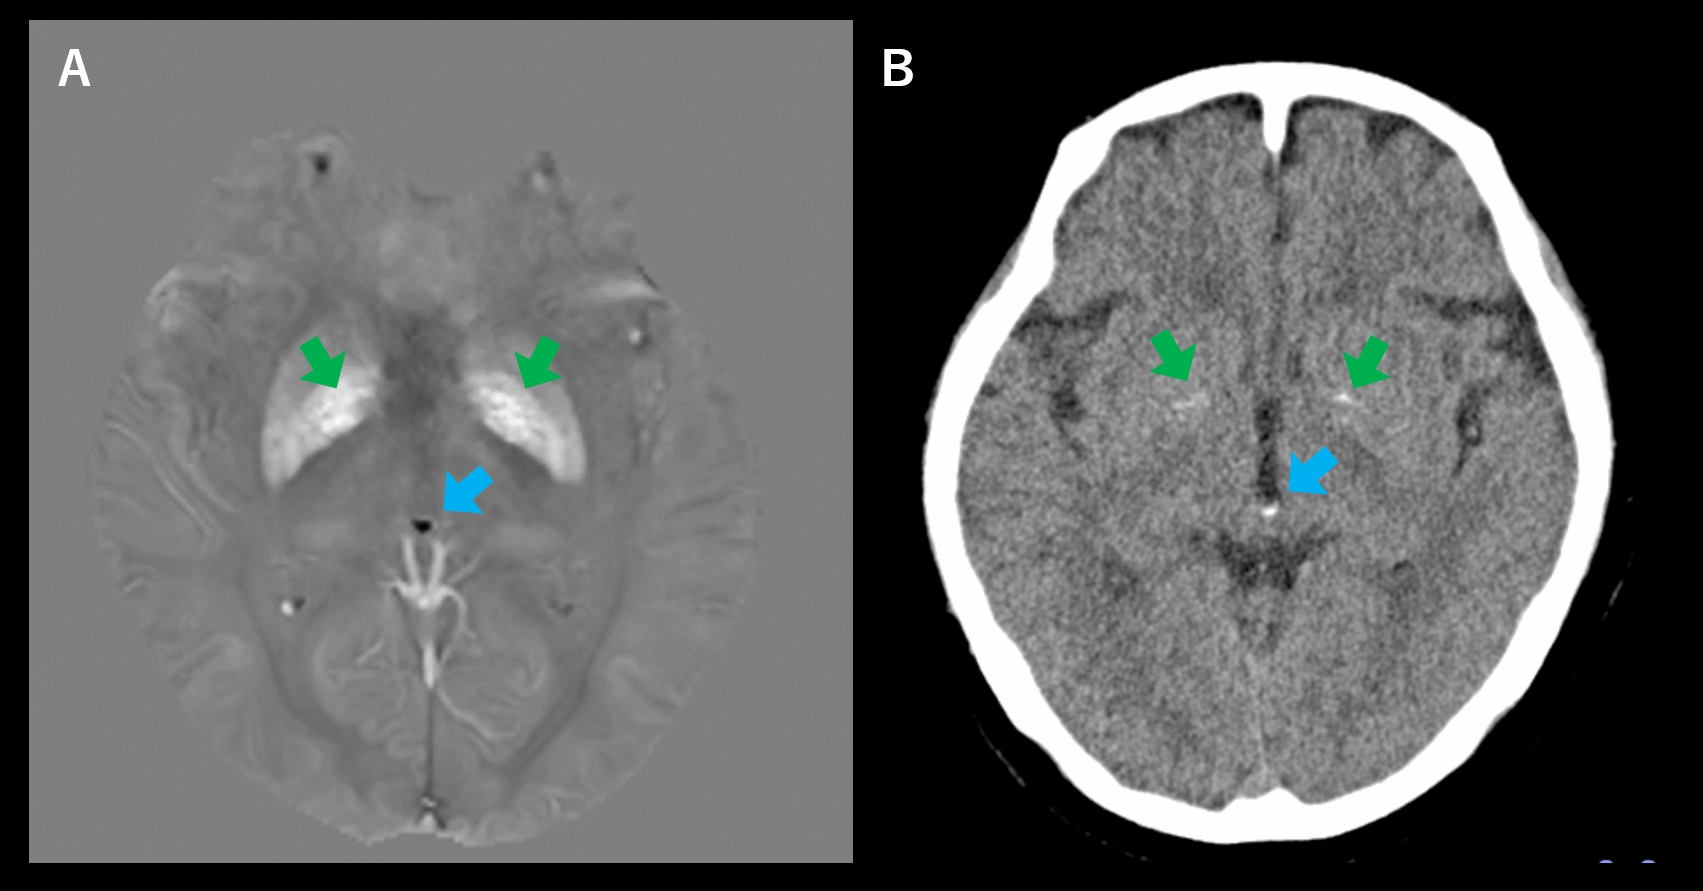
Calcium is another important mineral in the brain, and GP is one of the preferential locations.7,8 While calcium is diamagnetic in general, Yamada et al9 observed unexpected paramagnetism of calcified area of GP (Figure 1). Although several studies reported deposition of calcium and iron in GP in aging and various neurological diseases,7,10-11 histological findings of this finding was not explored; even an early report discussed it as artifacts.11
We aimed to explore this finding using ex-vivo MR images of two different MR units: a clinical 3T unit and animal 15.2T MR unit. MR findings were correlated with CT and histological findings.
Methods
Subjects
Two fixed cadavers were used in ex-vivo study (68-year-old man, subject A and 74-year-old women, subject B). After extraction of the brain from skull, dura matter and arachnoid membranes, and subarachnoid structures were removed carefully. To increased signal-to-noise ratio (SNR) and prepare tissue for histological assessment, brains were trimmed focusing on deep gray matter.
MR Imaging
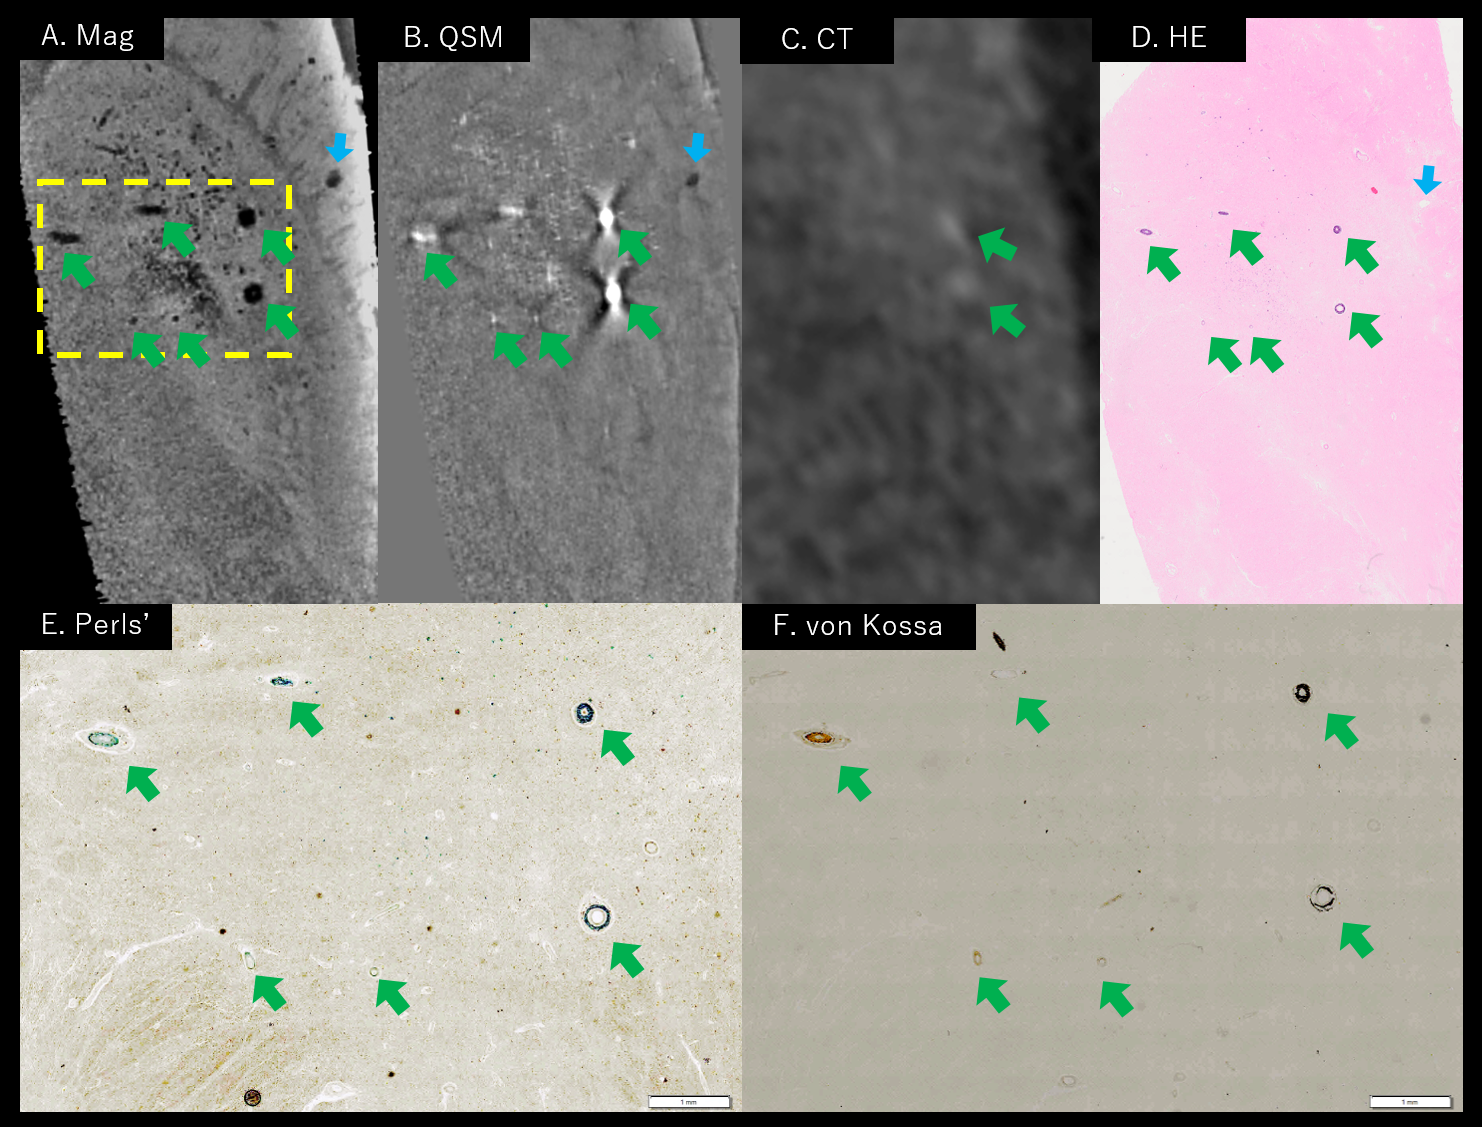
At 3T clinical MRI (Ingenia, Philips), brains were scanned with following parameters: 3D multi-echo gradient echo images (mGRE), TR = 64 ms, TE = 3.7/6.3/8.8/11.4/14.0/16.6/19.1 ms, flip angle = 45 °, in-plane resolution = 0.5 x 0.5 mm2, slice thickness = 0.5 mm, 72 slices, readout bandwidth = 480 Hz/px. At 15.2T animal MRI (Biospin, Bruker), subject B was scanned with following parameters: 3D mGRE, TR = 14 ms, TE = 1.5/2.3/3.0/3.7 ms, flip angle = 10 °, in-plane resolution = 0.1 x 0.1 mm2, slice thickness = 0.1 mm, 160 slices, readout bandwidth = 2344 Hz/px. For 3T and 15.2T 3D mGRE data, QSMs were calculated from the multi-echo phase images by dipole inversion process after background phase removal.12
CT scans
CT scan was done performed using 64-channel multidetector CT (Somatom Senstation AS+) with following parameters: 120 kVp, 300 mAs, pitch 0.5, helical scan. Data were reconstructed into 0.6-mm isotrophic images, and were manually co-registered to MR images using 3D Slicer.
Histological analysis
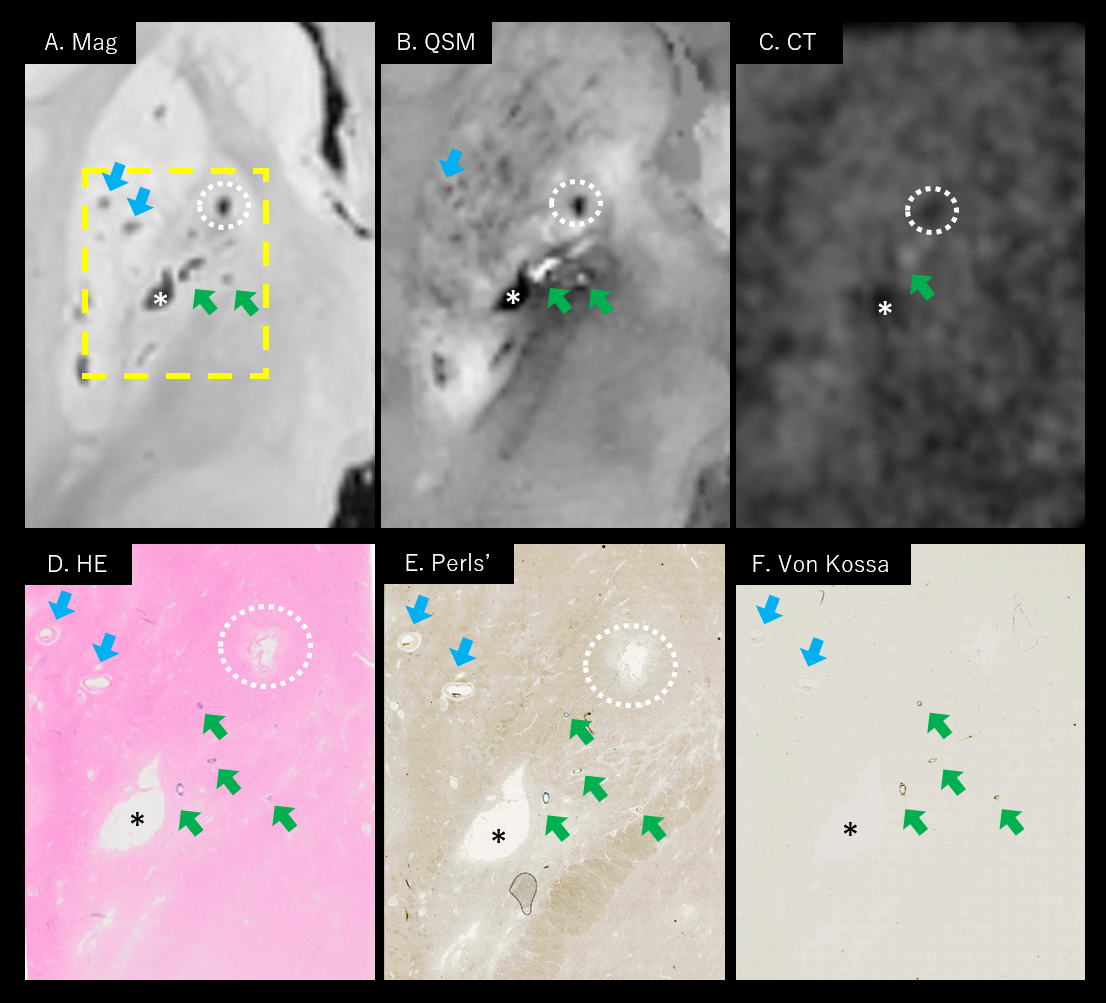
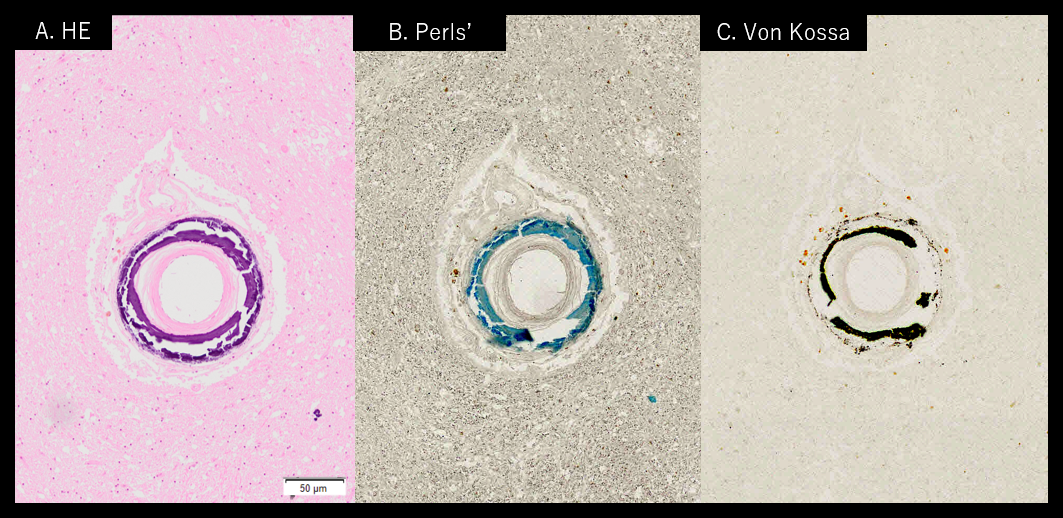
Both sides of GP of subject B were trimmed and embedded in paraffin for histologic evaluation. Consecutive tissue sections (4-μm-thick) were made and stained with hematoxylin and eosin (H&E), Perls’ Prussian blue for detection of iron, and von Kossa’s stain for detection of calcium. Tissue sections were scanned and photographed using a slide scanner (SCN400, Leica Microsystems Ltd., Germany).
Results
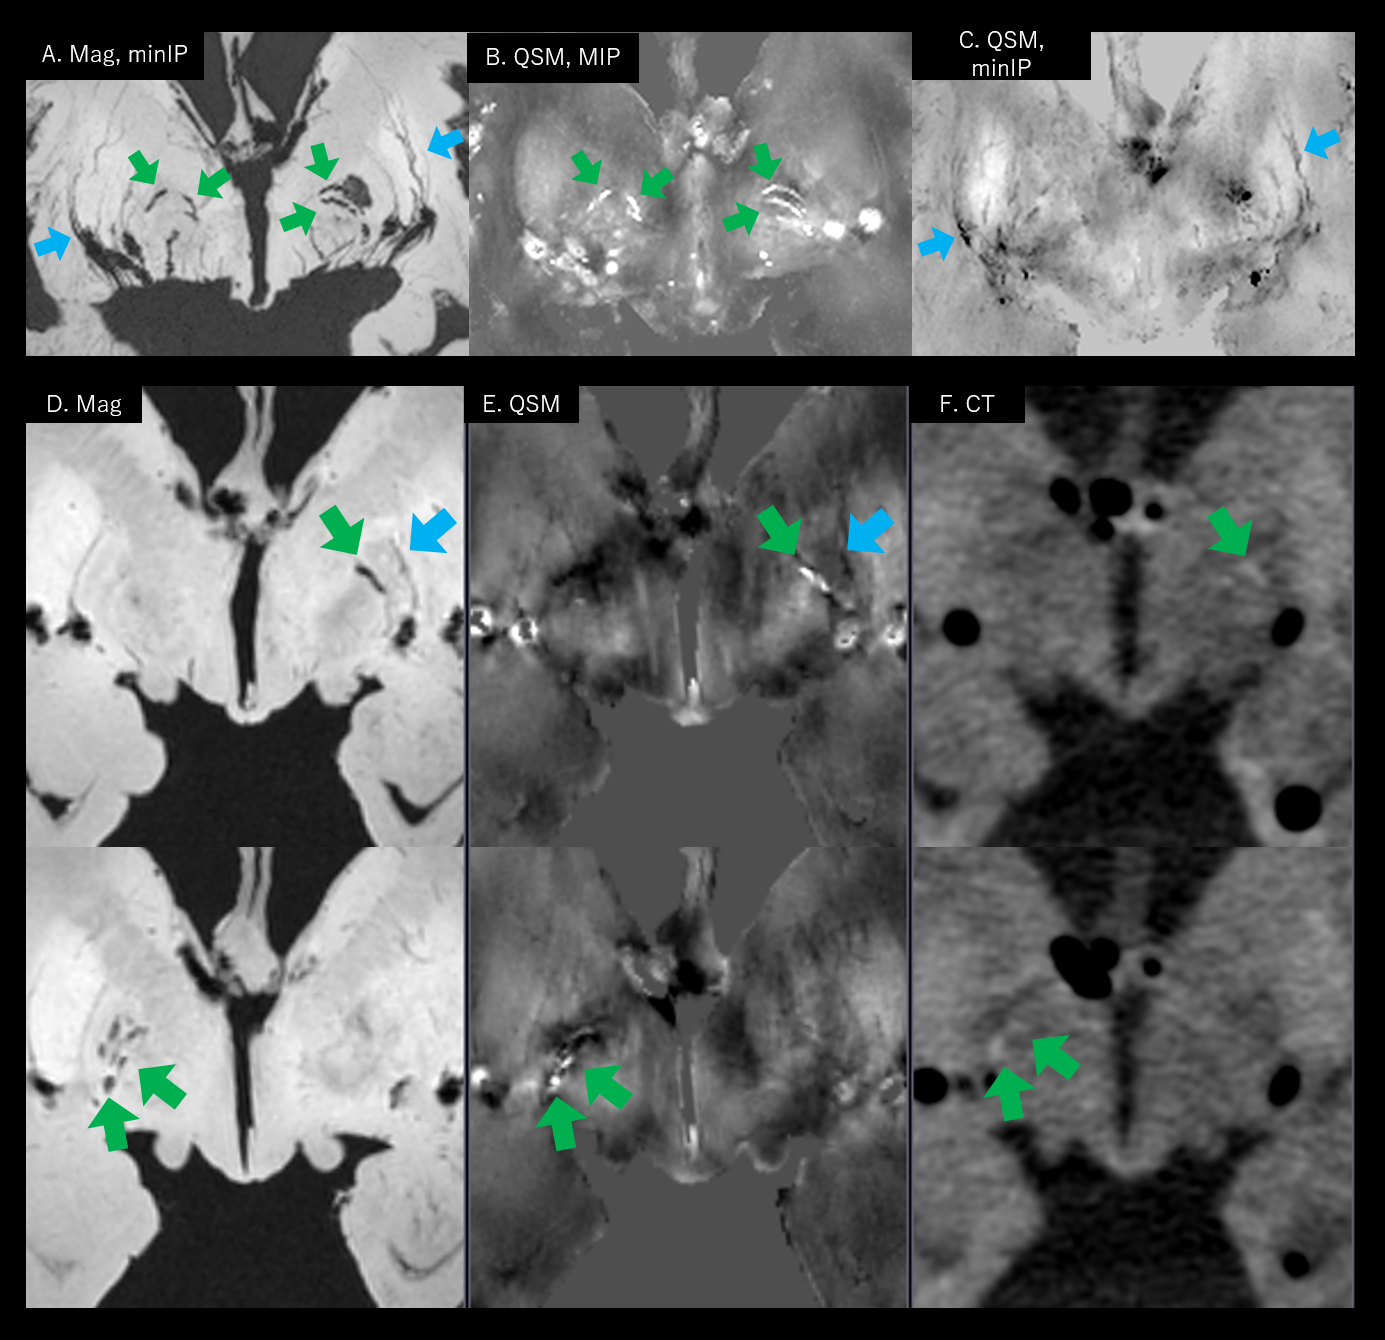
On 3T MR images of subject A, many vascular structures passed through basal ganglia (Figure 2). While majority of those vessels were diamagnetic, several vessels in GP are paramagnetic focally, which was very similar to in-vivo observation (Figure 1). On CT scans, there were calcific densities in GP, partly matched with paramagnetic structures on QSM. Subject B showed same findings (Figure 3) – some perforating vascular structures in GP were paramagnetic in QSM, and they were calcific density on CT scan. On 15.2T MR images of subject B (Figure 4), smaller vascular structures were clearly delineated in GP, and many of them were paramagnetic.
Histologic findings showed good correlation with MR images (Figure 3D and 4D). There were dense mineral depositions along the vessels of GP on H&E stain images, those were well-matched with paramagnetic and calcific vessels on ex-vivo images. On Perls’ stain images, deposition of iron was found along the paramagnetic arterial wall of GP. On von Kossa stain, calcium deposits were demonstrated at same vessels. Higher-magnification images (Figure 5) clearly show simultaneous deposits of iron and calcium at the tunica media and adventitia of a small arteriole in GP.
Discussion
In this study, we investigated detailed microstructures of GP found on MR. There were paramagnetic structures were vessels, and there was mixed deposition of iron and calcium along them. These were described as siderocalcinosis (calcium) and ferruginization (iron) in pathologic literatures.13 They were frequently found in old age subjects, and association with hypoparathyroidism and HIV infection were suggested. In this perspective, high resolution MRI and QSM might have clinical potential to demonstrate vascular degeneration and metabolic brain diseases.
Conclusion
Linear and curvilinear paramagnetic structures in GP was mineral-deposited perforating arteries, which are mixture of iron and calcification at the arterial wall.Acknowledgements
This research was supported by Basic Science Research Program through the National Research Foundation of Korea (NRF) funded by the Ministry of Education (NRF-2017R1D1A1B03033829 and NRF-2017R1D1A1B03030772).References
1. Liu C, Li W, Tong KA, Yeom KW, Kuzminski S. Susceptibility-weighted imaging and quantitative susceptibility mapping in the brain. Journal of Magnetic Resonance Imaging. 2015;42:23-41.
2. Chen W, Zhu W, Kovanlikaya I, Kovanlikaya A, Liu T, Wang S, et al. Intracranial calcifications and hemorrhages: Characterization with quantitative susceptibility mapping. Radiology. 2014;270:496-505.
3. Langkammer C, Schweser F, Krebs N, Deistung A, Goessler W, Scheurer E, et al. Quantitative susceptibility mapping (QSM) as a means to measure brain iron? A post mortem validation study. Neuroimage. 2012;62:1593-1599.
4. Bilgic B, Pfefferbaum A, Rohlfing T, Sullivan EV, Adalsteinsson E. Mri estimates of brain iron concentration in normal aging using quantitative susceptibility mapping. Neuroimage. 2012;59:2625-2635.
5. Moon Y, Han SH, Moon WJ. Patterns of brain iron accumulation in vascular dementia and Alzheimer's dementia using quantitative susceptibility mapping imaging. J Alzheimers Dis. 2016;51:737-745.
6. Lee S, Nam Y, Jang J, Na GH, Kim DG, Shin NY, et al. Deep gray matter iron measurement in patients with liver cirrhosis using quantitative susceptibility mapping: Relationship with pallidal T1 hyperintensity. J Magn Reson Imaging. 2018;47:1342-1349.
7. Valdes Hernandez Mdel C, Glatz A, Kiker AJ, Dickie DA, Aribisala BS, Royle NA, et al. Differentiation of calcified regions and iron deposits in the ageing brain on conventional structural mr images. J Magn Reson Imaging. 2014;40:324-333.
8. Chew AP, Gupta G, Alatakis S, Schneider-Kolsky M, Stuckey SL. Hippocampal calcification prevalence at CT: A retrospective review. Radiology. 2012;265:504-510.
9. Yamada N, Imakita S, Sakuma T, Takamiya M. Intracranial calcification on gradient-echo phase image: Depiction of diamagnetic susceptibility. Radiology. 1996;198:171-178.
10. Harder SL, Hopp KM, Ward H, Neglio H, Gitlin J, Kido D. Mineralization of the deep gray matter with age: A retrospective review with susceptibility-weighted mr imaging. AJNR Am J Neuroradiol. 2008;29:176-183.
11. Ide S, Kakeda S, Ueda I, Watanabe K, Murakami Y, Moriya J, et al. Internal structures of the globus pallidus in patients with parkinson's disease: Evaluation with quantitative susceptibility mapping (QSM). Eur Radiol. 2015;25:710-718.
12. Li W, Wang N, Yu F, Han H, Cao W, Romero R, et al. A method for estimating and removing streaking artifacts in quantitative susceptibility mapping. Neuroimage. 2015;108:111-122
13. Ellison D, Love S, Chimelli LMC, Harding B, Lowe JS, Vinters HV, et al. Neuropathology: A reference text of CNS pathology. Elsevier Health Sciences; 2012.
Figures