2614
MR neuroimaging and pons proton spectroscopy in type 1 narcolepsy1Department of Biomedical and NeuroMotor Sciences, Functional MR Unit, University of Bologna, Bologna, Italy, 2Department of Physics and Astronomy, University of Bologna, Bologna, Italy, 3IRCCS Istituto delle Scienze Neurologiche di Bologna, Bologna, Italy, 4Department of Biomedical and NeuroMotor Sciences, University of Bologna, Bologna, Italy
Synopsis
Narcolepsy type 1 (NT1) is a rare and life-long disease, characterized by central hypersomnia and cataplexy typically triggered by emotions. NT1 is linked to a selective loss of hypothalamic hypocretin neurons. To characterise neurodegeneration, we combined pons 1H-MRS and whole brain structural analysis in a large and homogenous sample of adult NT1 patients. 1H-MRS showed evidence of pontine neuronal dysfunction, consistent with its key role in REM sleep regulation. Grey matter loss was detected in brain regions implicated in the disease pathophysiology, including frontal-prefrontal cortices, putamen nuclei, thalami, hypothalamus, amygdalae, cerebellum, and widespread subtle tissue microstructural alterations were also found.
Introduction
Narcolepsy type 1 (NT1) is a rare central sleep disorder characterized by excessive daytime sleepiness and cataplexy, i.e. sudden episode of paralysis of voluntary muscle triggered by strong emotions, sleep paralysis, hypnagogic hallucinations and disrupted nocturnal sleep1. NT1 is caused by loss of orexin-producing neurons in the postero-lateral hypothalamus, which project to widespread brain and brainstem areas2. Most previous proton MRS studies of NT1 patients have focused on neurodegenerative changes in hypothalamus3,4,5, while in the pons inconsistent results regarding metabolites concentrations have been found in limited cohorts6,7. Similarly, previous structural neuroimaging studies have shown controversial results consistent with the inhomogeneity of study population and image analysis methods employed8. The aim of this study was to test for metabolic alterations in the pons by 1H-MRS, and to brain grey and white matter alterations by VBM and TBSS analyses, in a large cohort of adult NT1 cases.Methods
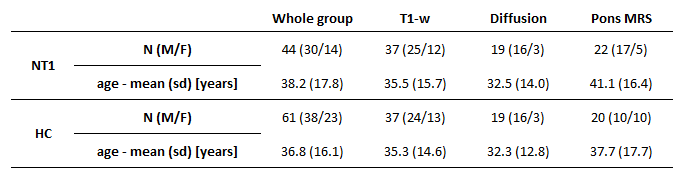
We evaluated 44 NT1 patients, who underwent brain MR in their diagnostic workup to exclude symptomatic forms due to other neurological diseases. Acquisitions were performed with a 1.5T GE scanner, equipped with a head coil. The standardized MR protocol included single voxel 1H-MR spectroscopy (PRESS) with localization in the pons (TR/TE=1500/40ms; NS=512, volume of interest mean[SD] 1.78[1.09] ml), volumetric T1-w images (TR/TE/TI=12.5/5.1/600ms, 1mm3 isotropic) and diffusion-weighted MRI (TR/TE=10.000/87.5ms, 25 directions, b-value=900 mm2s−1, voxel=1.25x1.25x4mm). Not all the patients completed the whole protocol; groups of sex- and age-matched healthy controls were included in the analysis (Table 1). Spectral analyses were performed with LC Model 6.3, and N-acetyl-aspartate (NAA), choline (Cho) and myo-Inositol (mI) concentrations were expressed relative to creatine (Cr). Voxel-based morphometry (VBM) analyses were performed on T1-w images using SPM 12.0. After a bicommissural realignment and tissue segmentation, grey matter images were aligned to an iteratively-created study specific template (DARTEL), registered to the MNI-152 template and spatially smoothed (gaussian kernel, FWHM 5mm). Diffusion-weighted data underwent standard pre-processing and tensor fitting. Voxelwise analysis of tensor parameters was then performed using TBSS (Tract-Based Spatial Statistics). Fractional anisotropy (FA) images for all subjects were non-linearly aligned, a mean FA image was created and thinned to create a skeleton representing the centres of all tracts common to the group. Each subject's data was then projected onto this skeleton and the resulting data fed into voxelwise cross-subject statistics. Similar comparisons were performed on MD (mean diffusivity), AD (axial diffusivity) and RD (radial diffusivity) maps. Group comparisons were performed with univariate analyses (SPSS®); voxelwise comparisons were non-parametric (permutation method) with age and sex (and TIV for VBM) as nuisance regressors. Statistical significance was set to p<0.05 (corrected for multiple comparisons).Results
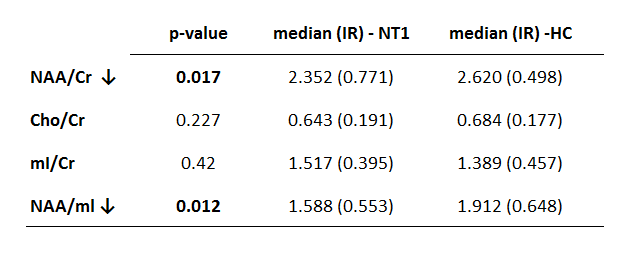
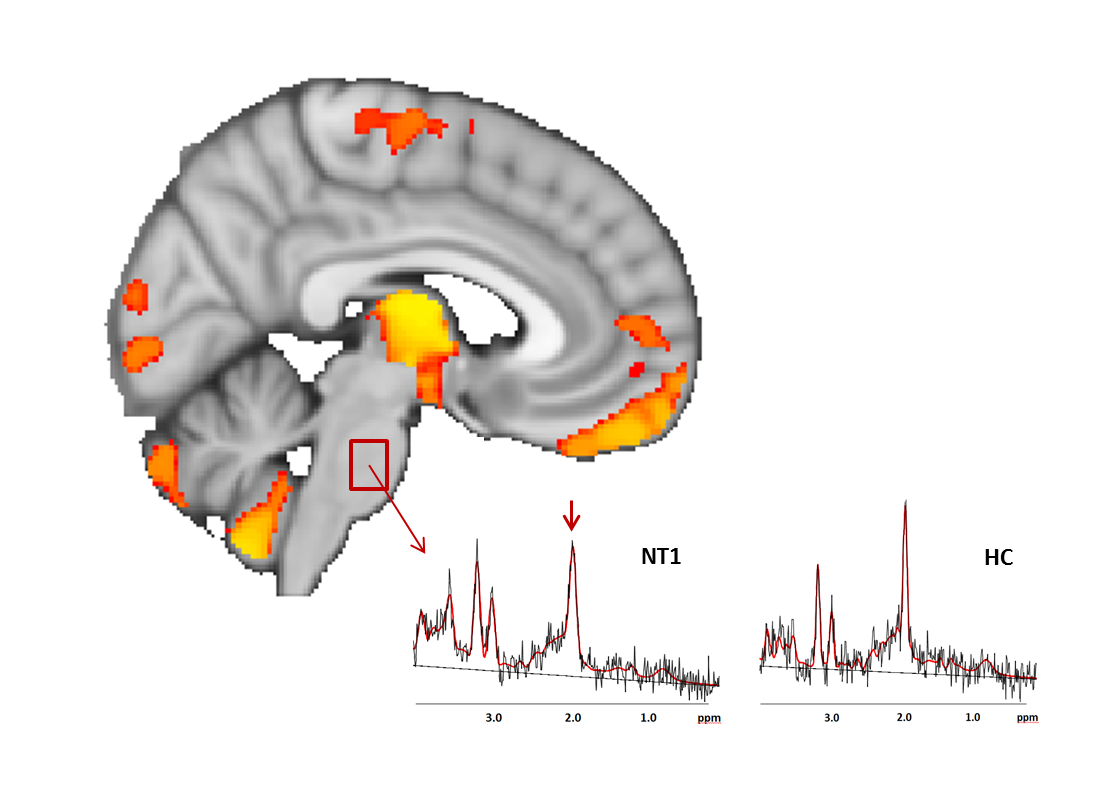
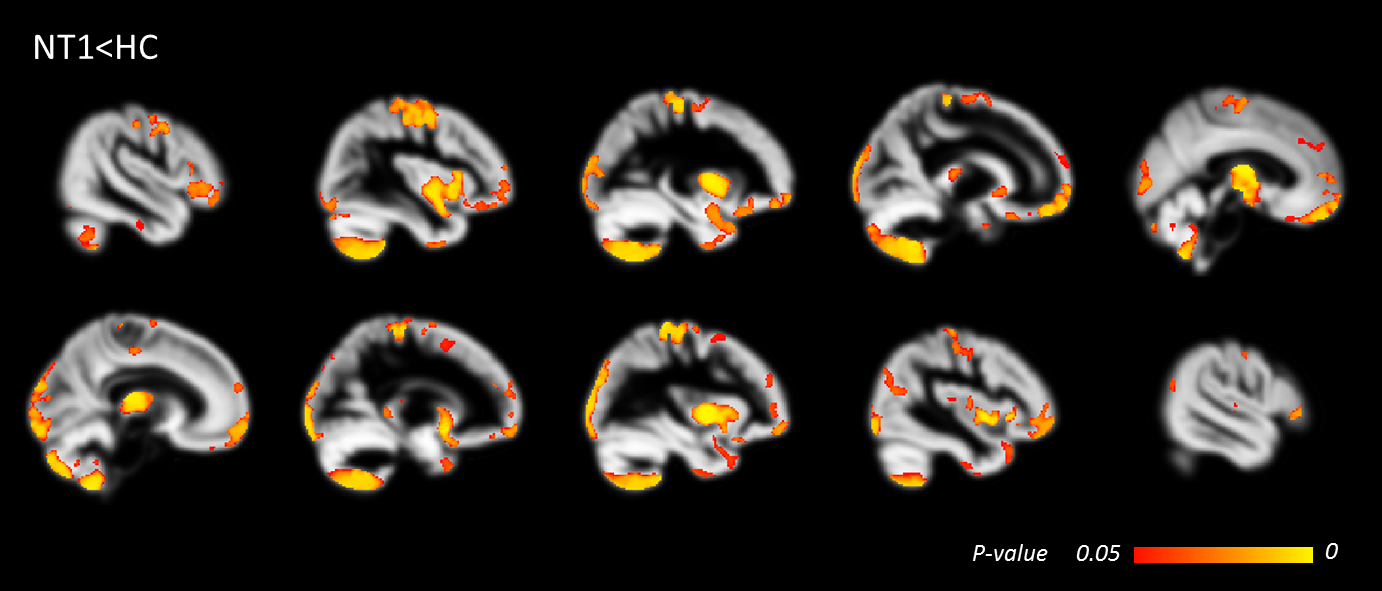
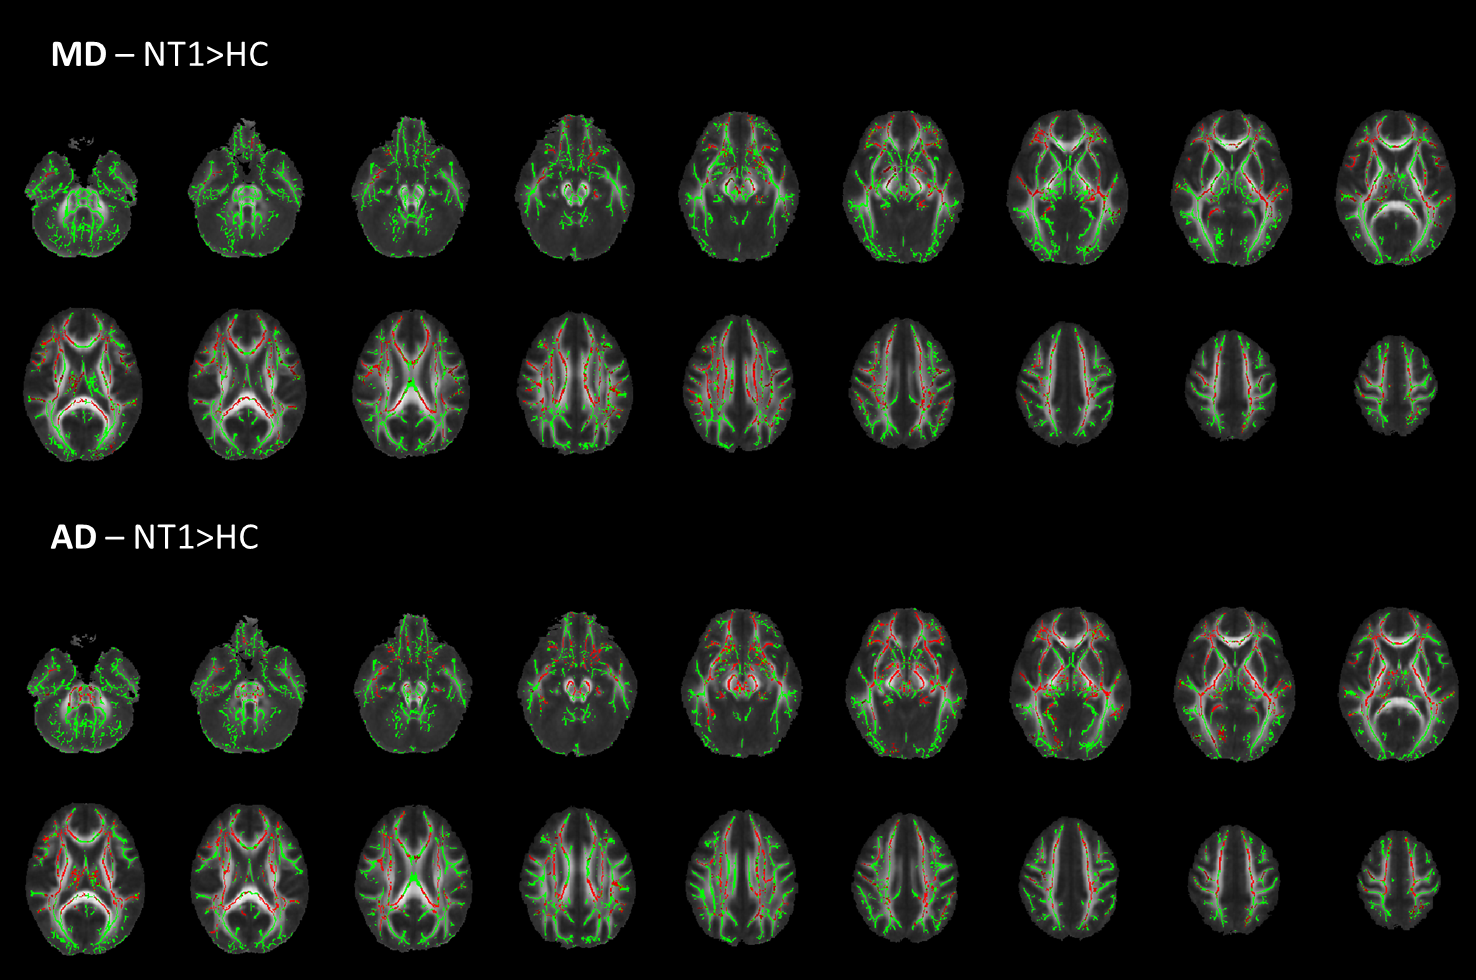
NAA/Cr and NAA/mI were significantly lower in patients compared to controls (Table 2). Figure 1 shows the voxel localization of pons spectroscopy and two spectra, acquired from a HC subject and an NT1 patient, showing the reduced NAA content. VBM analysis revealed grey matter density loss for NT1 patients mainly in precentral and postcentral gyri, frontal gyri, frontal pole, frontal operculum cortex, frontal orbital cortex, lateral occipital cortex, insular cortex, bilateral putamen nuclei, bilateral thalami, hypothalamus, amygdala, hippocampus, temporal poles and cerebellum (Figure 2). MD and AD values were found significantly higher in NT1 patients, mainly in corpus callosum, frontal white matter, corticospinal tract and thalamic area (Figure 3). Differences in FA and RD values between patients and controls were slightly below the significance threshold.Discussion and conclusions
Pons is considered a central structure in the pathophysiology of NT1, because of the presence of the reticular regions implicated in REM sleep regulation9 and circuits involved in muscle paralysis during cataplexy1, but consistent alterations have not as yet been observed using advanced MRI techniques. This study demonstrated in NT1 patients a neuro-axonal degeneration in the pons (lower NAA/Cr and NAA/mI) related to its inability in the inhibition of REM sleep. In comparison to previous pons MRS studies, our cohort size is larger and homogeneous regarding the presence of cataplexy. As for the morphological and microstructural aspects, we found decreased grey matter in all brain regions involved in the pathophysiology of the disease (Figures 1,2) in particular in the medial prefrontal cortex that receives excitatory projection from the hypothalamus, in areas involved in the emotional circuit (insula and hippocampal) and in the cerebellum10, and TBSS showed subtle widespread microstructural alterations rather than focal loss of integrity in multiple white matter tracts.Acknowledgements
No acknowledgement found.References
- Scammell TE. Narcolepsy. N Engl J Med. 2015 Dec 31;373(27):2654-62.
- Peyron C, Tighe DK, van den Pol AN, de Lecea L, Heller HC, Sutcliffe JG, Kilduff TS. Neurons containing hypocretin (orexin) project to multiple neuronal systems. J Neurosci. 1998 Dec 1;18(23):9996-10015.
- Tonon C, Franceschini C, Testa C, Manners DN, Poli F, Mostacci B, Mignot E, Montagna P, Barbiroli B, Lodi R, Plazzi G. Distribution of neurochemical abnormalities in patients with narcolepsy with cataplexy: An in vivo brain proton MR spectroscopy study. Brain Res Bull. 2009 Sep 28;80(3):147-50.
- Poryazova R, Schnepf B, Werth E, Khatami R, Dydak U, Meier D, Boesiger P, Bassetti CL. Evidence for metabolic hypothalamo-amygdala dysfunction in narcolepsy. Sleep. 2009 May;32(5):607-13.
- Lodi R, Tonon C, Vignatelli L, Iotti S, Montagna P, Barbiroli B, Plazzi G. In vivo evidence of neuronal loss in the hypothalamus of narcoleptic patients. Neurology. 2004 Oct 26;63(8):1513-5.
- Ellis CM, Simmons A, Lemmens G, Williams SC, Parkes JD. Proton spectroscopy in the narcoleptic syndrome. Is there evidence of a brainstem lesion? Neurology. 1998 Feb;50(2 Suppl 1):S23-6.
- Bican A, Bora I, Algin O, Hakyemez B, Ozkol V, Alper E. Neuroimaging in narcolepsy. Sleep Med. 2010 Feb;11(2):225-6.
- Wada M, Mimura M, Noda Y, Takasu S, Plitman E, Honda M, Natsubori A, Ogyu K, Tarumi R, Graff-Guerrero A, Nakajima S. Neuroimaging correlates of narcolepsy with cataplexy: A systematic review. Neurosci Res. 2018 Mar 23.
- Plazzi G, Montagna P, Provini F, Bizzi A, Cohen M, Lugaresi E. Pontine lesions in idiopathic narcolepsy. Neurology. 1996 May;46(5):1250-4.
- Tondelli M, Pizza F, Vaudano AE, Plazzi G, Meletti S. Cortical and Subcortical Brain Changes in Children and Adolescents With Narcolepsy Type 1. Sleep. 2017 Dec 13.
Figures