2613
A multiparametric study of prion disease1Brain Repair and Rehabilitation, Institute of Neurology, London, United Kingdom, 2Brain repair and rehabilitation, Institute of Neurology, London, United Kingdom, 3University of Cardiff, Brain research imaging centre, Cardiff, United Kingdom, 4Neurodegenerative diseases, Institute of Neurology, London, United Kingdom, 5MRC prion unit, Institute of Neurology, London, United Kingdom, 6Medical Physics and Biomedical Engineering, University College of London, London, United Kingdom, 7MRC Prion unit, Institute of Neurology, London, United Kingdom
Synopsis
In this work, we hypothesize that the metabolic changes occurring in the brain of prion-infected mice due to conformational changes of prion protein can be mapped using CEST MRI following previous in vivo work. Our previous findings include reduced Nuclear Overhauser Effect mediated by exchange-relayed signals in thalamus and cortex of prion-infected mice possibly related to up normal prion protein folding. Here we extend our studies by including a rich multipower acquisition scheme for targeting exchange processes falling at different regimes. For understanding the origin of CEST signal alternations T1, T2, and MT maps are included as well as histological findings.
Introduction
In this study, we extend our previous work in prion-infected mice1,2 by monitoring the chemical exchange signals for different exchangeable proton groups by collecting data at five different irradiation amplitudes tuned to a different exchange regime. Furthermore, signal contaminations arising from T1, T2 and magnetization transfer processes were calculated separately for understanding the origin of CEST contrast alterations in prion-infected mice. Finally, to verify whether CEST signals in prion mice could probe neurodegeneration we correlated our CEST findings with immunohistochemical results.Methods
Animals
Two groups of 7-week-old FVB mice were intracerebrally inoculated with 30μl of 1% brain homogenate from Rocky Mountain Laboratory prion-infected mice (n=19) or brain homogenate from uninfected mice as controls (n=11). The prion-infected group was separated into three groups of mice scanned at different stages of prion disease: 80days post injection (dpi) – asymptomatic-stage (n=6), 130dpi – early-stage (n=6), and 160 dpi – late-stage (n=7). Control mice were separated into two groups: 80 dpi (n=5) and 160dpi (n=6). All mice were anaesthetized (1.5-1.8% isoflurane in 1.5% oxygen with balance in air) and scanned on a 9.4T Agilent system using a 33-mm- diameter transmit/receive coil (Rapid Biomedical).
CEST
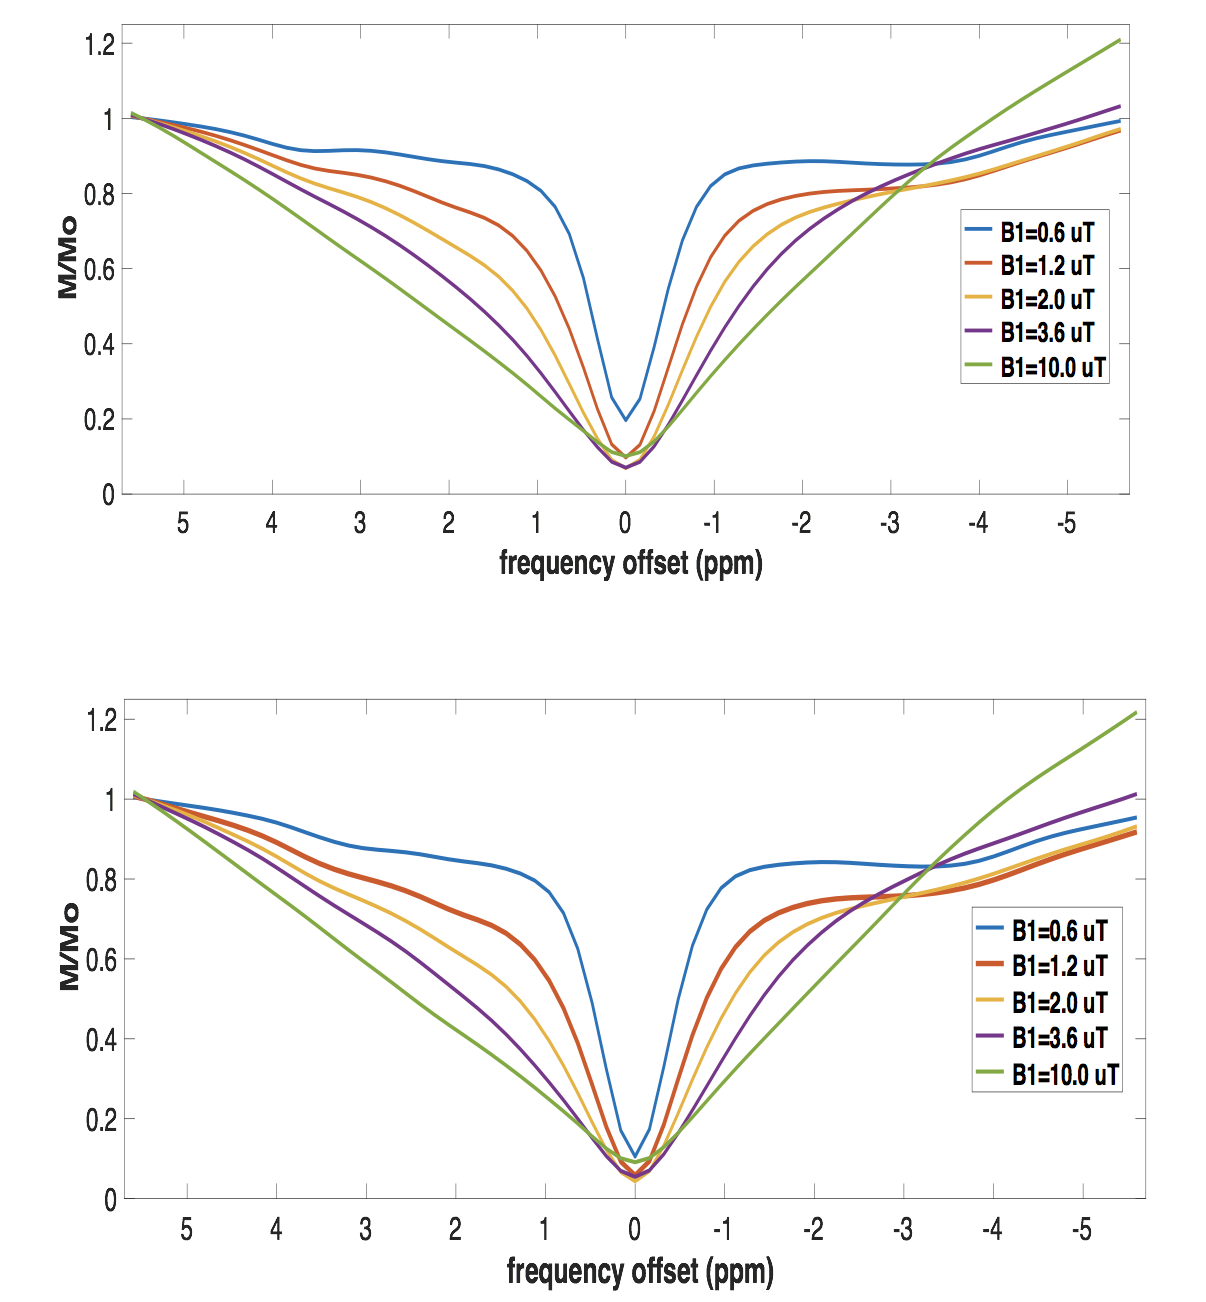
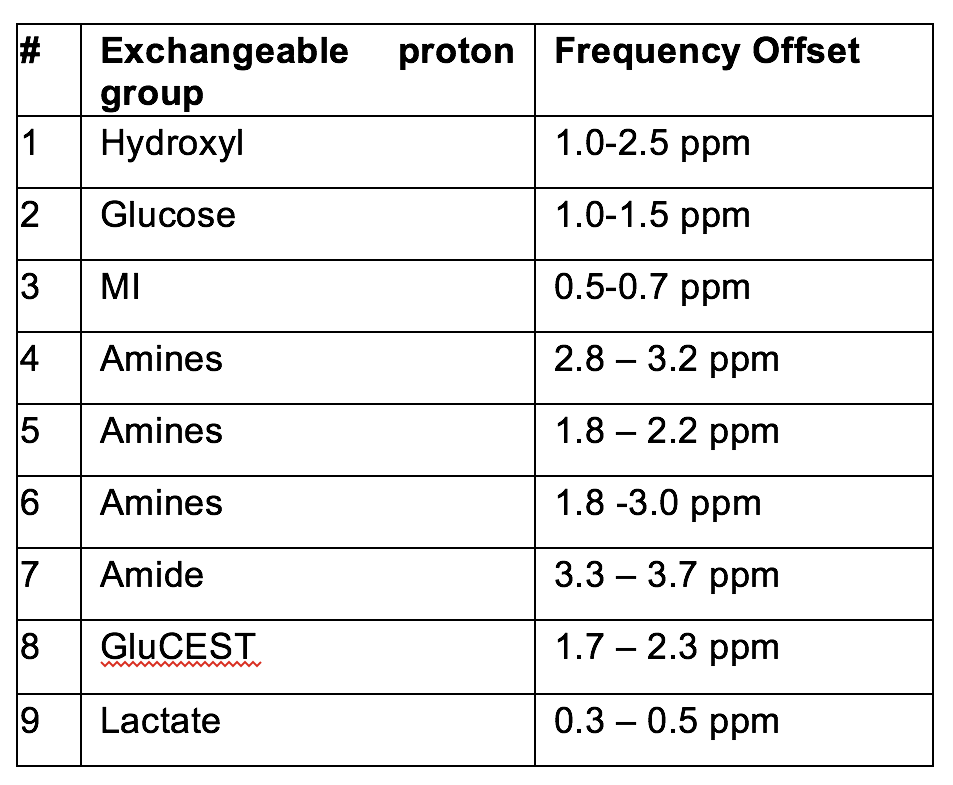
All images were acquired in a single slice (thickness=2mm), centred on thalamus. CEST measurements were acquired using a gradient-echo sequence (matrix: 64x64, TR=2.11ms, TE=1.07ms, FOV=20x20mm2) with a saturation train of Gaussian pulses at 0.6μT (n=80, pulse length=50ms, flip angle=360°, 90% duty cycle), 1.2μT (n=80, pulse length=50ms, flip angle=900°, 90% duty cycle), 2.0μT (n=60, pulse length=50ms, flip angle=1200°, 90% duty cycle), 3.6μT (n=40, pulse length=50ms, flip angle=2100°, 90% duty cycle) and 10μT (n=30, pulse length=50ms, flip angle=6000°, 99% duty cycle). Saturation was applied at 71 frequency offsets between -5.0 and 5.0ppm and at 25ppm for MT. MTR asymmetry analyses were performed for all proton groups listed in Table 1 at five different irradiation amplitudes3. Regional alterations in CEST signal have been assessed in the cortex and thalamus of prion-infected and control mice.
T1/T2
An inversion recovery EPI sequence was used to quantify the T1values. A global adiabatic inversion pulse (fa=180°, duration=2ms) was applied followed by 10 inversion times exponentially spaced from 8.1ms to 7.5s.For the quantification of T2values a CPMG sequence was used, consisting of a 90° Sinc-shaped excitation pulse along the x axis (duration=2ms) followed by 15 Sinc-shaped refocusing pulses along the y axis (fa=180°, duration=1.6ms).
Results
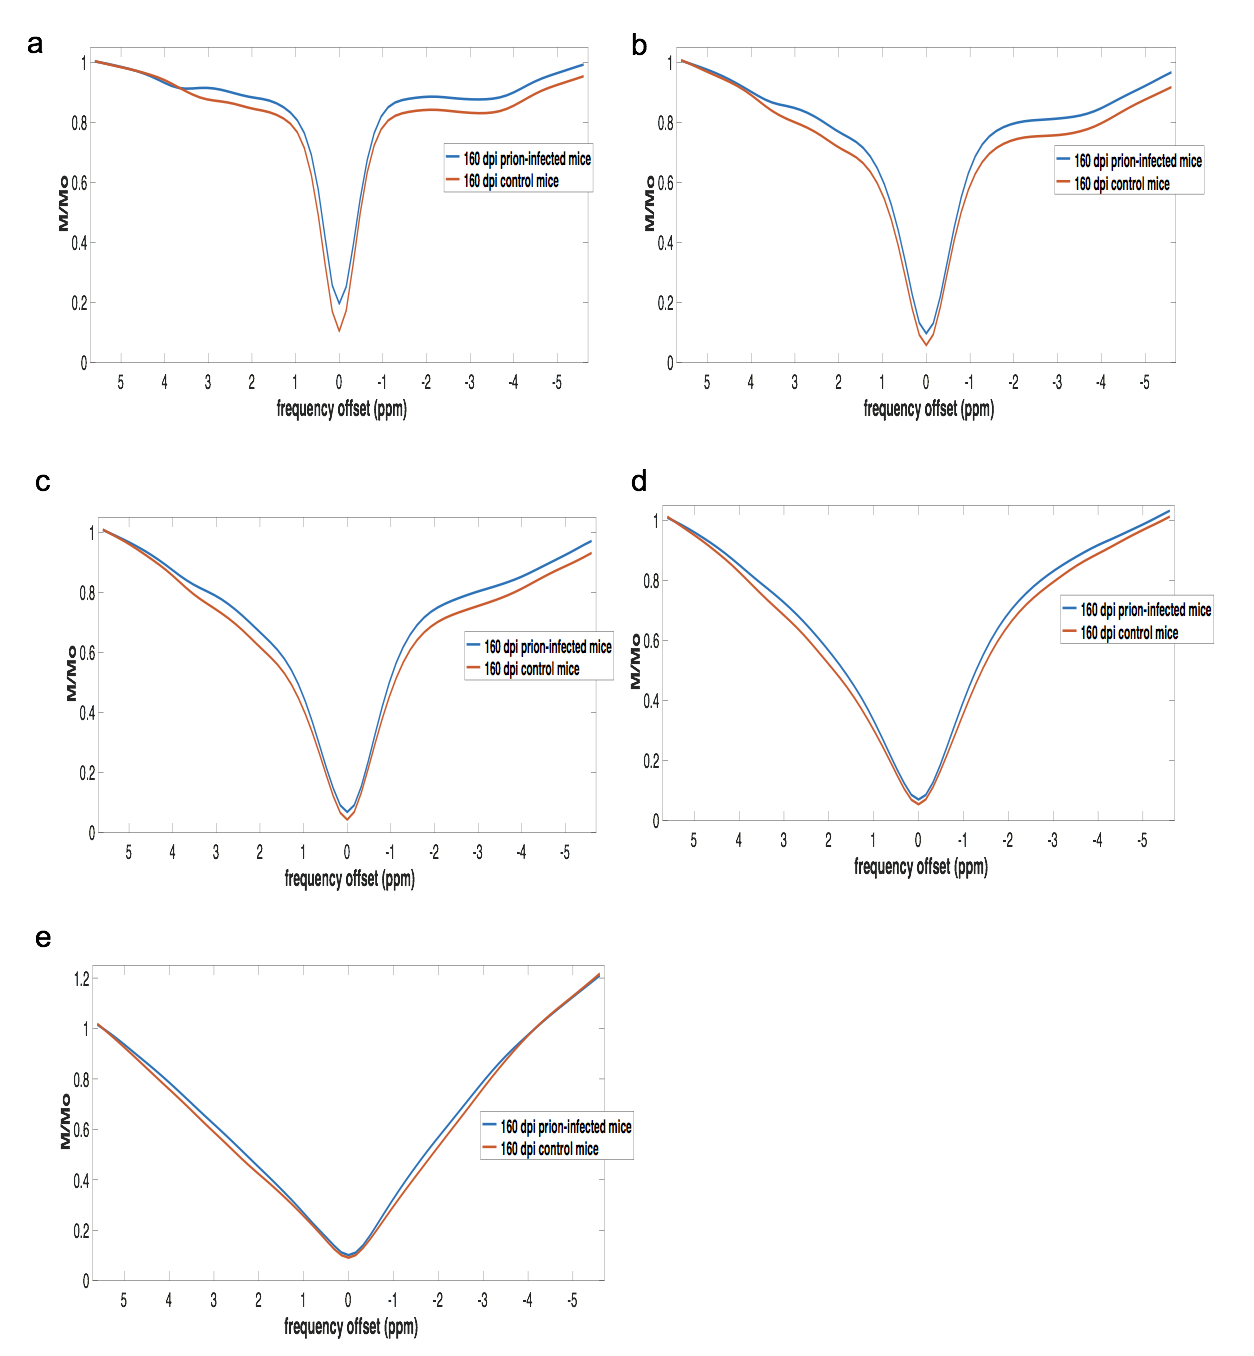
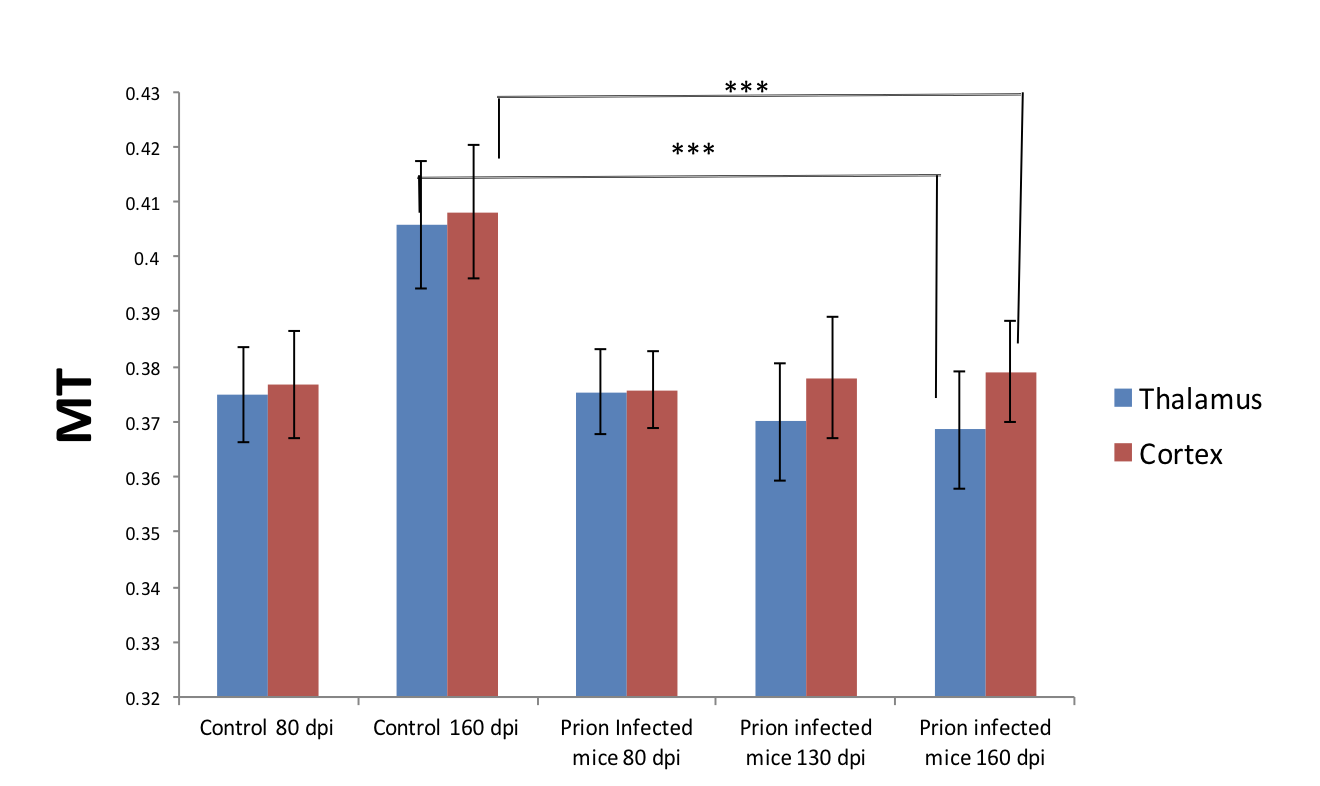
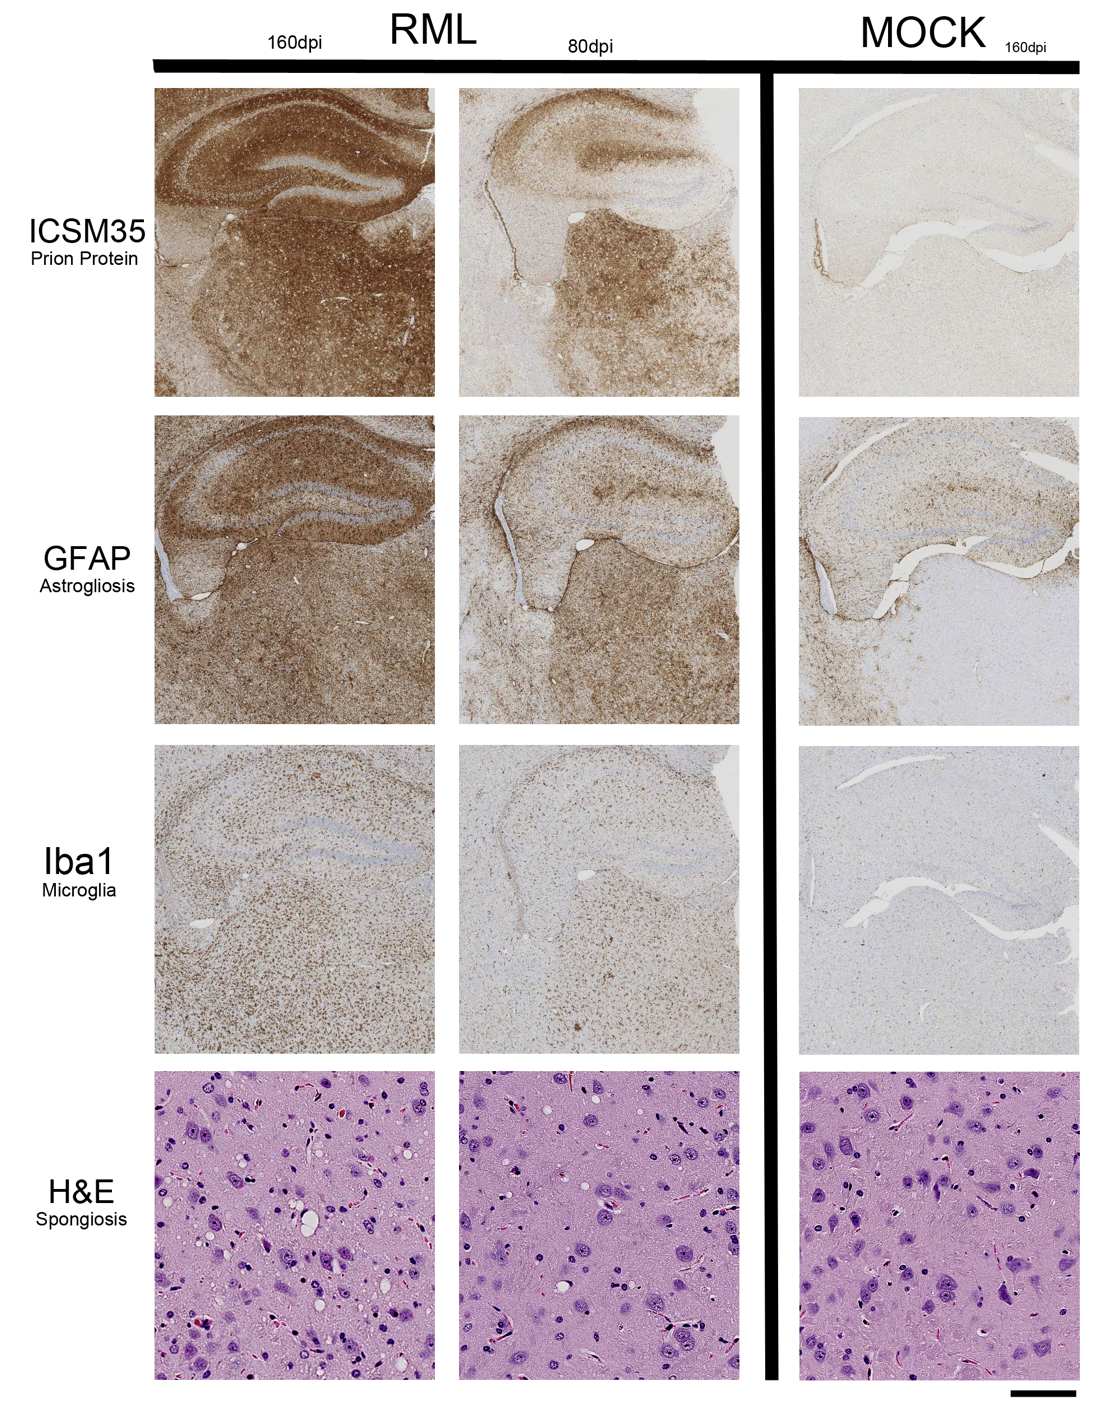
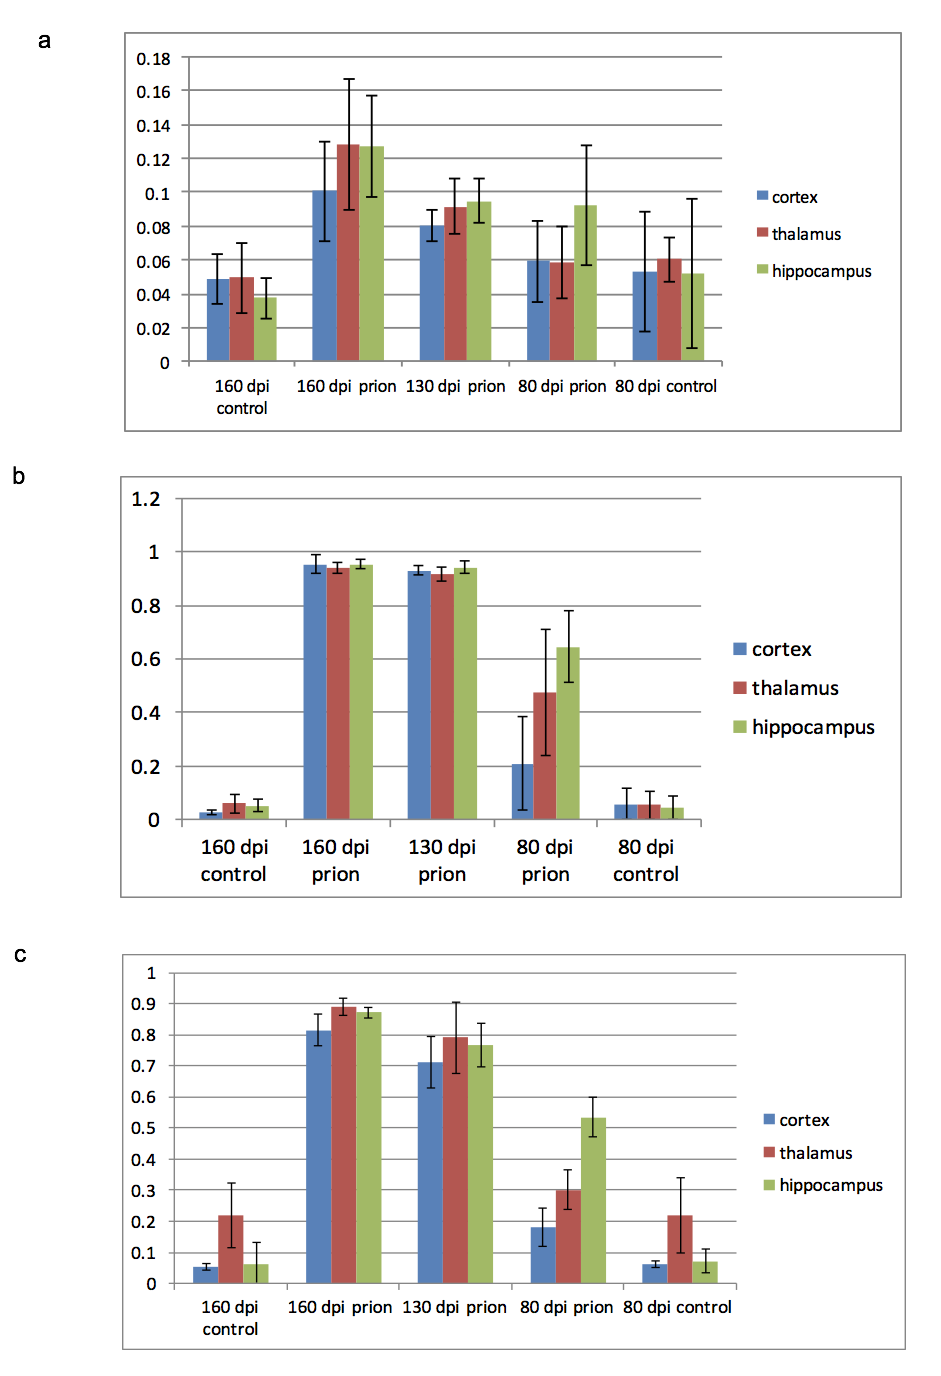
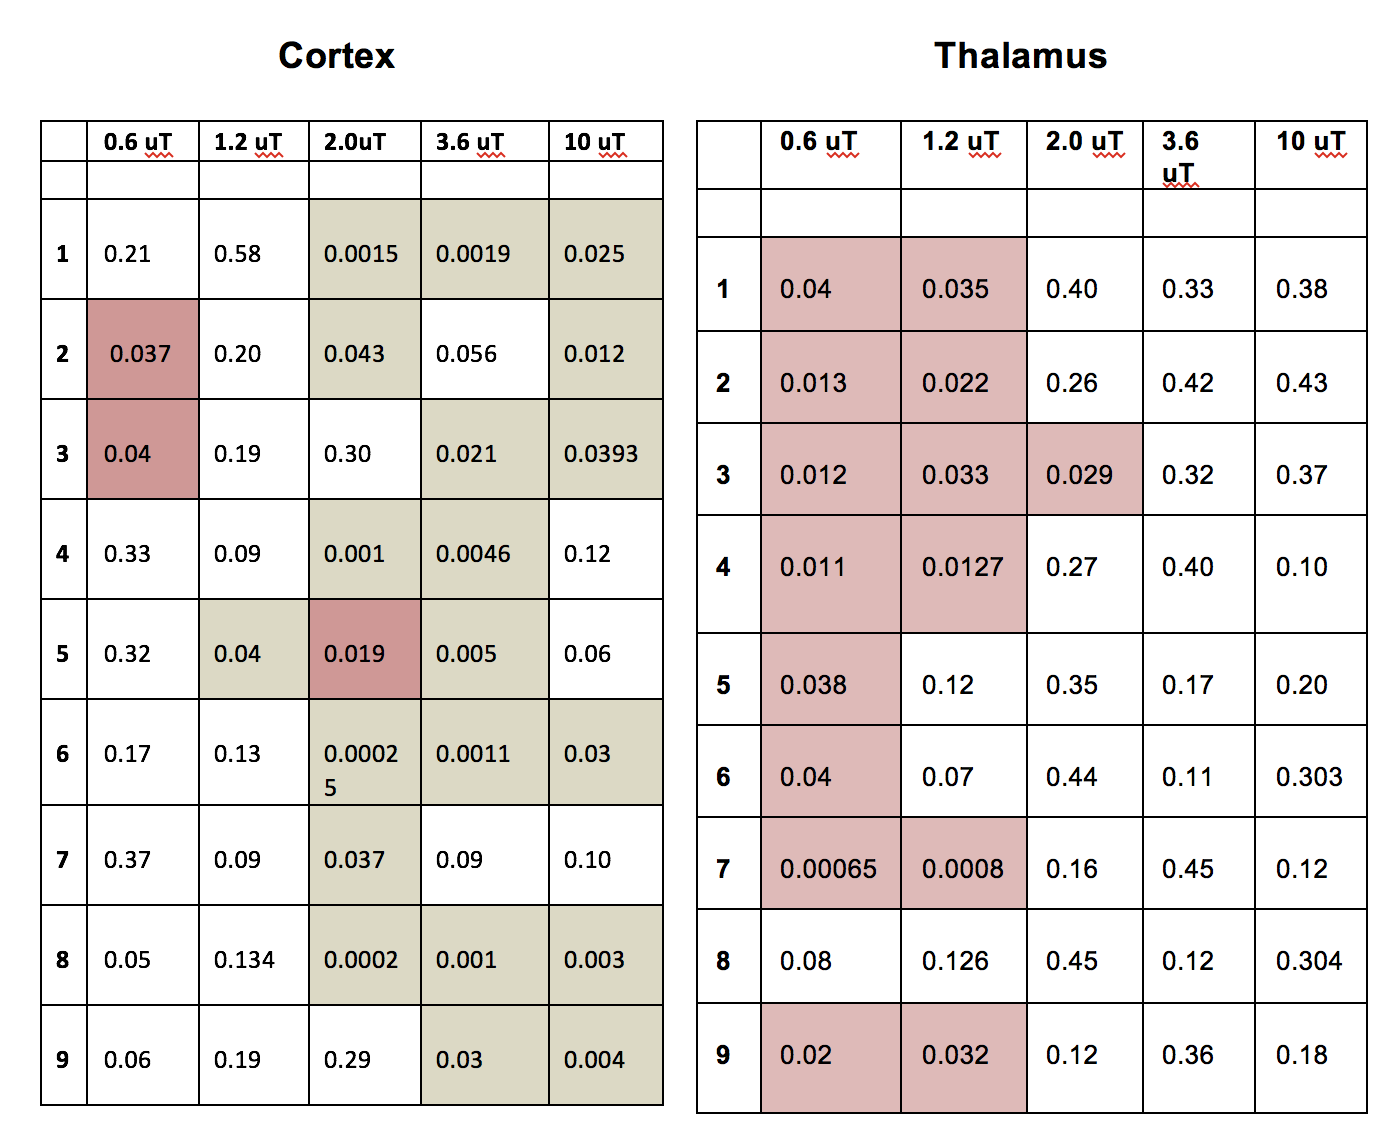
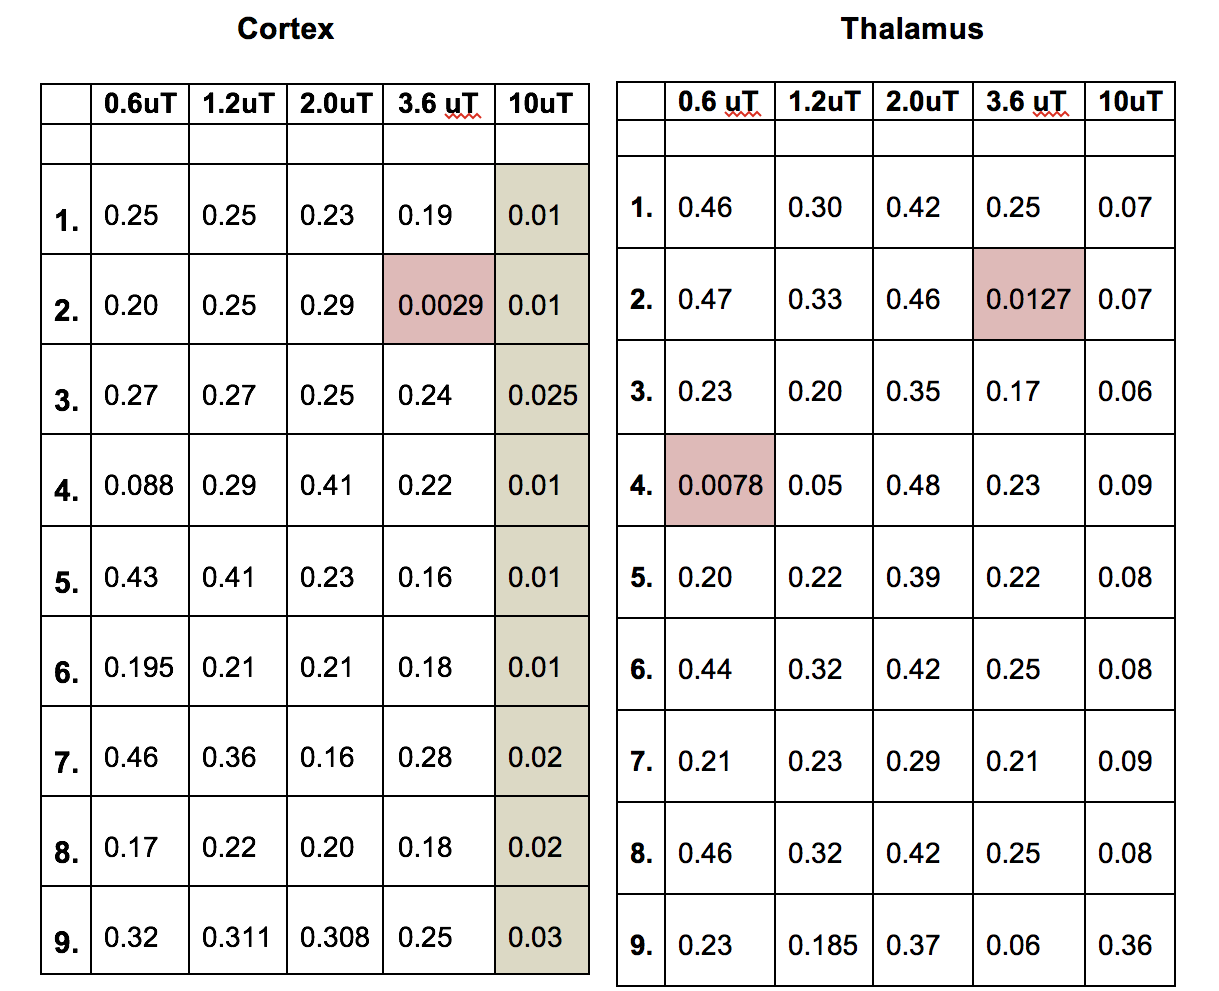
CEST: MTR asymmetries of late stage prion-infected mice were less negative compared to the MTR asymmetries of the control group in thalamus at 0.6 and 1.2 uT(Figures 1,2). In cortex, the MTR asymmetries were found to be decreased for the prion-infected mice compared to the control group (see Table 2). Significant differences were found between the asymptomatic prion-infected mice vs control mice in all frequency offsets at 10μT in cortex. Moreover, a significant increase was detected at 2.8-3.2ppm and 1.0-1.5ppm in thalamus (see Table 3). No significant changes were detected when comparing the 130-dpi prion-infected mice with 160dpi prion-infected mice.MT:Significant changes were detected in cortex and thalamus of 160dpi prion-infected mice when compared to 160dpi control mice (see Figure 3). Moreover, a significant increase of MTR was detected in thalamus and cortex of 160dpi versus 80 dpi control mice. T1,T2: The T2 values were found to be significantly higher in the thalamus of prion mice at all stages of the disease (T2=40msec, p=0.001) when compared to control mice (T2=37sec) and the T1was found to be significantly higher in cortex (T1=1.89sec, p= 0.0007) and hippocampus of only late stage prion mice when compared to aged-matched controls (T1=1.67sec).Immunohistochemical changes included deposition of prion protein, astrogliosis, microglia activity and spongiosis in several brain regions including thalamus, hippocampus and cortex of prion-infected mice (Figures 4,5).Discussion
Here we show that alterations in CEST signal are detected before structural modifications or any clinical signs of Prion disease. However, the larger changes were detected at the end stage of the disease and are in line with behavioural and histological results. In particular, we detected a negative correlation of the MTRasym with abnormal prion protein (R2= 0.83), negative correlation for microglia staining (R2= 0.68) and positive correlation for astrogliosis (R2= 0.74) in thalamus of late-stage mice. Another finding was that the detected CEST signals display different patterns at different stages of the disease indicating the potential for its use as a longitudinal marker of disease progression. Finally, signal contaminations arising from T1, T2 and MT processes contribute to the measured CEST signal and should be taken into account for the interpretation of these results.Acknowledgements
This project was funded by UCL Grand Challenge and supported by the National Institute for Health Research University College London Hospitals Biomedical Research Centre.References
1.DemetriouE, TachrountM.,RegaM., et al. CEST Nuclear Overhauser Enhancement (NOE) imaging of protein misfolding in mice at different stages of prion disease. #2324, Proc. ISMRM 2016, Singapore
2.DemetriouE, TachrountM., ShmueliK., et al. High-quality MRS detects metabolic changes in mice at different stages of prion disease. #1247, Proc. ISMRM 2016, Singapore
3.van Zijl PCM, Yadav NN. Chemical exchange saturation transfer (CEST): what is in a name and what isn’t? Magn Reson Med. 2011 Apr;65(4):927–48.
Figures