2606
Dynamics of white matter tract covariance across lifespan assessed with diffusion spectrum imaging1Department of Biomedical Engineering, National Taiwan University, Taipei, Taiwan, 2Institute of Medical Device and Imaging, National Taiwan University College of Medicine, Taipei, Taiwan, 3Acroviz Technology, Inc., Taipei, Taiwan, 4Department of Medical Imaging, National Taiwan University Hospital, Taipei, Taiwan, 5Molecular Imaging Center, National Taiwan University College of Medicine, Taipei, Taiwan
Synopsis
In this study, we calculated tract covariance to describe the phenomenon of white matter differentiation and de-differentiation across lifespan, using diffusion spectrum imaging (DSI) and whole brain tract-based automatic analysis (TBAA) techniques. Differentiation was found to be highest in the 2nd decade and de-differentiation started to emerge at 3rd decade and peaked at 6th decade.
Introduction
A previous study illustrated the de-differentiation of white matter tracts from middle to older age1. In this study, we aimed to explore the differentiation in brain development and verify the de-differentiation in brain ageing. To evaluate white matter differentiation and de-differentiation of people from young to senior age, we collected DSI data in 481 generally healthy people aged 5 to 74 years. We used TBAA to analyze the covariance between each pair of tracts.Methods
Subjects: We divided the participants into six groups per decade2 (See Table 1).
Imaging: We acquired data of T1-weighted imaging and DSI on a 3T MRI system (TIM Trio, Siemen) with a 32-channel phased array coil. T1-weighted imaging utilized a MPRAGE pulse sequence: TR/TE = 2000/3 ms, flip angle = 9o, FOV = 256 X 192 X 208mm3, resolution = 1 X 1 X 1 mm3. DSI used a pulsed gradient twice-refocused spin-echo diffusion echo-planar imaging sequence: 102 diffusion-encoding gradients with bmax of 4000 s/mm2, TR/TE = 9600/130 ms, FOV = 200 X 200 mm2, matrix size = 80 X 80, 56 slices, and slice thickness = 2.5 mm.
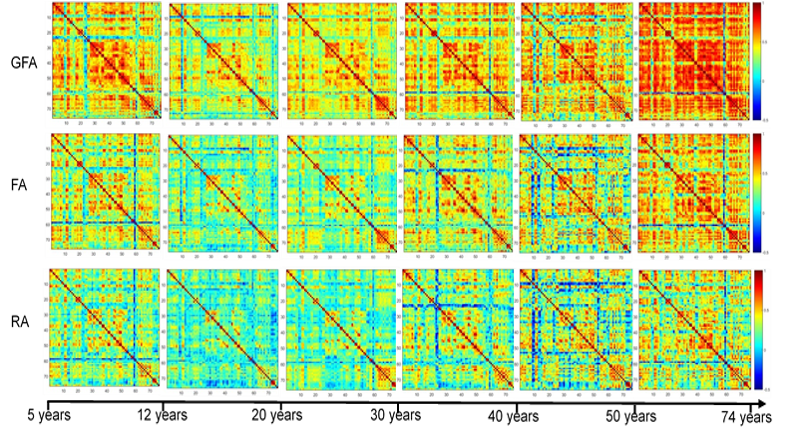
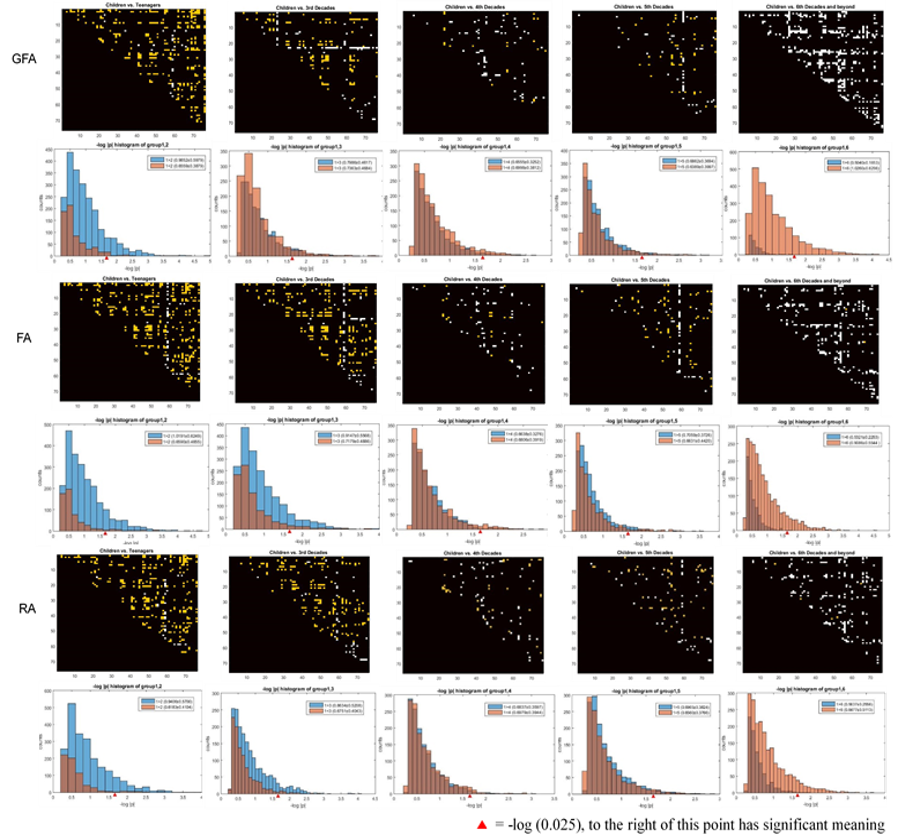
Analysis: We used TBAA to obtain GFA profiles of 76 white matter tract bundles for each participant3, and mean generalized fractional anisotropy (GFA), fractional anisotropy (FA), and relative anisotropy (RA) values were calculated for each tract. Among the 6 groups, we compared tract covariance which we defined as the partial correlation between each pair of tracts in variations of GFA, FA, RA values across subjects, with age, gender and dropout number of diffusion-weighted images being regressors. For statistics analysis, we used a permutation test to determine whether there were significant differences and describe the differences between group 1 and any other groups as well as the adjacent groups. We disturbed the data of the selected groups and regrouped them randomly. We calculated the new tract covariance and evaluated the difference of the original covariance maps across 2850 pixels. We permutated it for 342000 times and got 342000 tract covariance matrices to obtain 2850 empirical distributions of the differences. We put the difference of the original covariance and found the p value which was defined to be significant if it was located beyond 2 standard deviations. We took the -log of all p values for visualize the difference distribution, the greater the -log│p│, the more dramatic the difference. We overlapped the -log│p│ of the two comparisons groups to show the major trend of the dynamics.
Results
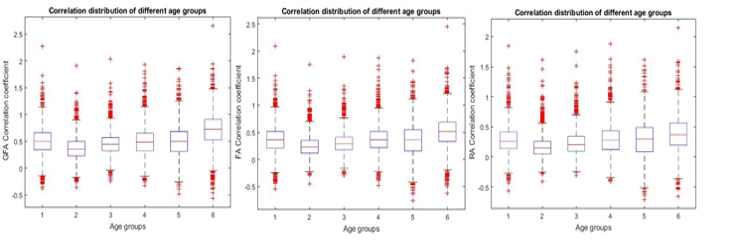
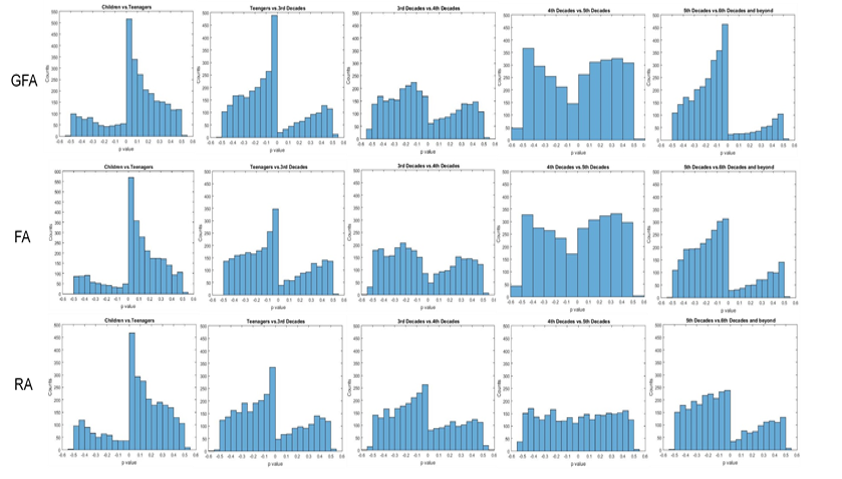
The correlations of GFA, FA and RA among tracts had the same trend of differentiation and de-differentiation of the brain. Each tract tends to perform independently from children to teenagers (differentiation) and loses its individualism (de-differentiation) from 3rd decade to 74 years (Figure 1 and 2). Figure 3 further verifies that de-differentiation started in the 3rd decade and became dramatic to the 4th decade. Meanwhile, the teenagers had the highest degree of differentiation while the 6th decade and beyond group had a remarkable degree of de-differentiation. Figure 4 demonstrates the consecutive change of the partial correlation between pairs of tracts, directly reflecting the tendency shown in Figure 2, which shows higher tract covariance in children than in teenagers, and the 3rd decade was significantly higher than teenagers. The 4th and 5th decades witnessed a very close de-differentiation tendency, and it peaked with a marked increase of covariance in group 6.Discussion
Tract covariance can indicate the dynamics of inter-dependence of the tracts. A possible explanation for teenagers sharing the best differentiation degree is the pruning effect, removing unnecessary neuronal structures and improving the brain processing efficiency4. Our findings corroborate the hypothesis of microstructural de-differentiation of white matter from middle to older age1. Using the same methodology, we further provided evidence of microstructural differentiation from children to teenagers.Conclusion
In present study, the dynamics in tract covariance was found in the observed groups. It might support the hypothesis of differentiation and de-differentiation of the brain across lifespan.Acknowledgements
No acknowledgement found.References
1. Cox, Simon R., et al. "Ageing and brain white matter structure in 3,513 UK Biobank participants." Nature communications 7 (2016): 13629.
2. Westlye, Lars T., et al. "Life-span changes of the human brain white matter: diffusion tensor imaging (DTI) and volumetry." Cerebral cortex 20.9 (2009): 2055-2068.
3. Chen, Yu‐Jen, et al. "Automatic whole brain tract‐based analysis using predefined tracts in a diffusion spectrum imaging template and an accurate registration strategy." Human brain mapping 36.9 (2015): 3441-3458.
4. Chechik, Gal, Isaac Meilijson, and Eytan Ruppin. "Neuronal regulation: A mechanism for synaptic pruning during brain maturation." Neural computation 11.8 (1999): 2061-2080.
Figures