2603
Structural MRI abnormalities and the immune system are correlated with neuroinflammation in Neuropsychiatric Systemic Lupus Erythematosus: a retrospective study on a large and well-defined patient cohort.1Department of Radiology, LUMC, Leiden, Netherlands, 2Department of Radiology, UMCU, Utrecht, Netherlands, 3Department of Radiology, UT Southwestern Medical Center, Dallas, TX, United States, 4Department of Rheumatology, LUMC, Leiden, Netherlands
Synopsis
Neuropsychiatric Systemic Lupus Erythematosus (NP-SLE) is associated with cerebral abnormalities, but their relation to the inflammatory and ischemic clinical phenotypes is unknown. We performed a retrospective structural brain study within a large, clinically well-defined patient cohort of NP-SLE patients (inflammatory and ischemic) and non-NP-SLE patients. Patients with inflammatory, but not ischemic, NP-SLE showed lower grey matter and white matter volumes, and higher White Matter Hyperintensity volumes compared to non-NP-SLE patients. Brain abnormalities were also associated with the complement system. In conclusion, only inflammatory NP-SLE showed more severe structural brain abnormalities, and these were associated with a specific complement component.
INTRODUCTION
Systemic Lupus Erythematosus (SLE) is an autoimmune disease characterized by the production of various auto-antibodies and a broad spectrum of clinical manifestations1,2. Neuro-Psychiatric involvement in SLE (NP-SLE) is uncommon and not well understood. Attribution of neuropsychiatric symptoms to SLE remains a challenge, given the lack of a gold standard in the diagnostic approach. These symptoms can be directly associated with SLE (NP-SLE), or can be secondary to side effects of medication or due to other organ involvement (non-NP-SLE). In clinical practice, a phenotypic approach is used to determine treatment, based on a suspected underlying mechanism: inflammatory or ischemic3.
Identification of brain imaging markers may help in the diagnosis of NP-SLE and help unravel the mechanisms underlying both clinical phenotypes.
Within a large and stratified cohort of SLE patients, we performed volumetric analyses of structural brain MRI data of NP-SLE and non-NP-SLE patients. Within the NP-SLE cohort, we also examined data based on clinical phenotype. Lastly, we studied whether brain abnormalities are associated with complement components (immune system).
METHODS
228 SLE patients were included in this study: 82 NP-SLE (30 ischemic, 52 inflammatory) and 146 non-NP-SLE. All patients underwent a one-day standardized evaluation comprising a combination of multidisciplinary medical assessments, brain MRI scan and blood samples to determine the presence of complement components4.
All participants were scanned on a Philips Achieva 3T MRI scanner. The scanning protocol consisted of 3D T1-weighted and fluid-attenuated inversion recovery (FLAIR) sequences. The FLAIR images were registered to the 3D T1-weighted images5,6. White matter hyperintensity (WMH) segmentations were performed on the registered FLAIR7 and thresholded on a probability of 0.2. Lesions filling was performed with the WMH segmentations on the 3D T1-weighted images. The resulting “lesion filled” 3D T1-weighted images were segmented to determine total intracranial volume (TIV), grey matter (GM) and white matter (WM) volumes8. Fig.1 shows the image-processing pipeline. Group differences in brain volumes and associations between volumes and complement proteins were studied by linear regression analyses corrected for age, gender and TIV. All analyses were performed by IBM SPSS version 23.
RESULTS
NP-SLE patients showed lower WM volumes and higher WMH volumes compared to non-NP-SLE patients (Fig.2A), but GM volumes were not different across subject groups. Patients with inflammatory NP-SLE showed lower WM and GM volumes and higher WMH volumes compared to patients with non-NP-SLE. Patients with ischemic NP-SLE showed no differences in brain volumes or WMH volumes compared to patients with non-NP-SLE (Fig.2B). Furthermore, the classical complement components (C1qLow, C3qLow and C4qLow) were significantly associated with brain tissue volumes. Within the NP-SLE cohort, C1qLow was the only factor significantly associated with all tissue volumes. We also investigated whether the C1qLow association could be attributed to a specific phenotype. We found that C1qLow was associated with WM atrophy and WMH volume in NP-SLE inflammatory patients, but not with GM atrophy. In the ischemic phenotype, C1qLow is associated only with GM atrophy (Table 1A-B).DISCUSSION AND CONCLUSION
This is the first comprehensive brain volumetric study on NP-SLE within a large and clinically well-defined cohort. As previously reported9,10, more atrophy and WMH volumes were found in NP-SLE patients compared to non-NP-SLE patients. Our main new finding is that these brain abnormalities are preferential in inflammatory NP-SLE. These results indicate a relationship between inflammation and brain atrophy and WMH volumes in NP-SLE.
Complement components were associated with WM and GM atrophy in the entire SLE-cohort. In NP-SLE patients, c1qLow was found to be significantly correlated with these brain abnormalities and with WMH volumes. In particular, in the inflammatory subgroup, C1qLow was related to WM atrophy and WMH volumes while the ischemic subgroup was associated with GM atrophy. The complement system is part of the immune system. The involvement of complement proteins in the pathogenesis of autoimmune diseases, including SLE, is well accepted but their exact role is still unclear11. Evidence from studies on childhood-onset SLE and Alzheimer disease indicated a correlation between atrophy and complement components12,13. Our results suggest that complement components may play a role in the aetiology of atrophy in SLE patients and in the inflammatory phenotype specifically in the aetiology of WMH volumes.
In conclusion, brain abnormalities were most severe in inflammatory NP-SLE. The correlation of WM atrophy and WMH volumes with C1qLow in the inflammatory phenotype may help understand the pathophysiological mechanism underlying the inflammatory process in NP-SLE. Preclinical and clinical studies support the use of complement-targeted therapy in the treatment of SLE11. Further investigations are needed to show the possibility to develop treatment based on C1qLow-target for NP-SLE patients, mostly for the inflammatory phenotype.
Acknowledgements
No acknowledgement found.References
1. Arbuckle, M.R., McClain, M.T., Rubertone, M.V., Scofield, R.H., Dennis, G.J., James, J.A. et al. (2003). "Development of autoantibodies before the clinical onset of systemic lupus erythematosus." N Engl J Med. 2003;349(16):1526-1533.
2. Brey, R.L., Holliday, S.L., Saklad, A.R., Navarrete, M.G., Hermosillo-Romo, D., Stallworth, C.L. et al. (2002)." Neuropsychiatric syndromes in lupus: prevalence using standardized definitions ." Neurology (2002); 58(8):1214-1220.
3. Magro-Checa C, Zirkzee EJ, Beaart-van de Voorde LJJ, Middelkoop HA, van der Wee NJ, Huisman MV, Eikenboom J, Kruyt ND, van Buchem MA, Huizinga TWJ, Steup-Beekman GM. Value of multidisciplinary reassessment in attribution of neuropsychiatric events to systemic lupus erythematosus: prospective data from the Leiden NPSLE cohort. Rheumatology (Oxford). 2017 Oct 1;56(10):1676-1683.
4. Zirkzee EJ, Steup-Beekman GM, van der Mast RC, Bollen EL, van der Wee NJ, Baptist E, Slee TM, Huisman MV, Middelkoop HA, Luyendijk J, van Buchem MA, Huizinga TW. Prospective study of clinical phenotypes in neuropsychiatric systemic lupus erythematosus; multidisciplinary approach to diagnosis and therapy. J Rheumatol. 2012 Nov;39(11):2118-26.
5. M. Jenkinson and S.M. Smith. A global optimisation method for robust affine registration of brain images. Medical Image Analysis, 5(2):143-156, 2001.
6. M. Jenkinson, P.R. Bannister, J.M. Brady, and S.M. Smith. Improved optimisation for the robust and accurate linear registration and motion correction of brain images. NeuroImage, 17(2):825-841, 2002.
7. Schmidt P. PhD thesis, Ludwig-Maximilians-Universität München; 2017. Chapter 6.1: Bayesion inference for structured additive regression models for large-scale problems with applications to medical imaging.
8. Kant IMJ, de Bresser J, van Montfort SJT, Aarts E, Verlaan JJ, Zacharias N, Winterer G, Spies C, Slooter AJC, Hendrikse J; BioCog Consortium. The association between brain volume, cortical brain infarcts, and physical frailty. Neurobiol Aging. 2018 Oct;70:247-253.
9. Ainiala H, Dastidar P, Loukkola J, Lehtimäki T, Korpela M, Peltola J, Hietaharju A. Cerebral MRI abnormalities and their association with neuropsychiatric manifestations in SLE: a population-based study. Scand J Rheumatol. 2005 Sep-Oct;34(5):376-82.
10. Kozora E, Filley CM. Cognitive dysfunction and white matter abnormalities in systemic lupus erythematosus. J Int Neuropsychol Soc. 2011 May;17(3):385-92
11. Bao L, Cunningham PN, Quigg RJ. Complement in Lupus Nephritis: New Perspectives. Kidney Dis (Basel). 2015 Sep;1(2):91-9.
12. Tamires Lapa A, Postal M, Angélica Sinicato N, Geraldo Ferreira W, Siqueira Bellini B, Teixeira Fernandes P, Rittner L, Marini R, Cendes F, Appenzeller S. Reduction of Cerebral and Corpus Callosum Volumes in Childhood-Onset Systemic Lupus Erythematosus: A Volumetric Magnetic Resonance Imaging Analysis. Arthritis Rheumatol. 2016 Sep;68(9):2193-9.
13. Thambisetty M, Simmons A, Hye A, Campbell J, Westman E, Zhang Y, Wahlund LO, Kinsey A, Causevic M, Killick R, Kloszewska I, Mecocci P, Soininen H, Tsolaki M, Vellas B, Spenger C, Lovestone S; AddNeuroMed Consortium. Plasma biomarkers of brain atrophy in Alzheimer's disease. PLoS One. 2011;6(12):e28527.
Figures
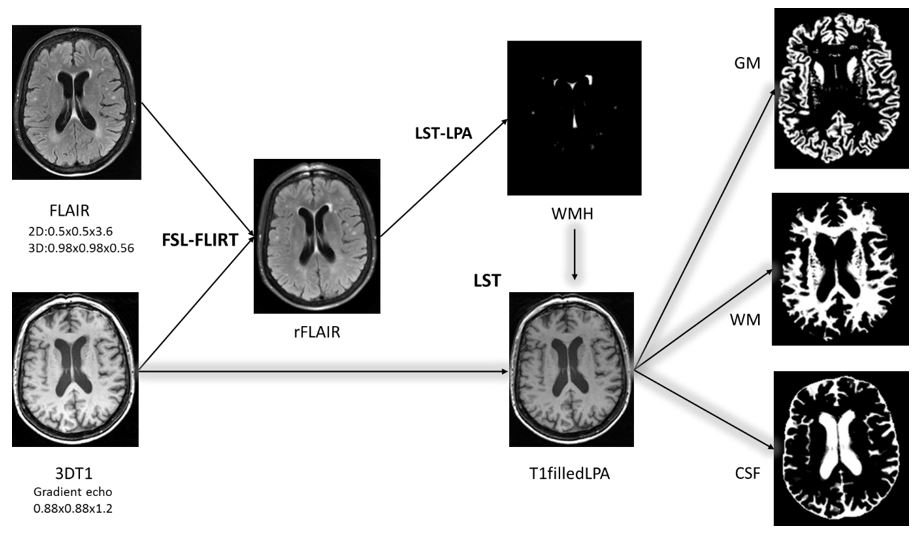
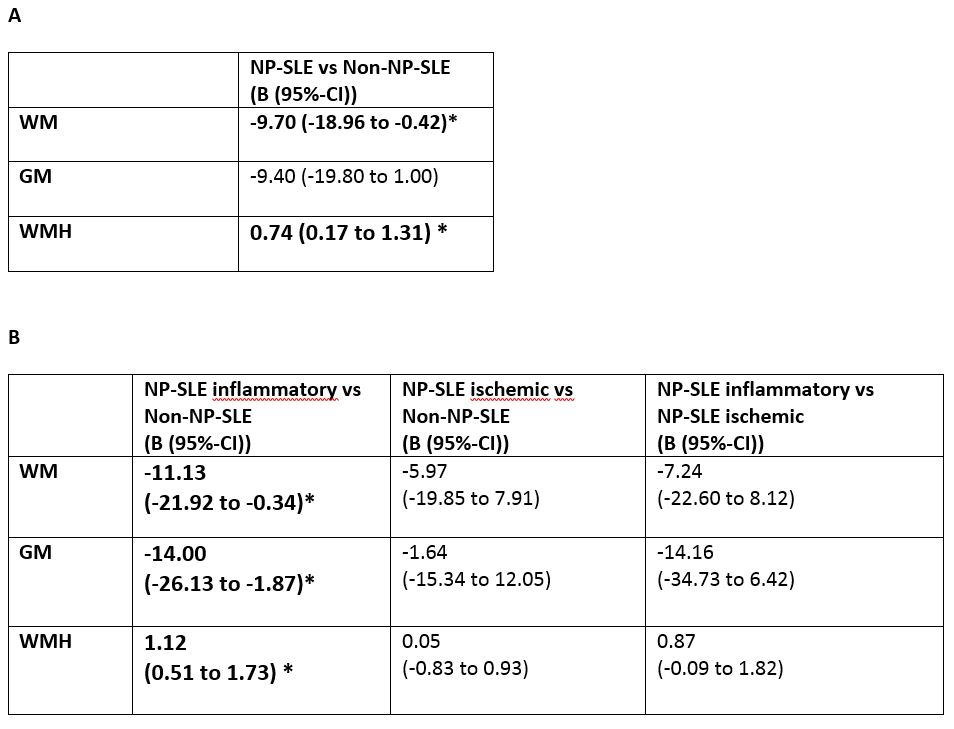
Figure 2A. Linear regression analysis on brain and WMH volumes in NP-SLE patients vs non-NP-SLE patients. Measurements reported are linear regression B values and confidence’s interval. WM volume was lower and WMH volumes were higher in patients with NP-SLE compared to patients with non-NP-SLE.
Figure 2B. Linear regression analysis on brain and WMH volumes compared between all the groups. WM and GM was lower and WMH were higher only for NP-SLE inflammatory patients compared to the non-NP-SLE patients.
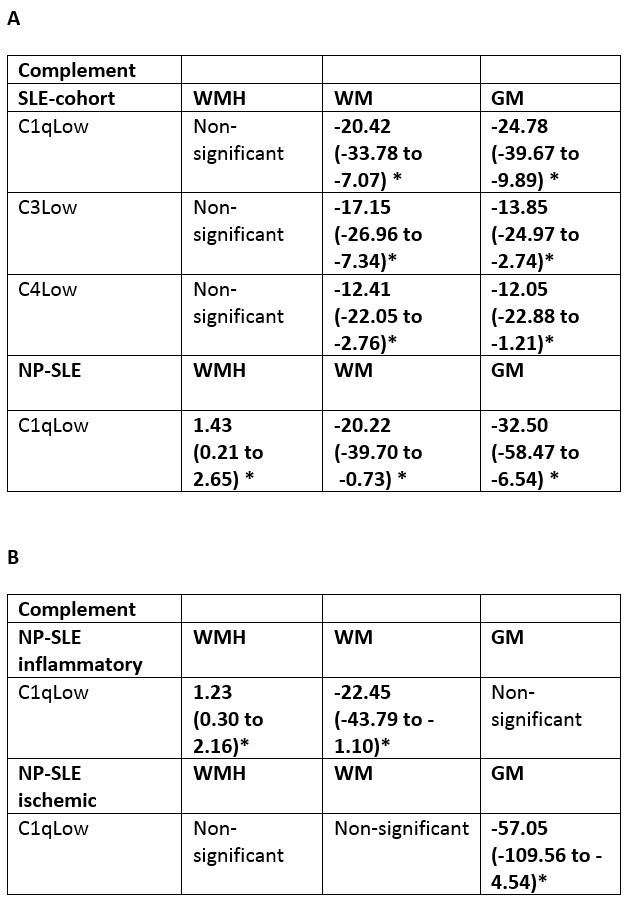
Table 1A.Linear regression analysis in the entire SLE-cohort and in NP-SLE patients on complement components related to brain and WMH volumes. Within the entire SLE-cohort, all the complement components were found to be significant in all brain volumes. In NP-SLE patients only c1qLow was found to be significantly correlated to brain and WMH volumes.
Table 1B.Linear regression analysis in the NP-SLE inflammatory and ischemic patients on complement components related to brain and lesion volumes. In NP-SLE inflammatory phenotype C1qLow associated with lower WM volume and higher WMH volume. In NP-SLE ischemic phenotype C1qLow associated with a lower GM volume.