2601
Investigating premanifest synucleinopathy: structural connectome of brainstem nuclei in REM sleep behavior disorder1Radiology, Athinoula A. Martinos Center for Biomedical Imaging, Massachusetts General Hospital, Boston, MA, United States, 2Harvard Medical School, Boston, MA, United States, 3Neurology, Massachusetts General Hospital, Boston, MA, United States
Synopsis
REM-sleep-behavior-disorder (RBD) is characterized by the absence of muscle-atonia during REM-sleep. RBD is strongly associated with presymptomatic-manifestations of neurodegenerative-synucleinopathies. Thus, it allows the investigation of early/premanifest neurodegenerative-stages when treatment can be most effective in delaying the development of full-blown-disease. Changes in brainstem-nuclei-connectivity are expected in RBD/premanifest-synucleinopathy based on animal- and ex-vivo-human-studies. Yet, their investigation in living-humans is understudied. Through high-spatial-resolution 7Tesla-MRI and a recently-developed probabilistic-brainstem-nuclei-atlas, we built a brainstem-based structural-connectome in living RBD-patients and age-matched controls. Interestingly, in RBD-patients we detected structural-connectivity-changes within the brainstem, with the striatum and cerebellum in line with the pathophysiology of RBD in animal-models.
Introduction
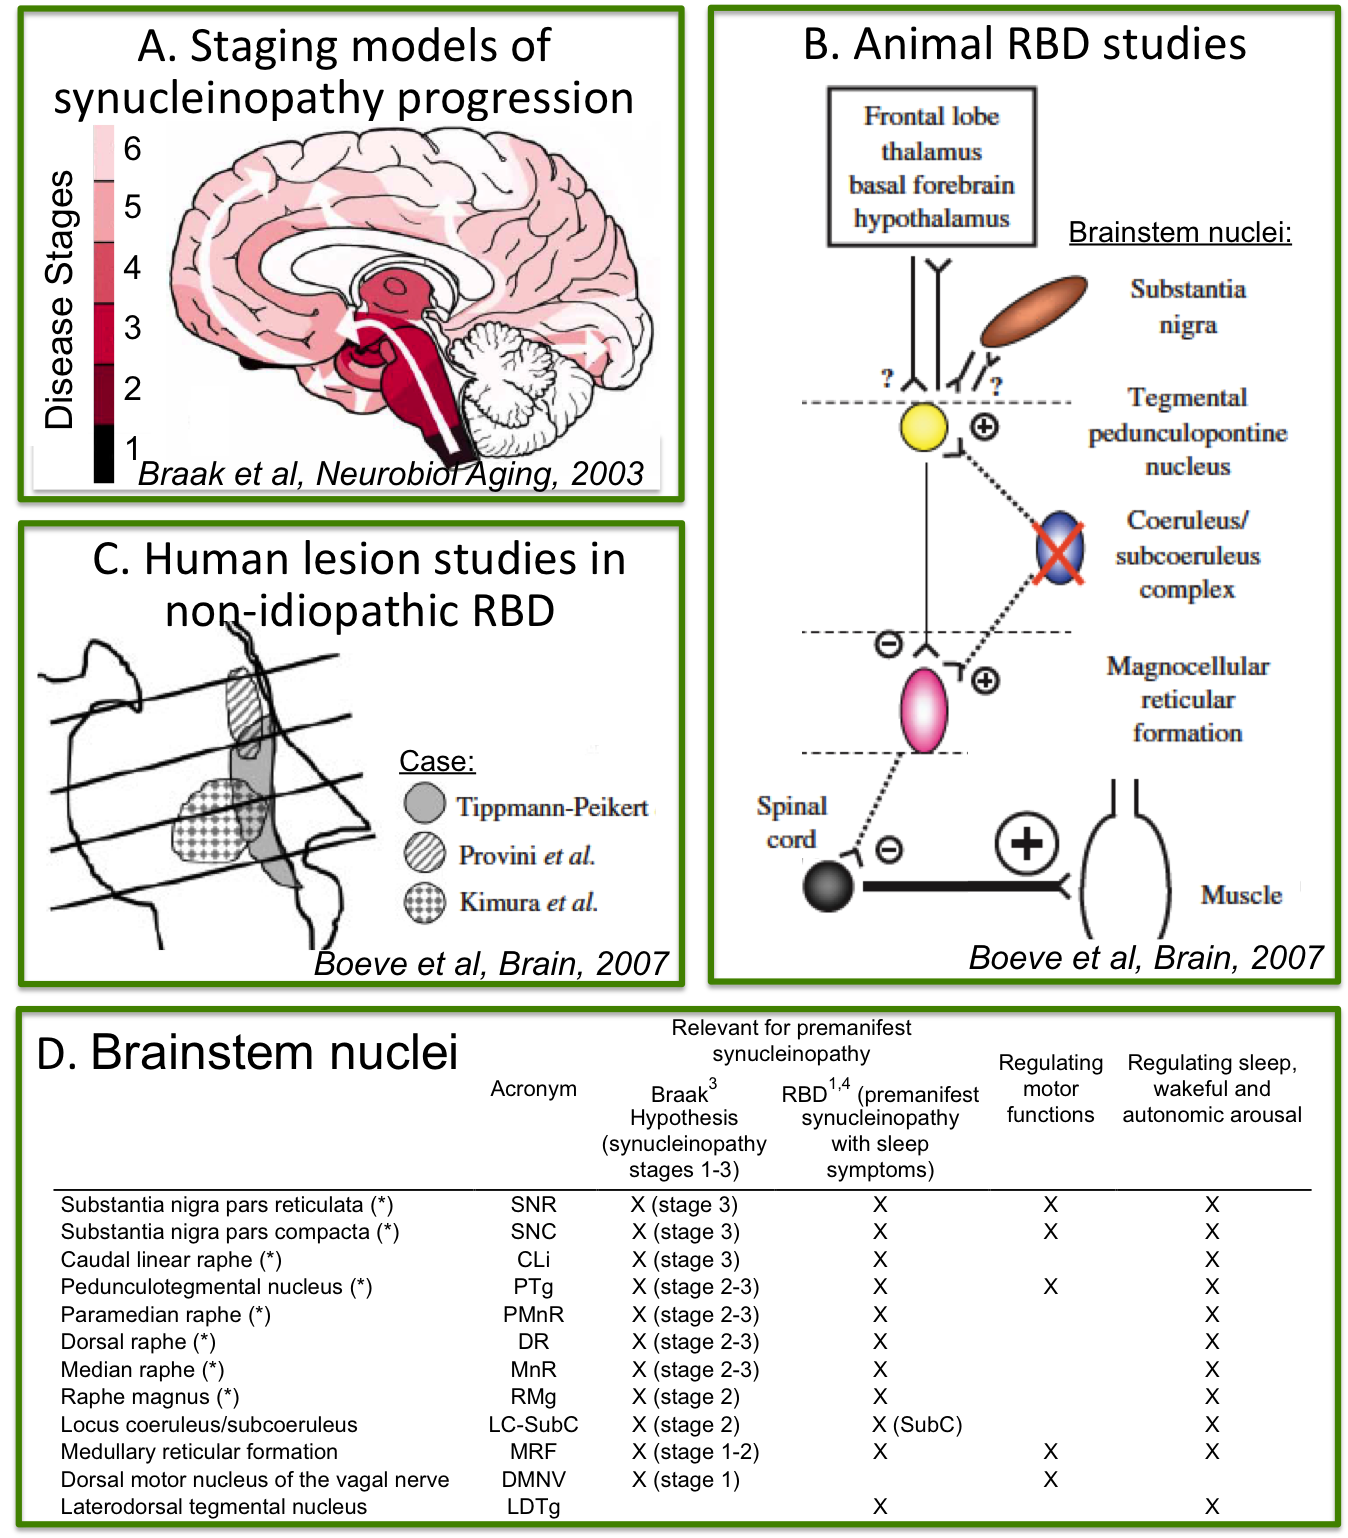
Rapid-eye-movement (REM) sleep behavior disorder (RBD) is a sleep disorder characterized by the absence of muscular atonia during REM sleep. RBD patients have up to a 90% risk of developing a neurodegenerative synucleinopathy (including Parkinson’s disease, multiple system atrophy and dementia with Lewy bodies) after 14 years from RBD-diagnosis [1]. Thus RBD allows the investigation of early, premanifest neurodegenerative stages when treatment can be most effective in delaying the development of full-blown disease [2]. Changes in the microstructure and connectivity of brainstem nuclei are expected in RBD/premanifest-synucleinopathy based on (Figure 1A-C): (i) ex-vivo human staging models of synucleinopathy progression [3]; (ii) in-vivo human lesion studies of non-idiopathic-RBD [4]; (iii) animal studies of idiopathic-RBD [4]. Nevertheless, these brainstem changes underlying RBD/premanifest-synucleinopathy are currently understudied in living humans.Purpose
To investigate the presence of structural connectivity changes of brainstem nuclei in RBD by the use of high spatial-resolution diffusion-tensor-imaging (DTI) at 7 Tesla as well as a recently developed probabilistic structural atlas of brainstem nuclei of the arousal and motor systems in Montreal-Neurological-Institute (MNI) space [5-6].
Methods
Data acquisition: Five patients with idiopathic-RBD (age 69.6 ± 1.12) and two healthy subjects (age 64.5 ± 1.5) underwent 3 Tesla and 7 Tesla-MRI under IRB-approval. 7 Tesla spin-echo DTI: with parameters n. slices/diffusion-weighting gradients/echo-time/repetition-time/phase-encoding direction/bandwith/partial-Fourier/n. diffusion-directions/b-value: 82/unipolar/66.8 ms/7.4 s/“anterior/posterior”/“1456 Hz/pixel”/“6/8”/60/2500 s/mm2, seven interspersed “b0” images (T2-weighted, non-diffusion weighted, b-value = 0 s/mm2), acquisition-time: 8′53′′. To perform distortion-correction we also acquired seven “b0” images with opposite phase-encoding direction. To aid coregistration of DTI to MNI space, a 3 Tesla T1-weighted MEMPRAGE MRI was acquired with repetition-time/echo-times/inversions-time/flip-angle/field-of-view/matrix/bandwidth/GRAPPA-factor/acquisition-time: 2.51 s/[1.6, 3.5, 5.3, 7.2] ms/1.5 s/7°/256×256×176 mm3/256×256×176/“651 Hz/pixel”/2/6′34′′.
Data analysis: a) Preprocessing: We computed the root-mean-square MEMPRAGE image across echo-times, rotated it to standard-orientation (“RPI”), cropped the most inferior slices containing the spinal-cord (in order to aid its coregistration to MNI-space) and bias-field corrected it (SPM8); we then parcellated the resulting image with Freesurfer (7). DTIs were rotated to standard-orientation, de-noised (8), motion and distortion-corrected (FSL, topup/eddy). We then computed the diffusion tensor, tensor-invariants (e.g. fractional anisotropy, FA) and S0 (T2-weighted) image from the preprocessed DTI (FSL, dtifit). To map the Freesurfer parcellation to native DTI-space, we computed an affine boundary-based transformation (FSL, FLIRT-BBR) between the preprocessed MEMPRAGE image and single-subject S0 images. To map the brainstem nuclei atlas to native DTI-space, we computed the bivariate high-dimensional diffeomorphic transformations (ANTs) between IIT-MNI FA/S0 templates (9) and single-subject FA/S0 images. b) Definition of seed and target regions for DTI-based connectivity analysis: As seed regions, we used the structural probabilistic atlas labels [5-6] of eight brainstem nuclei relevant for premanifest synucleinopathy (Figure 1D) mapped from IIT-MNI-space to native-space (using the coregistration transformations explained above). As target regions, we used the probabilistic atlas labels of 16 brainstem nuclei of [5-6], as well as the 82 cortical/subcortical bilateral regions obtained in each subject from the MEMPRAGE Freesurfer-parcellation (mapped to native space as explained above). c) Single-subject DTI-based connectivity analysis: We performed deterministic tractography using MRtrix3. We propagated 10,000 streamlines from each seed-mask, and computed a “structural-connectivity-index” (range: [0 1]) for each pair of seed-target masks (= fraction of streamlines propagated from the seed reaching the target mask). d) Group DTI-based connectivity analysis: We averaged across subjects the structural-connectivity-index of brainstem nuclei with target-regions to yield a group structural connectome of these nuclei. We displayed this connectome using a 2D circular diagram [10]. e) As a validation of the DTI-based connectome obtained in controls, we derived a prediction model of expected structural-connectivity pathways of these nuclei based on animal literature [11-12].
Results
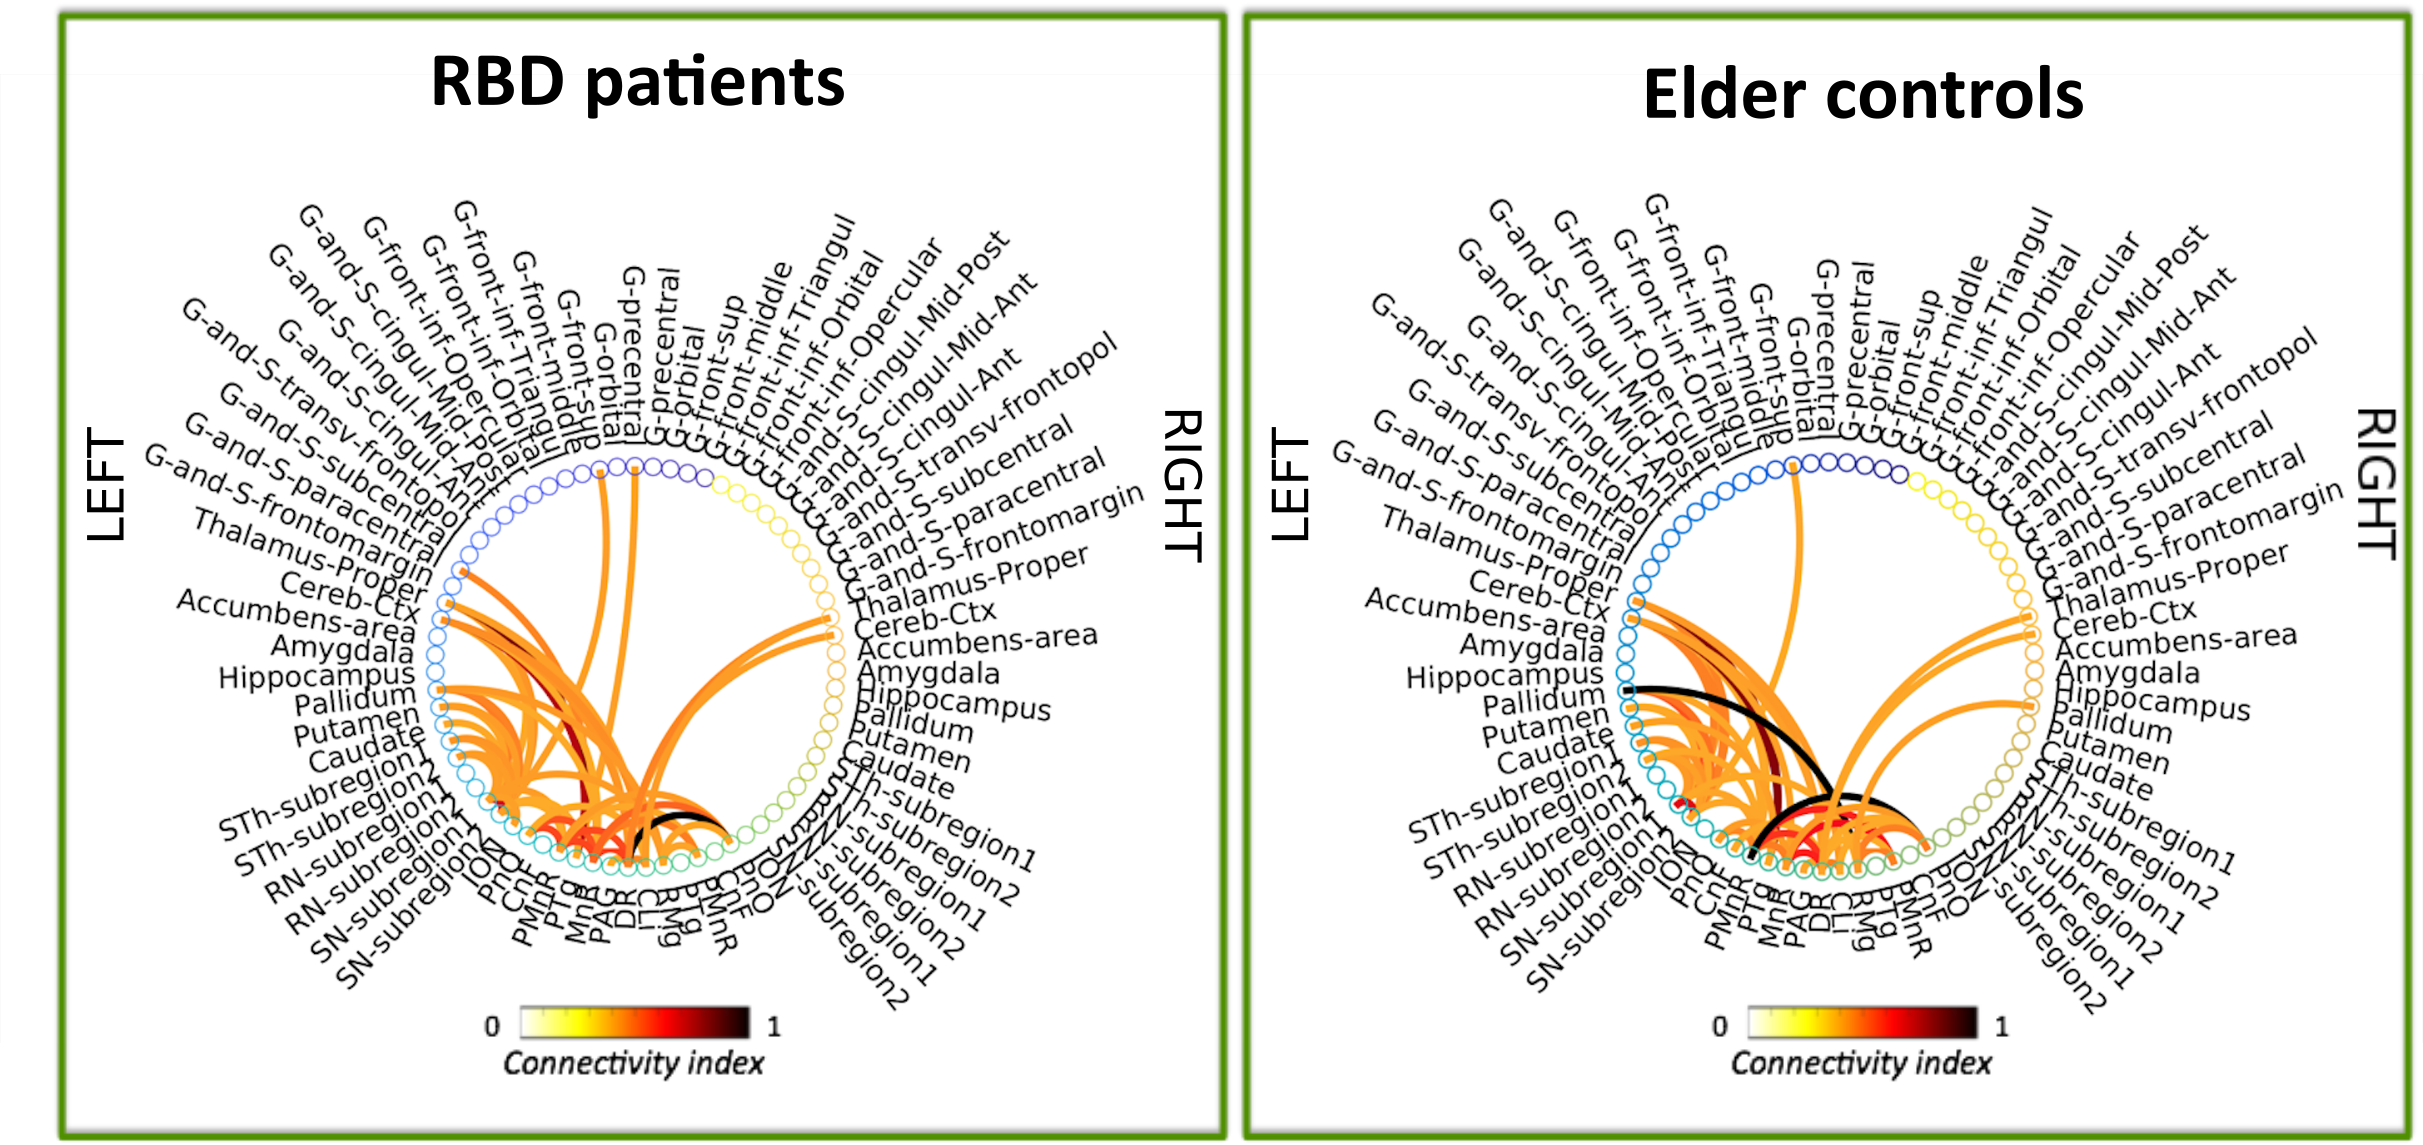
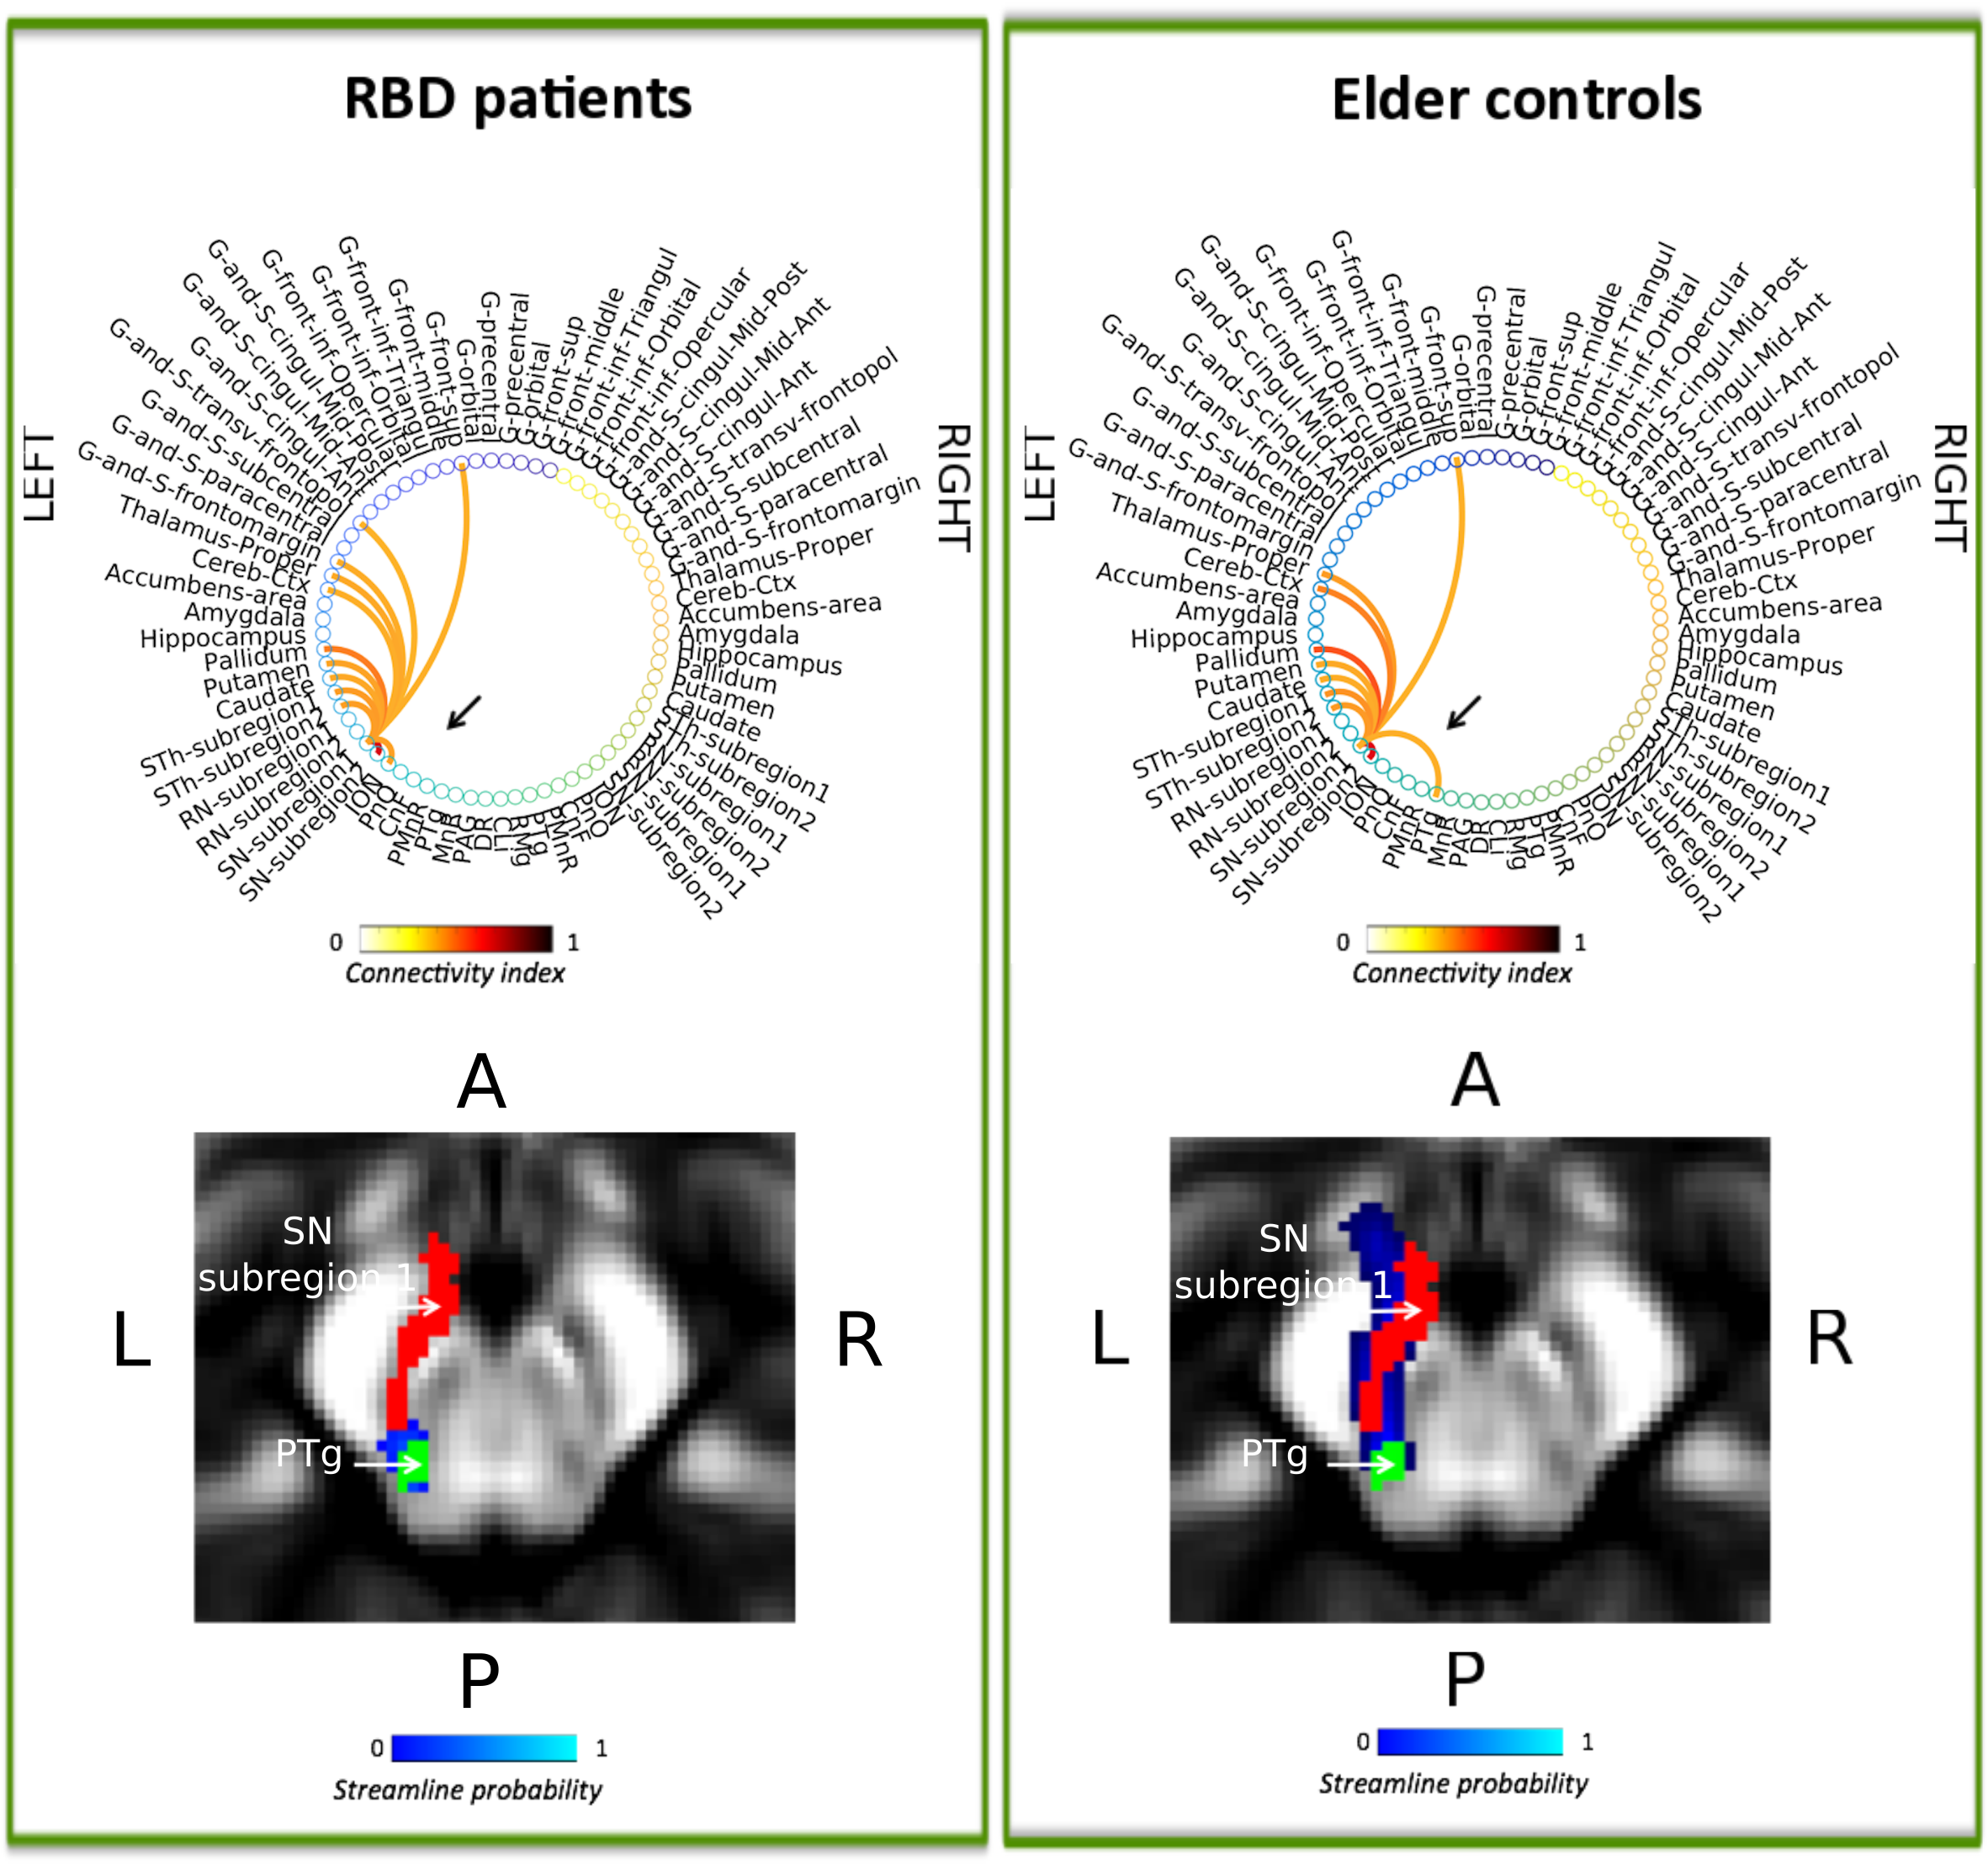
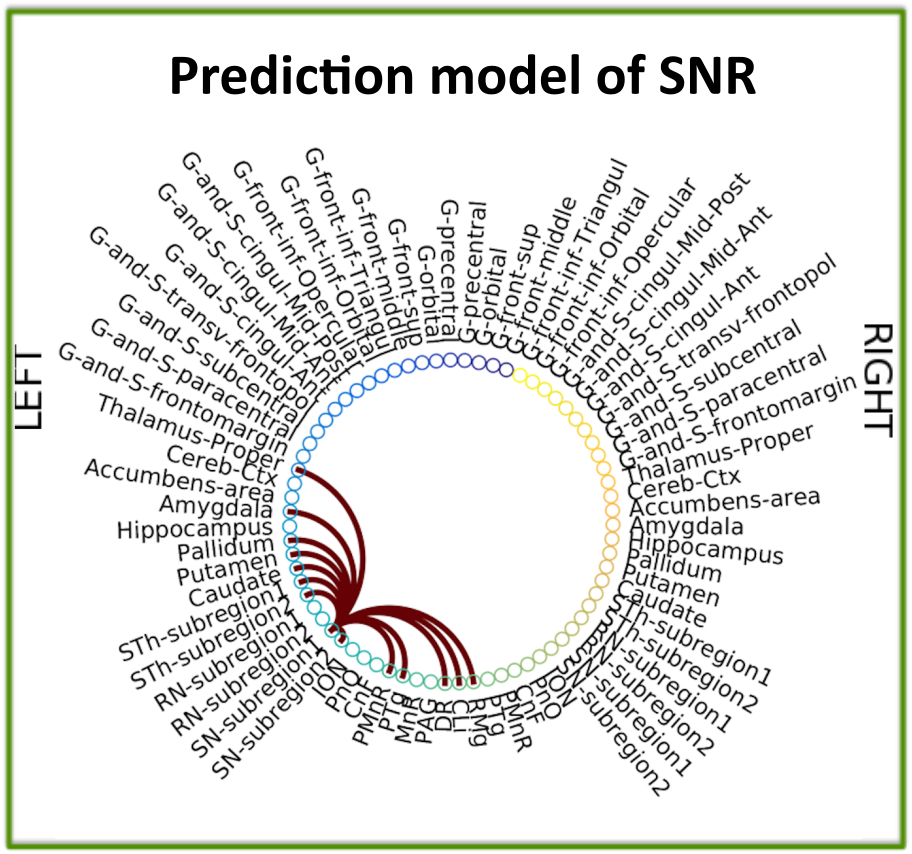
The structural connectome of eight brainstem nuclei demonstrated an overall decreased connectivity within the brainstem and with the striatum in RBD compared to controls (Figure 2). Interestingly, the substantia nigra (SN) subregion 1 (compatible with pars-reticulata, SNR) showed decreased connectivity with the pedunculotegmental nucleus (PTg) in RBD compared to controls (see Figure 3). The prediction connectivity model of SNR is shown in Figure 4.Discussion
The observed decreased connectivity of the SN-subregion1 with the PTg in RBD patients (premanifest-synucleinopathy), is in line with animal RBD-studies [3] (Figure 1B) and with models of synucleinopathy progression [4] (Figure 1A). Interestingly, the observed decrease in connectivity of the SN-subregion1 with the striatum and cerebellum is also observed in manifest-synucleinopathy [13]. The prediction model of the SNR connectivity showed that the connectivity observed in controls is in line with animal work [11-12].Conclusions
The structural connectome of brainstem pathways in living humans is a promising tool to better understand and assess premanifest synucleinopathy stages.Acknowledgements
MGH-Claflin-Distinguished-Scholar; NIH-NIBIB-K01EB019474; NIH-NIBIB-P41EB015896.References
1. Postuma RB. Prodromal Parkinson’s disease – using REM sleep behavior disorder as a window. Parkinsonism Relat Disord. 2014; Suppl1: S1-4.
2. Postuma RB, Berg D. Advances in markers of prodromal Parkinson disease. Nature Reviews, Neurology. 2016; 12: 622-634.
3. Braak H, Del Tredici K, Rub U, et al., Staging of brain pathology related to sporadic Parkinson’s disease. Neurobiol Aging. 2003; 24: 197-211.
4. Boeve BF, Silber MH, Saper CB, et al., Pathophysiology of REM sleep behavior disorder and relevance to neurodegenerative disease. Brain. 2007; 130: 2770-2788.
5. Bianciardi M, Toschi N, Edlow BE, et al., Toward an in vivo neuroimaging template of human brainstem nuclei of the ascending arousal, autonomic, and motor systems. Brain Connect. 2015; 5: 597-607.
6. Bianciardi M, Strong C, Toschi N, et al., A probabilistic template of human mesopontine tegmental nuclei from in vivo 7T MRI. Neuroimage. 2018; 170: 222-230.
7. Desikan RS, Segonne F, Fischl B, et al. An automated labeling system for subdividing the human cerebral cortex on MRI scans into gyral based regions of interest. Neuroimage. 2006; 31: 968-980.
8. Manjon JV, Coupé P, Concha L, et al., Diffusion Weighted Image Denoising Using Overcomplete Local PCA. PLoS ONE. 2013; 8(9): e73021.
9. Varentsova A, Zhang S, Arfanakis K., Development of a high angular resolution diffusion imaging human brain template. Neuroimage. 2014; 91: 177-186.
10. Irimia A, Chambers MC, Torgerson CM, et al., Circular representation of human cortical networks for subject and population-level connectomic visualization. Neuroimage. 2012; 60: 1340-1351.
11. Olszewski J, Baxter D, Karger S. Cytoarchitecture of the Human Brainstem. JB Lippincott Company, Philadelphia and Montreal North America. 1954.
12. Mai J, Paxinos G. The human nervous system. 3rd Edition. Academic Press, London, UK, 2012.
13. Menke RA, Scholz J, Miller KL, et al., MRI characteristics of the substantia nigra in Parkinson's disease: a combined quantitative T1 and DTI study. Neuroimage. 2009; 47: 435-441.
Figures