2598
Altered Claustral Functional Connectivity in Parkinson’s Disease Patients with Mild Cognitive Impairment.1Cleveland Clinic Lou Ruvo Center for Brain Health, Las Vegas, NV, United States, 2University of California, San Diego, San Diego, CA, United States, 3Stanford University, Stanford, CA, United States
Synopsis
Studies have shown α-synuclein pathology in the claustrum of Parkinson’s disease (PD) patients and its correlation with the onset of cognitive dysfunction in PD. In this study we use resting state fMRI to examine claustral functional connectivity network changes in PD patients with mild cognitive impairment. Our results show increased claustral-cortical connectivity in the PD-MCI group, which may indicate additional effort is required in the PD-MCI group to maintain network integration. The increased load of claustrum is somewhat mitigated by medication in PD patients with cognitive impairment.
Introduction
The claustrum is a thin layer of subcortical gray matter (GM) which is extensively connected to cortical and subcortical regions and plays an important role in integrating multimodal sensory-motor information 1. Previous studies have found α-synuclein pathology in the claustrum of PD patients 2. Studies have also shown that claustrum connectivity is altered in patients with mild cognitive impairement (MCI)3. Therefore, our aim is to study claustral functional connectivity network changes in PD patients with MCI using rs-fMRI, to determine if altered connectivity is found in PD-MCI and also study the effects of medication on claustrum connectivity. Ultimately, a better understanding of claustrum connectivity will help derive a comprehensive picture of the role of claustrum and whether it may contribute to cognitive decline in PD.Methods
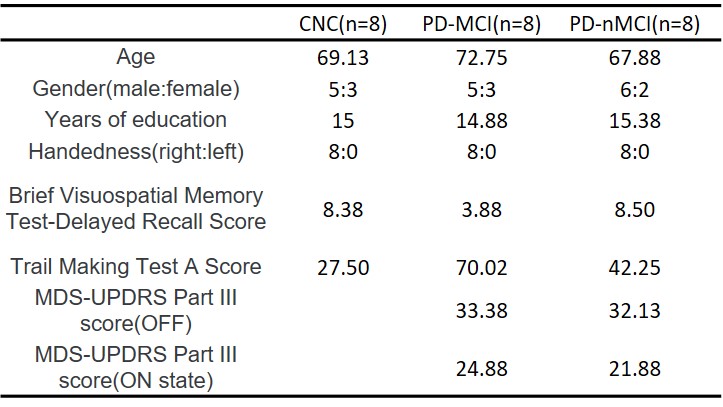
We recruited 30 normal controls (CNC) and 32 PD participants at our Center for Neurodegeneration and Translational Neuroscience. Based on clinical assessment, 16 participants were identified as PD-MCI. Since the cognitive profile in PD-MCI is heterogeneous, in this study, we only focused on cognitive impairment in PD-MCI with features of cortical and frontal-striatal impairments. Therefore among the 16 PD-MCI participants only those who had deficit in both Trail Making Test A (TMT-A) and Brief Visual Memory Test-Delayed Recall (BVMT) were included in the current study. This criteria yielded 8 PD-MCI, 8 cognitively normal PD (PD-nMCI) and 8 CNC subjects. (see Table 1 for demographics). Rs-fMRI were acquired on a 3T MRI scanner for all participants. PD-MCI and PD-nMCI patients were scanned during both levodopa OFF and ON states. After standard preprocessing, mean time series were obtained from right and left claustrum based on previous work from Mallikarjun et. al. 4. Spherical ROIs were created using MARSBAR5 with a radius of 3 mm (see Figure 1 for location). Pearson’s correlation coefficients between the time series of the seed region with all the other voxels of the rest of the brain were then calculated for both the ROIs. The FC maps were obtained for all the CNC participants and PD (OFF and ON states) participants. Nonparametric statistical analyses of group differences (PD-nMCI vs PD-MCI (ON and OFF states) and PD groups (ON and OFF states) vs CNC) between the obtained FC maps was then conducted using the permutation analysis of linear models (PALM) toolbox in FSL6. Significance was established at a family-wise error correction of pcorr<0.05.Results
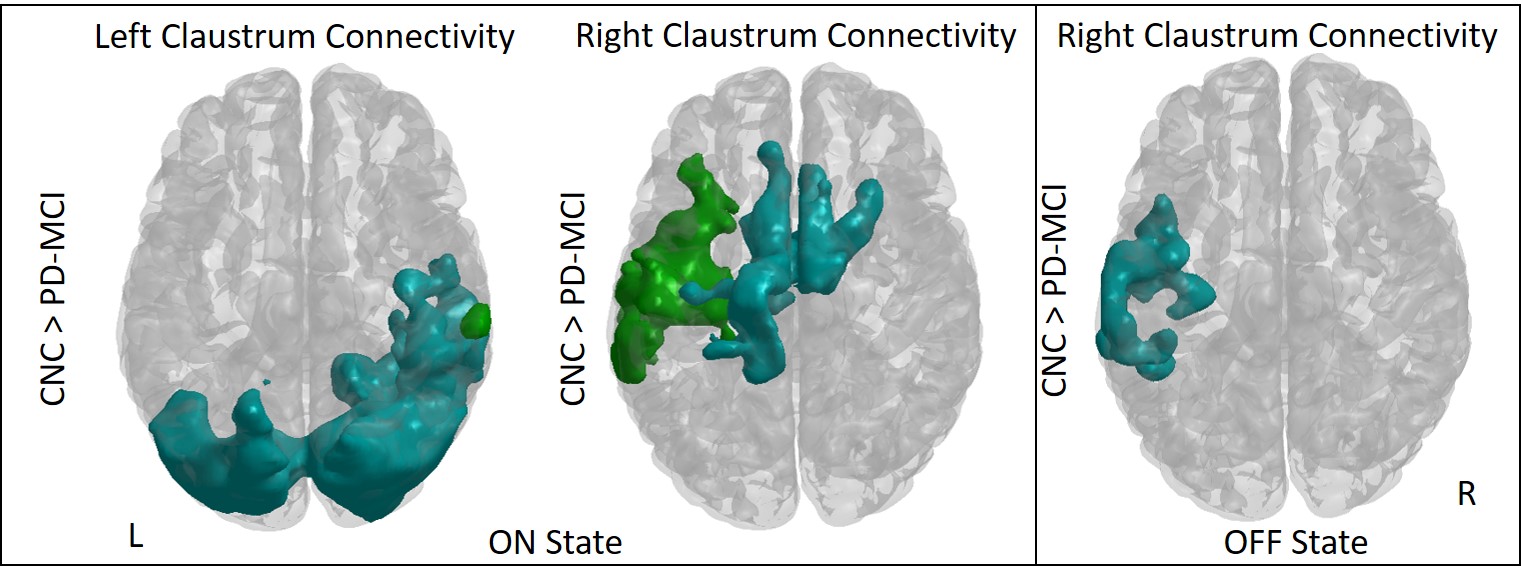
Figure 2 shows significant connectivity differences in between the two PD groups (On and OFF states); and figure 3 shows the differences between CNC and PD (ON and OFF states). Results were visualized with the BrainNet Viewer (http://www.nitrc.org/projects/bnv/) 7. (a)PD-MCI vs PD-nMCI comparisons: In the ON state we found that the PD-nMCI group showed stronger right claustrum connectivity in a cluster including parts of the postcentral gyrus, precentral gyrus, superior temporal gyrus and insula (Fig.2). No significant differences were found in the OFF state. (b)CNC vs PD group comparison: In the ON state we found that PD-MCI group showed weaker left claustrum connectivity connections in two different clusters when compared to CNC. The first cluster consisted of mainly temporal and occipital regions and the peak of the second cluster was located around the supramarginal gyrus (Fig.4 left panel). The PD-MCI group also showed weaker right claustrum connectivity in two clusters. First cluster consisted of parts of the posterior middle frontal, anterior cingulate cortex, and middle cingulate cortex regions. The second cluster included parts of the middle temporal gyrus, putamen and insula regions (Fig.3 left panel). In the OFF state we found that the PD-MCI group had lower claustrum connectivity in the cluster including parts of the middle temporal gyrus, superior temporal gyrus and the insula (Fig.3 right panel). No significant differences were found between the CNC and PD-nMCI groups.Discussion and Conclusion
When compared to CNC, only the PD-MCI groups showed reduced connectivity in the ON state but not in the OFF state. These results are similar to the functional connectivity study by Marco et. al.3, which found increased claustrum connectivity in a group of MCI ApoE ε4 allele carriers suggesting additional effort was required to maintain network integration. Similarly, in our group of PD-MCI patients the claustrum connectivity in the OFF state which may be due to the additional effort required in the PD-MCI group to maintain network integration. In addition we also see that the increased connectivity of the claustrum is somewhat mitigated by medication in PD-MCI. Future studies with larger sample size of patients could help us identify neural correlates between claustral-cortical connectivity and cognitive decline in PD, and would be a useful imaging biomarker.Acknowledgements
This work was supported by an Institutional Development Award (IDeA) from the National Institute of General Medical Sciences of the National Institutes of Health under grant number 5P20GM109025, and private grant funds from Peter and Angela Dal Pezzo.References
1) Dillingham, M. C., Jankowski, M.M., et. al. (2017). The claustrum: Considerations regarding its anatomy, functions and a programme for research. Brain and Neuroscience Advances Volume 1: 1–9.
2) Kalaitzakis, M. E., Pearce, R. K. B., & Gentleman, S. M. (2009). Clinical correlates of pathology in the claustrum in Parkinson's disease and dementia with Lewy bodies. Neuroscience Letters, 461(1), 12–15. https://doi.org/10.1016/j.neulet.2009.05.083.
3) De Marco, M., Vallelunga, A., et. al. (2015) Functional Connectivity of the Claustrum in Mild Cognitive Impairment and the Impact of the ApoE ε4 Allele. Neurology (14 Supplement) P6.176.
4) Mallikarjun, P.K., Lalousis, P.A. , et. al. (2018). Aberrant salience network functional connectivity in auditory verbal hallucinations: a first episode psychosis sample. Translational Psychiatry 8:69.
5) Matthew Brett, Jean-Luc Anton, Romain Valabregue, Jean-Baptiste Poline. Region of interest analysis using an SPM toolbox [abstract] Presented at the 8th International Conference on Functional Mapping of the Human Brain, June 2-6, 2002, Sendai, Japan. Available on CD-ROM in NeuroImage, Vol 16, No 2.
6) Winkler AM, Ridgway GR, Webster MA, Smith SM, Nichols TE. Permutation inference for the general linear model. Neuroimage 2014; 92: 381–397.
7) Xia M, Wang J, He Y (2013) BrainNet Viewer: A Network Visualization Tool for Human Brain Connectomics. PLoS ONE 8(7): e68910. doi:10.1371/journal.pone.0068910.
Figures