2596
Influence of Analytic Techniques on Comparing Diffusion Derived Measurements in Early Stage Parkinson’s Disease1Imaging Research, Cleveland Clinic Lou Ruvo Center for Brain Health, Las Vegas, NV, United States, 2Barrow Neurological Institute, Phoenix, AZ, United States
Synopsis
Using a well-characterized multi-site diffusion MRI (
Introduction
Scalar metrics derived using the diffusion tensors (DTI) fitted from diffusion-weighted MRI (dMRI) are capable of delineating in vivo microstructural changes of white matter tracts noninvasively. DTI can detect alterations in white matter in early stages of PD1, with the potential to develop into an important biomarker in understanding PD. However, these findings are variable in nature2–5. Evaluation of different analytic techniques frequently employed to understand the DTI-derived change in WM organization in a multisite, well-characterized, early-stage PD cohort should aid the identification of the most robust analytic techniques to be used to investigate white matter (WM) pathology in this disease, an important unmet need in the field. Thus, region of interest (ROI)-based analysis, voxel-based morphometry (VBM) analysis with varying spatial smoothing6, and the two most widely used skeletonwise approaches (tract-based spatial statistics, TBSS7, and tensor-based registration, DTI-TK8) were evaluated in a DTI dataset of early PD and Healthy Controls (HC) from the Parkinson’s Progression Markers Initiative (PPMI)9 cohort.Methods
Subjects: dMRI data from 44 (15 female) healthy controls (HC) (age: 61±10.79 years, years of education (YOE): 15.86±3.17) and 81 (29 female) early PD-subjects (age: 61.35±9.93 years, YOE: 15.44±3.03, total MDS-UPDRS: 18.72±8.13; disease duration: 11.46±13.85 months) were derived from the PPMI database for this study. Imaging parameters are described in detail at http://www.ppmi-info.org/9. Only data from 3T Siemens scanners with the first visit were used to ensure uniformity of diffusion data. Skeletonwise analysis: Tract-based spatial statistics (TBSS) from FSL was used for voxelwise comparisons between HC and PD for various diffusion derived metrics such as fractional anisotropy (FA), axial diffusivity (AxD), radial diffusivity (RD), and mean diffusivity (MD). In addition, tensor-based registration (DTI-TK) was also used for voxelwise comparisons of the same dMRI-derived scalar measures to evaluate the sensitivity of FA-based registration against registering with the full tensor images that incorporate local fiber orientations. ROI analysis: 20 major WM tracts from JHU atlas10 were used as a mask to extract the dMRI-derived measures in those tracts. MD in cortical-subcortical AAL regions11, and substantia nigra11 were also extracted for each participant to investigate whether the ROI-based analysis has more sensitivity to detect differences between HC and PD. Voxelwise analysis: MD maps, at various smoothing levels from 0mm to 20mm, registered using full tensor information (DTI-TK) in MNI152 space for each participant were then further utilized to investigate the commonly used VBM-based approach in comparing MD changes between PD and HC. Statistical analysis: PALM12 in FSL was used to perform nonparametric statistical analyses of skeletonwise, ROI-based, and voxelwise analysis. Statistical analysis was also conducted to investigate the association of disease progression and duration with various diffusivity measures in PD-subjects with skeletonwise, voxelwise, and ROI-based analysis. All statistical analysis was repeated with and without using “site” as a nuisance regressor. All statistical comparisons were considered significant at family-wise error corrected rate of p<0.05.Results
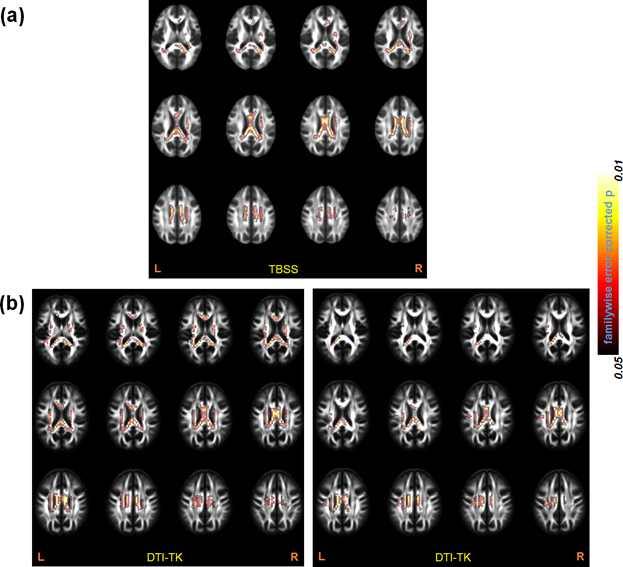
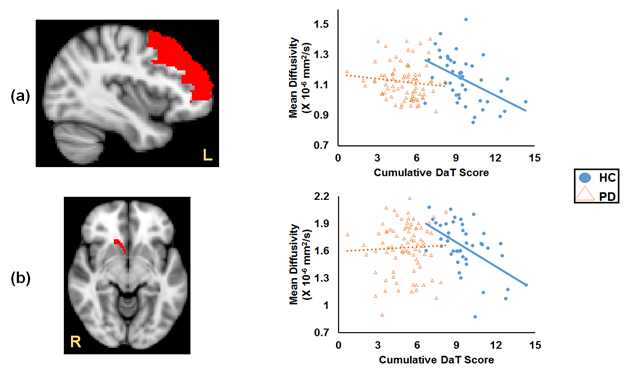
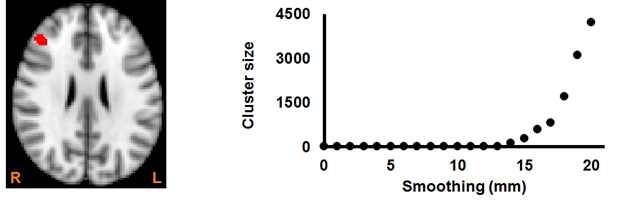
Both TBSS and DTI-TK showed a significant negative relationship of disease duration with FA in the several WM tracts (Fig.1a and left panel of Fig. 1b). In addition, DTI-TK revealed a significantly positive relationship of disease duration with RD in the same regions where FA was found to be negatively associated (right panel of Fig.1b). MD of the left middle frontal gyrus and right caudate showed a significant negative correlation with dopamine transporter (DaT) score in HC (Figs.2a and 2b) with ROI-based analysis. HC showed significantly higher MD in right middle frontal gyrus (left panel of Fig. 3) as compared to PD when smoothing was at least 15mm, and the number of voxels in that cluster continued to increase from 121 voxels to 4201 voxels as smoothing was increased from 15mm to 20mm (right panel of Fig.3). No association of disease duration, symptom severity, or DaT score was observed with MD in PD regardless of smoothing. No differences in the finding were observed when "site" was used or not used as a nuisance regressor.Discussion and Conclusion
While carefully controlling for important confounds with stringent standardized criteria in a well-characterized and publicly available multi-site dMRI database of very early PD, our study suggests: (i) either skeletonwise approach utilizing different registration techniques such as DTI-TK or TBSS could be utilized to understand the association of disease duration and DTI-derived metrics, however DTI-TK should be preferred whenever possible; (ii) although the VBM-based approach revealed MD differences in HC and PD, it should be reported with caution as the amount of spatial smoothing could bias the conclusion; and (iii) care should be taken with ROI-based techniques as no differences in any DTI-derived metrics were found between HC and PD.Acknowledgements
This work was supported by an Institutional Development Award (IDeA) from the National Institute of General Medical Sciences of the National Institutes of Health under grant number 5P20GM109025, and private grant funds from the Elaine P. Wynn and Family Foundation, the Sam and Peggy Grossman Family Foundation, the Samuel P. Mandell Foundation, the Peter and Angela Dal Pezzo funds, and the young scientist award.References
1 Hall JM, Ehgoetz Martens KA, Walton CC, O’Callaghan C, Keller PE, Lewis SJG et al. Diffusion alterations associated with Parkinson’s disease symptomatology: A review of the literature. Parkinsonism Relat Disord 2016. doi:10.1016/j.parkreldis.2016.09.026.
2 Lenfeldt N, Larsson A, Nyberg L, Birgander R, Forsgren L. Fractional anisotropy in the substantia nigra in Parkinson’s disease: a complex picture. Eur J Neurol 2015; 22: 1408–1414.
3 Vaillancourt DE, Spraker MB, Prodoehl J, Abraham I, Corcos DM, Zhou XJ et al. High-resolution diffusion tensor imaging in the substantia nigra of de novo Parkinson disease. Neurology 2009; 72: 1378–1384.
4 Hirata FCC, Sato JR, Vieira G, Lucato LT, Leite CC, Bor-Seng-Shu E et al. Substantia nigra fractional anisotropy is not a diagnostic biomarker of Parkinson’s disease: A diagnostic performance study and meta-analysis. Eur Radiol 2017; 27: 2640–2648.
5 Schwarz ST, Abaei M, Gontu V, Morgan PS, Bajaj N, Auer DP. Diffusion tensor imaging of nigral degeneration in Parkinson’s disease: A region-of-interest and voxel-based study at 3 T and systematic review with meta-analysis. NeuroImage Clin 2013; 3: 481–488.
6 Jones DK, Symms MR, Cercignani M, Howard RJ. The effect of filter size on VBM analyses of DT-MRI data. Neuroimage 2005; 26: 546–554.
7 Smith SM, Jenkinson M, Johansen-Berg H, Rueckert D, Nichols TE, Mackay CE et al. Tract-based spatial statistics: Voxelwise analysis of multi-subject diffusion data. Neuroimage 2006; 31: 1487–1505.
8 Zhang H, Yushkevich PA, Alexander DC, Gee JC. Deformable registration of diffusion tensor MR images with explicit orientation optimization. Med Image Anal 2006; 10: 764–785.
9 The Parkinson Progression Marker Initiative (PPMI). Prog Neurobiol 2011; 95: 629–635.
10 Hua K, Zhang J, Wakana S, Jiang H, Li X, Reich DS et al. Tract probability maps in stereotaxic spaces: analyses of white matter anatomy and tract-specific quantification. Neuroimage 2008; 39: 336–347.
11 Tzourio-Mazoyer N, Landeau B, Papathanassiou D, Crivello F, Etard O, Delcroix N et al. Automated anatomical labeling of activations in SPM using a macroscopic anatomical parcellation of the MNI MRI single-subject brain. Neuroimage 2002; 15: 273–289.
12 Winkler AM, Ridgway GR, Webster MA, Smith SM, Nichols TE. Permutation inference for the general linear model. Neuroimage 2014; 92: 381–397.
Figures