2588
Linked alterations in microstructural morphology of white matter in patients with Parkinson’s disease: A multimodal magnetic resonance imaging study1Department of Radiology, Juntendo University Graduate School of Medicine, Tokyo, Japan, 2Department of Psychiatry, Melbourne Neuropsychiatry Centre, The University of Melbourne & Melbourne Health, Parkville, Australia, 3Department of Radiology, the University of Tokyo, Tokyo, Japan, 4Department of Radiological Sciences, Tokyo Metropolitan University Graduate School of Human Health Sciences, Tokyo, Japan, 5Department of Neurology, Juntendo University Graduate School of Medicine, Tokyo, Japan, 6Juntendo University Graduate School of Medicine, Tokyo, Japan
Synopsis
To identify relationships between Parkinson’s disease (PD) severity and microstructural changes in white matter (WM), we applied a multimodal data-fusion method known as linked independent component analysis (LICA) to a set of diffusion magnetic resonance (MR) and myelin-sensitive imaging data. LICA explained data variance with high sensitivity to PD severity, revealing widespread coordinated decreases in intracellular volume fraction, fractional anisotropy, and myelin volume fraction with increases in radial diffusivity. Our results show coordinated microstructural alterations in WM with disease severity and PD progression.
Introduction
Parkinson's disease (PD) is a multifocal degenerative and progressive disease that presents with various motor and non-motor symptoms.(1) Previous advanced magnetic resonance imaging (MRI) studies using structural and diffusion MRI in PD patients have proven useful in detecting disease-related changes in white matter (WM).(2-6) However, these techniques were investigated separately in previous studies, and few studies show data from integrated multimodal imaging analyses. Because the pathophysiology of PD is multifocal, multimodal whole brain imaging techniques are appropriate for investigations of alterations in WM integrity related to PD pathophysiology. Therefore, we used a multimodal data-fusion method known as linked independent component analysis (LICA)(7) with a set of diffusion MRI and myelin-sensitive imaging data to elucidate relationships between PD severity and microstructural changes in WM.Methods
Participants: We recruited 26 healthy controls (HCs), 25 patients with early PD at Hoehn & Yahr stages 1–2, and 32 with late PD at Hoehn & Yahr stages 3–4.
Image acquisition: All subjects were scanned using a 3T MR scanner (MAGNETOM Prisma, Siemens Healthcare). Scans were performed using multi-shell diffusion MRI with b values of 1,000 and 2,000 s/mm2, and data were acquired along 64 isotropic diffusion gradient directions. MTsat indices were calculated using three-dimensional multi-echo fast low-angle shot sequences with predominant T1-, proton density-, and MT-weighting.
Diffusion MRI and myelin-sensitive imaging: Diffusion-weighted data were fitted to the Neurite orientation dispersion and density imaging (NODDI) model,(8) and the NODDI Matlab Toolbox5 was used to generate maps of intracellular volume fractions (ICVF) and orientation dispersion indices. Diffusion-weighted data were also processed using the Diffusional Kurtosis Estimator(9) to generate maps of mean kurtosis, axial kurtosis, and radial kurtosis. Classic diffusion tensor maps of fractional anisotropy (FA), mean diffusivity, axial diffusivity, and radial diffusivity (RD) were estimated from the diffusion-weighted images based on standard formulas,(10) with b=0 and 1,000 s/mm2. To calculate myelin volume fractions (MVF), MTsat data were analyzed using an in-house MATLAB script as described previously.(11) All diffusion parameters and MVF maps were projected onto mean FA skeletons that were generated using a standard protocol for tract-based spatial statistics.(12)
LICA: Skeletonized parameter maps were included in LICA-driven decompositions using FMRIB’s {3.1 LICA (FLICA, http://fsl.fmrib.ox.ac.uk/fsl/fslwiki/FLICA) to model inter-subject variability across ten metrics (7) (Fig. 1).
Statistical
tests: Diagnostic group differences (HCs, early PDs, and late
PDs) were associated with the LICA components subject loading, age, and sex using
a general linear model with Bonferroni family-wise error rate correction. Associations
were considered significant when p ≤ 0.05.
Result
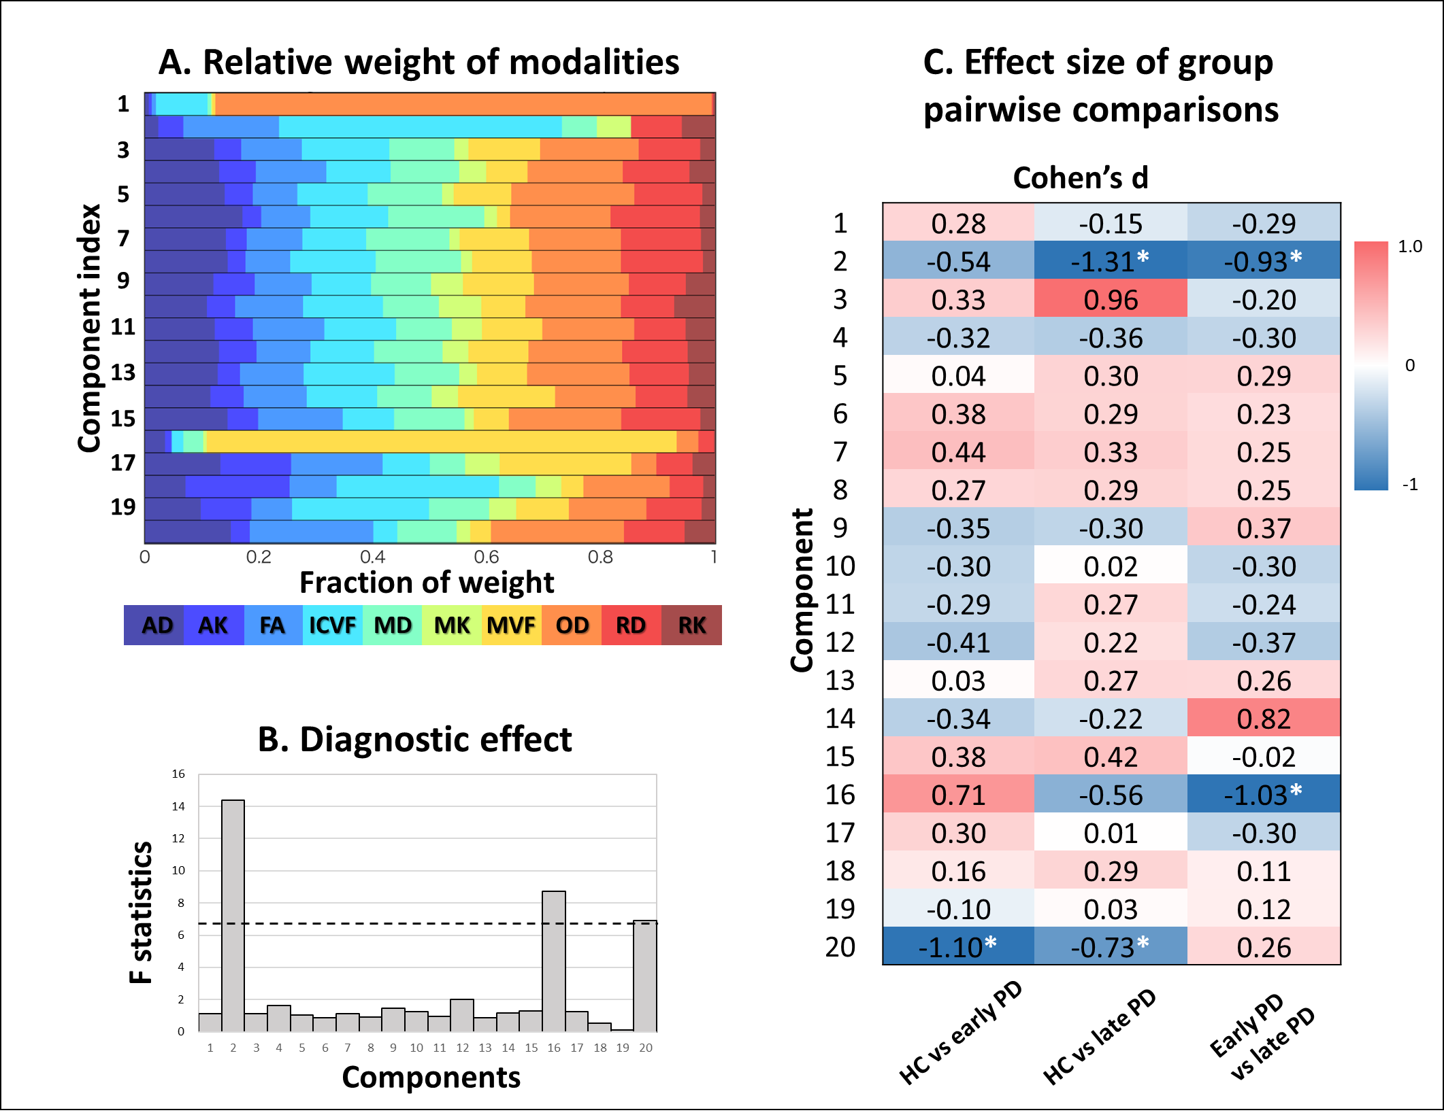
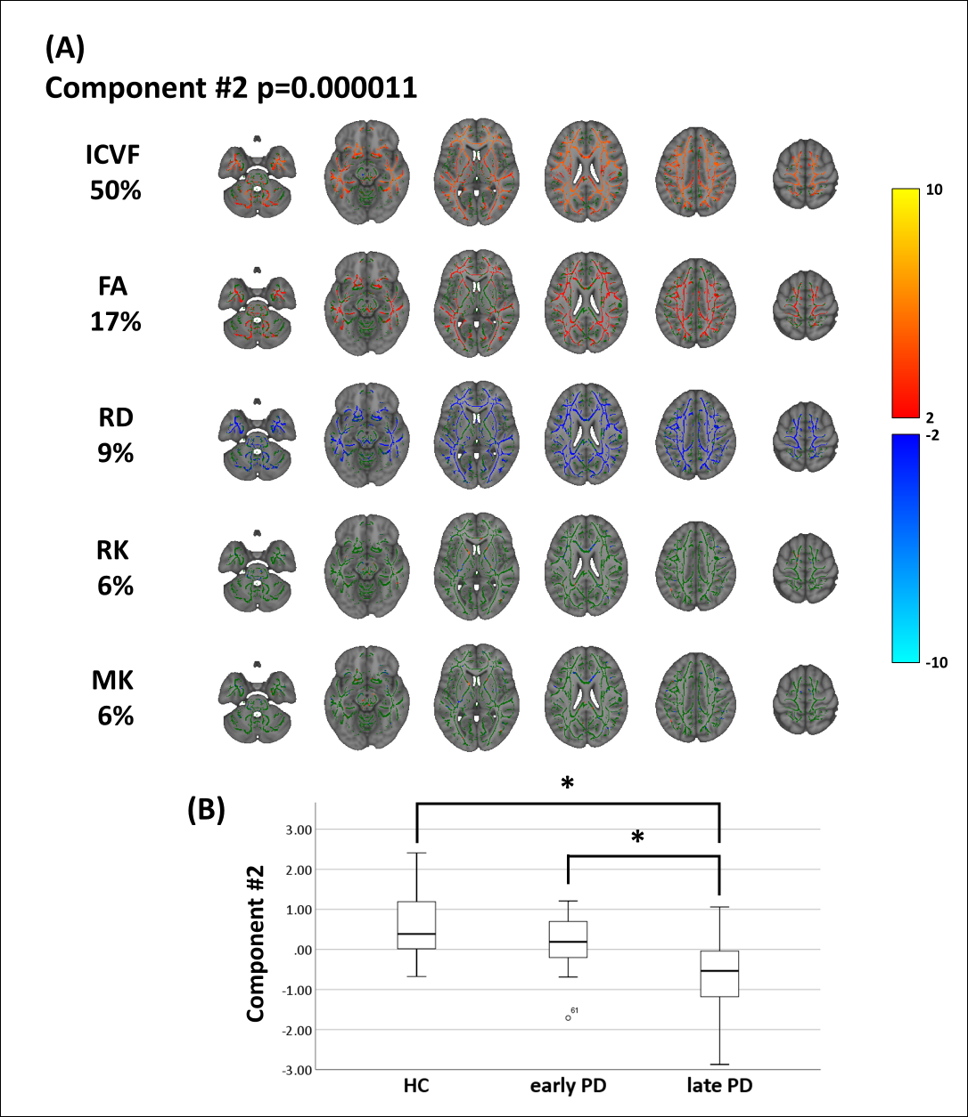
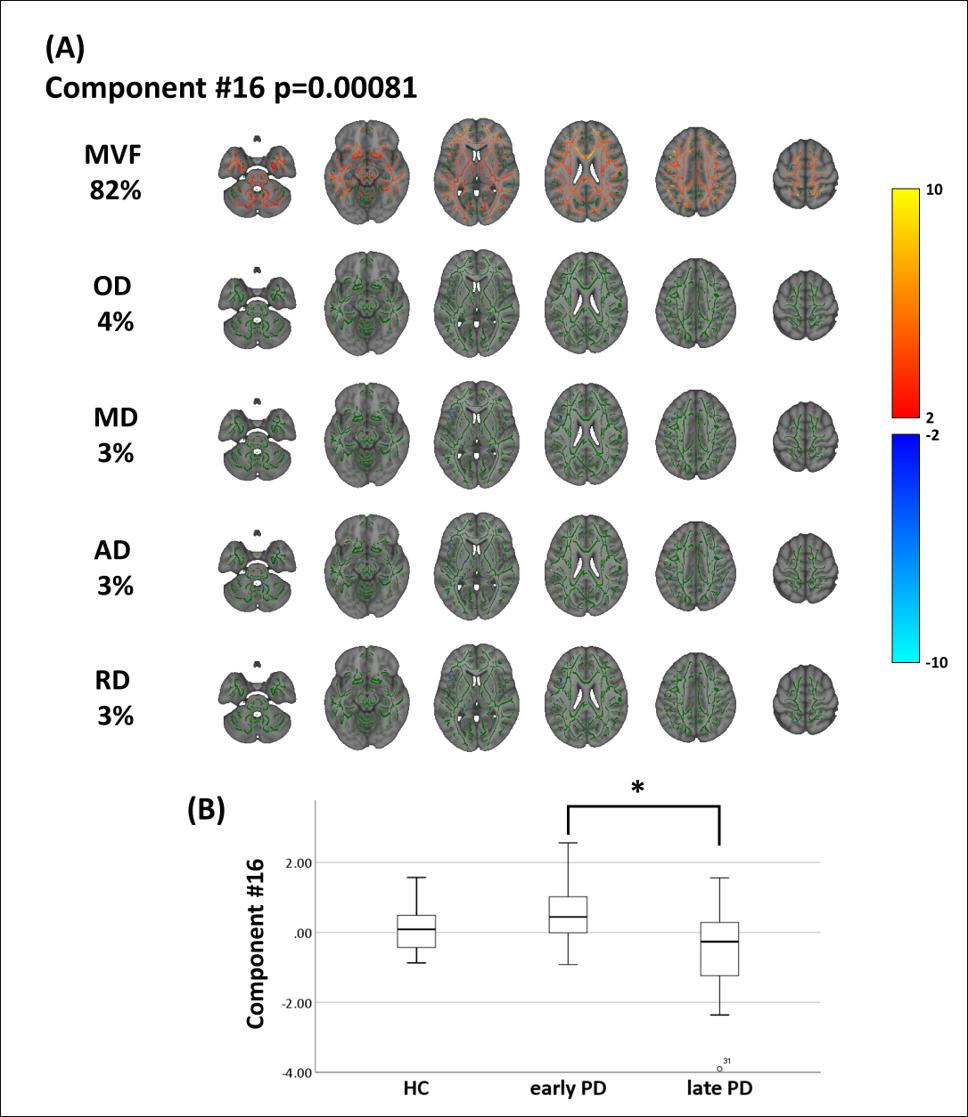
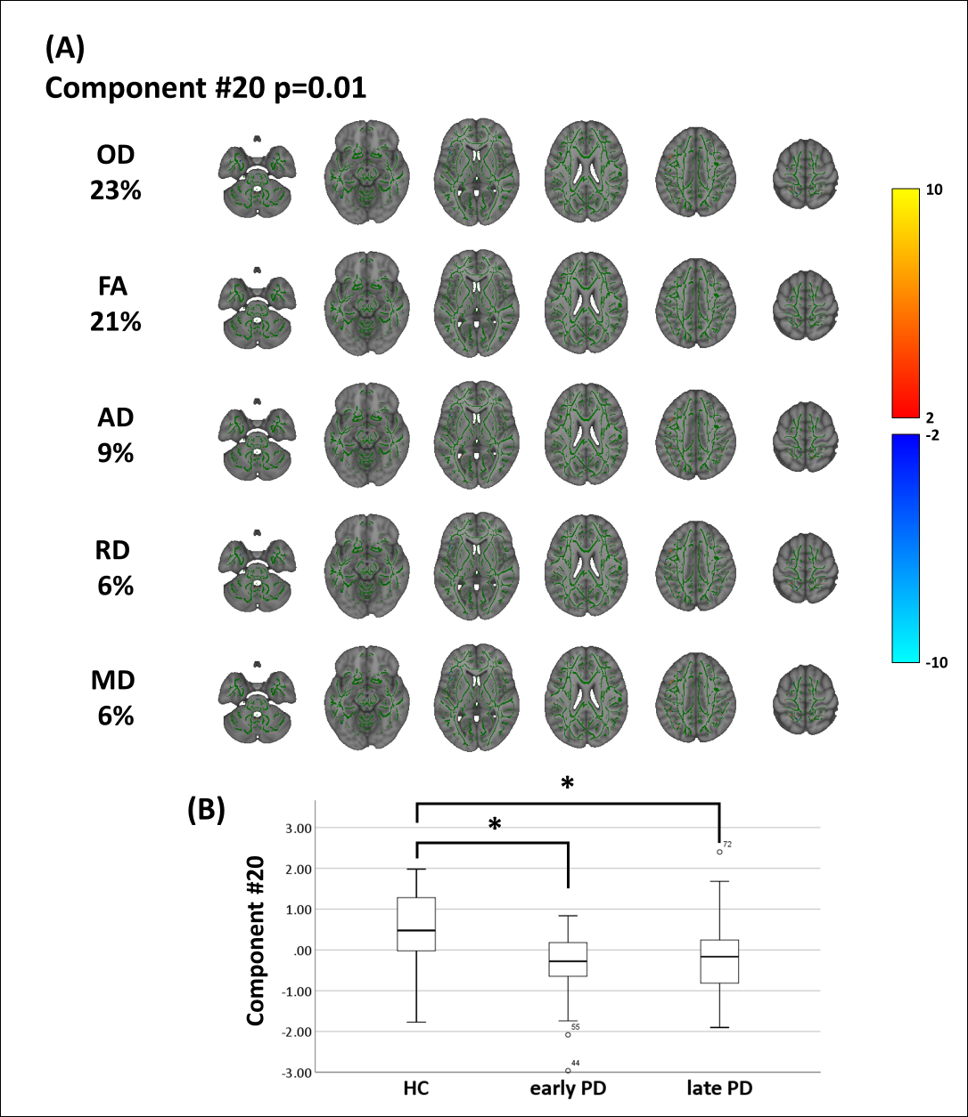
The main effects of diagnoses on subject loadings are presented in Fig. 2A, B, and pairwise group comparisons of Cohen’s d values are presented in Fig. 2C. Among comparisons, the LICA components 2, 16, and 20 were significantly associated with diagnostic groups (p = 0.000011, 0.00081, and 0.01, respectively). The independent component 2 exhibited a highly significant effect of diagnosis (Fig. 3). Moreover, the late PD patients displayed weaker subject loadings than early PD patients and control subjects (late PD-early PD: Cohen’s d=−0.93, p=0.003, late PD-HC: d=−1.31, p=0.0000045). As indicated in Fig. 3, weaker subject loadings on component 2 in the late PD group reflected widespread and correlated decreases in ICVF and FA and increases in RD in extensive cerebral WM. Component 16 was primarily involved in MVF, implicating extensive cerebral WM (Fig. 4). Post-hoc tests revealed significantly lower component-16 subject loadings in late PD patients compared with those in early PD patients (late PD-early PD: Cohen’s d=−1.03, p=0.00023), suggesting reduced MVF in late PD. Component 20 was primarily involved in ODI and FA, suggesting roles in some part of WM (Fig. 5). Post-hoc tests revealed significantly higher loading of component 20 in HC subjects than in early and late PD patients (early PD-HC: d=−1.10, p=0.002, late PD-controls: d=−0.73, p=0.021), suggesting increased FA and reduced ODI in HC subjects.Discussion and conclusion
We detected microstructural WM pathology in PD patients using a multimodal data-driven approach. LICA components were sensitively explanatory of variance in disease severity and showed that decreases in ICVF, FA, and MVF were coordinated with increases in RD. Reductions in ICVF, FA, and increases in RD are considered markers of axonal degeneration, and these changes quantitatively with disease progression. In contrast, decreases in MVF may reflect demyelination, and these occur in late PD. The present changes can be considered indicative of axonal degeneration and demyelination in PD patients. Because principal WM pathologies in PD patients are reportedly characterized by axonal degeneration rather than demyelination (13), our results are in agreement with previous pathological findings. The present data show coordinated WM microstructural alterations in line with disease severity through the stages of PD progression.Acknowledgements
This work was supported by the program for Brain Mapping by Integrated Neurotechnologies for Disease Studies (Brain/MINDS) from Japan Agency for Medical Research and development (AMED); JSPS KAKENHI (JP16K19854).References
1. Kalia LV, Lang AE. Parkinson's disease. Lancet. 2015;386(9996):896-912. 2.
2. Andica C, Kamagata K, Hatano T, Okuzumi A, Saito A, Nakazawa M, et al. Neurite orientation dispersion and density imaging of the nigrostriatal pathway in Parkinson's disease: Retrograde degeneration observed by tract-profile analysis. Parkinsonism & related disorders. 2018;51:55-60.
3. Kamagata K, Motoi Y, Abe O, Shimoji K, Hori M, Nakanishi A, et al. White matter alteration of the cingulum in Parkinson disease with and without dementia: evaluation by diffusion tensor tract-specific analysis. AJNR American journal of neuroradiology. 2012;33(5):890-5.
4. Kamagata K, Motoi Y, Tomiyama H, Abe O, Ito K, Shimoji K, et al. Relationship between cognitive impairment and white-matter alteration in Parkinson's disease with dementia: tract-based spatial statistics and tract-specific analysis. European radiology. 2013;23(7):1946-55.
5. Kamagata K, Tomiyama H, Hatano T, Motoi Y, Abe O, Shimoji K, et al. A preliminary diffusional kurtosis imaging study of Parkinson disease: comparison with conventional diffusion tensor imaging. Neuroradiology. 2014;56(3):251-8.
6. Kamagata K, Tomiyama H, Motoi Y, Kano M, Abe O, Ito K, et al. Diffusional kurtosis imaging of cingulate fibers in Parkinson disease: comparison with conventional diffusion tensor imaging. Magnetic resonance imaging. 2013;31(9):1501-6.
7. Groves AR, Smith SM, Fjell AM, Tamnes CK, Walhovd KB, Douaud G, et al. Benefits of multi-modal fusion analysis on a large-scale dataset: life-span patterns of inter-subject variability in cortical morphometry and white matter microstructure. NeuroImage. 2012;63(1):365-80.
8. Zhang H, Schneider T, Wheeler-Kingshott CA, Alexander DC. NODDI: practical in vivo neurite orientation dispersion and density imaging of the human brain. NeuroImage. 2012;61(4):1000-16.
9. Tabesh A, Jensen JH, Ardekani BA, Helpern JA. Estimation of tensors and tensor-derived measures in diffusional kurtosis imaging. Magnetic resonance in medicine. 2011;65(3):823-36.
10. Basser PJ, Mattiello J, LeBihan D. Estimation of the effective self-diffusion tensor from the NMR spin echo. Journal of magnetic resonance Series B. 1994;103(3):247-54.
11. Helms G, Dathe H, Kallenberg K, Dechent P. High-resolution maps of magnetization transfer with inherent correction for RF inhomogeneity and T1 relaxation obtained from 3D FLASH MRI. Magnetic resonance in medicine. 2008;60(6):1396-407.
12. Smith SM, Jenkinson M, Johansen-Berg H, Rueckert D, Nichols TE, Mackay CE, et al. Tract-based spatial statistics: voxelwise analysis of multi-subject diffusion data. NeuroImage. 2006;31(4):1487-505.
13. Braak H, Del Tredici K. Invited Article: Nervous system pathology in sporadic Parkinson disease. Neurology. 2008;70(20):1916-25.
Figures
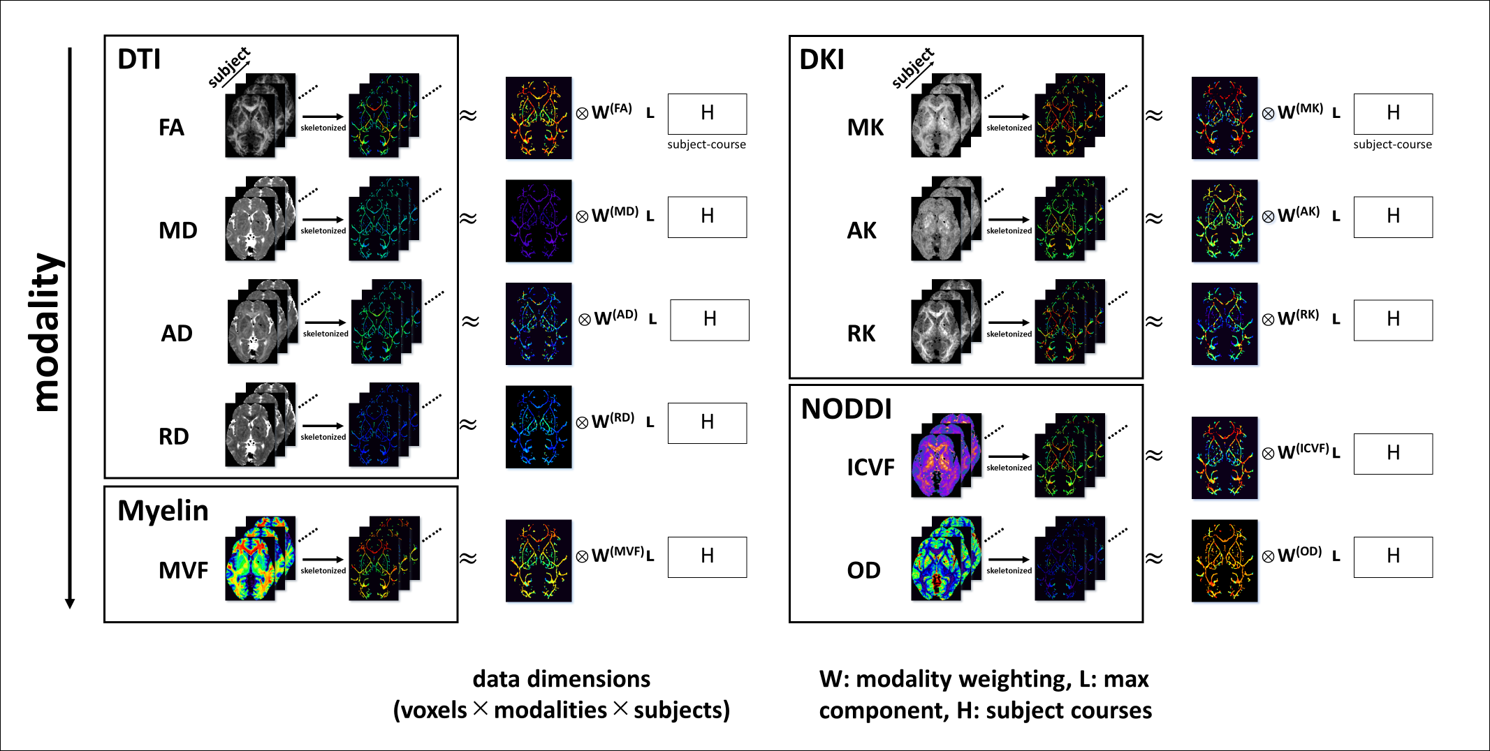
Figure 1. Schematic overview of LICA analyses.
Linked LICA was used in the flat configuration with all ten modalities linked only by the shared subject loading matrix “H.” The outputs of LICA (components) are defined by “H” and by spatial patterns.