2586
Classification of Parkinson’s disease based on multi-parametric data derived from MR Fingerprinting measurements1Philips Research Europe, Hamburg, Germany, 2Department of Radiology, University Hospital Bonn, Bonn, Germany, 3Institute for Neuroradiology, University Hospital Frankfurt/Main, Frankfurt, Germany, 4Department of Neurology, University Hospital Bonn, Bonn, Germany, 5German Centre for neurodegenerative disease research (DZNE), Bonn, Germany, 6Philips Healthcare, Bonn, Germany
Synopsis
We investigated the potential of multi-parametric MR Fingerprinting measurements for the classification of Parkinson’s disease. For each measured quantity (T1, T2, proton density) and each segmented brain region, several statistical parameters were determined and used to train a Random Forest classification algorithm. An AUC of 0.92 was achieved for distinguishing Parkinson patients from healthy control subjects.
Introduction
Early detection of Parkinson’s disease (PD) is of great importance, as symptoms typically arise when a substantial neuron loss has already occurred1. One focus in the search for suitable MRI methods has been on the substantia nigra pars compacta, where a change of iron content can be observed2-4. Recently, a multi-parametric machine learning classifier based on this area was presented5. Multimodal analyses of larger brain areas have also shown promising results6,7.
Using MR Fingerprinting (MRF), a novel method for multi-parametric quantitative data acquisition8,9, several tissue properties can be determined simultaneously, yielding a multi-dimensional feature vector for classification approaches. In this study, we investigate the potential of MRF for the classification of PD, and its ability to determine classifiers in brain regions other than the substantia nigra.
Methods
The study included 39 PD patients (8 female, 31 male, age 70.8±6.9) and 35 healthy volunteers (18 female, 17 male, age 67.8±6.1). Written informed consent was obtained from all participants. The study was performed by permission of the institutional ethics committee.
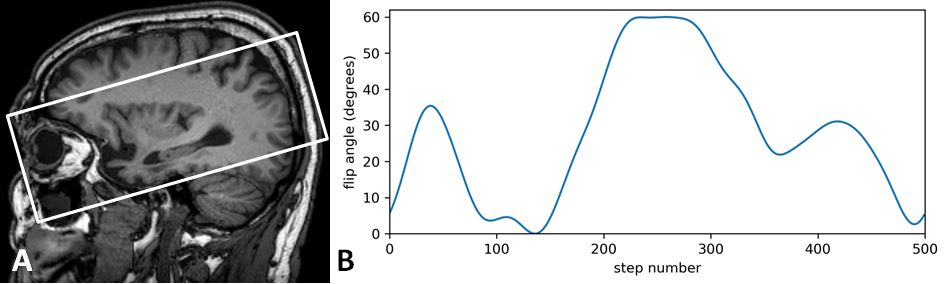
Measurements were performed on a 3T MRI scanner (Achieva TX, Philips Healthcare) using an 8-channel head coil and a gradient-spoiled MR Fingerprinting protocol9 (FOV 240x240x60mm, 12 slices, 3 min 12 s acquisition time). Figure 1 illustrates the geometry and the MRF flip angle sequence used.
The dictionary was resolved in T1, T2, and B1+. A separate B1+ map was acquired to preselect sub-dictionaries for each voxel. In this way, T1, T2, and magnitude (proton density equivalent) maps were generated, discarding the outer slices to avoid bias of imperfect B1 values.
Based on an additional 3D T1-weighted MPRAGE sequence (FOV 256x256x130 mm³, voxel size 1 mm³), segmentation of several brain regions was performed using FSL: Cortical gray matter (GM), normal appearing white matter (NAWM), as well as bihemispheric segmentations of the thalamus, caudate nucleus, putamen, globus pallidum, hippocampus, and amygdala. The segmentations were then co-registered with the MRF data.
For each segmented region, the mean, standard deviation (SD), kurtosis, and skewness of the T1, T2, and proton density distributions were calculated from the MRF maps, yielding a total of 12 parameters per segmented area. Classification tests were performed using the full parameter set, as well as lower-dimensional subsets. We used a stratified 4-fold cross validation based on a Random Forest classification algorithm. The cross validation was repeated ten times, and an average area under curve (AUC) was determined from the resulting receiver operating characteristics (ROC).
Results
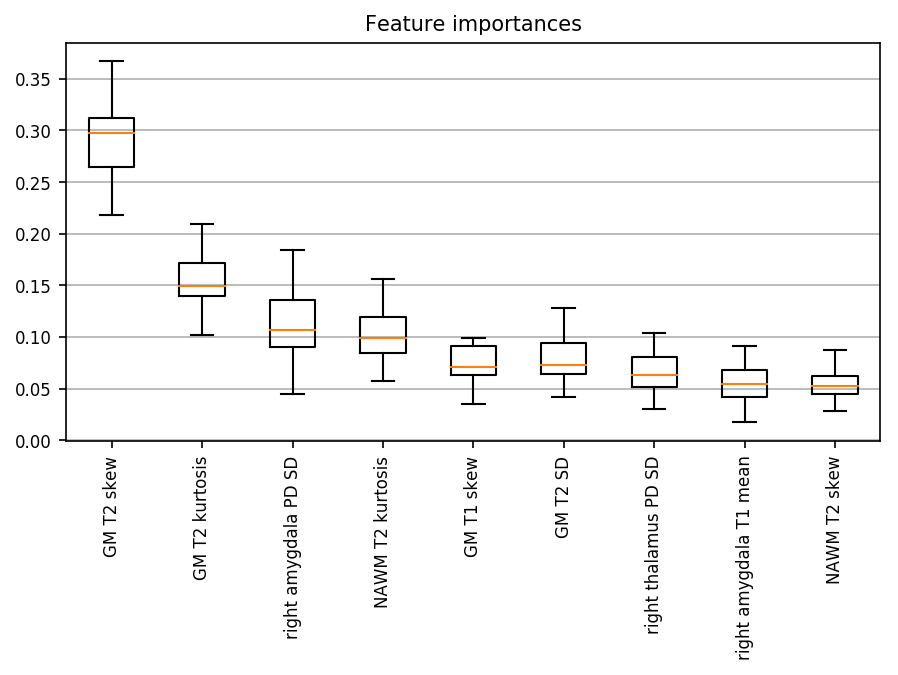
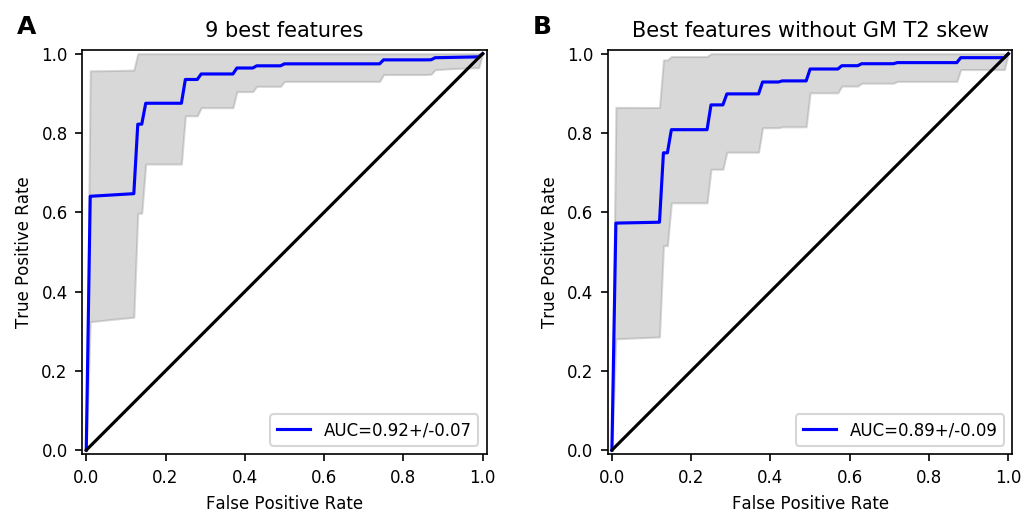
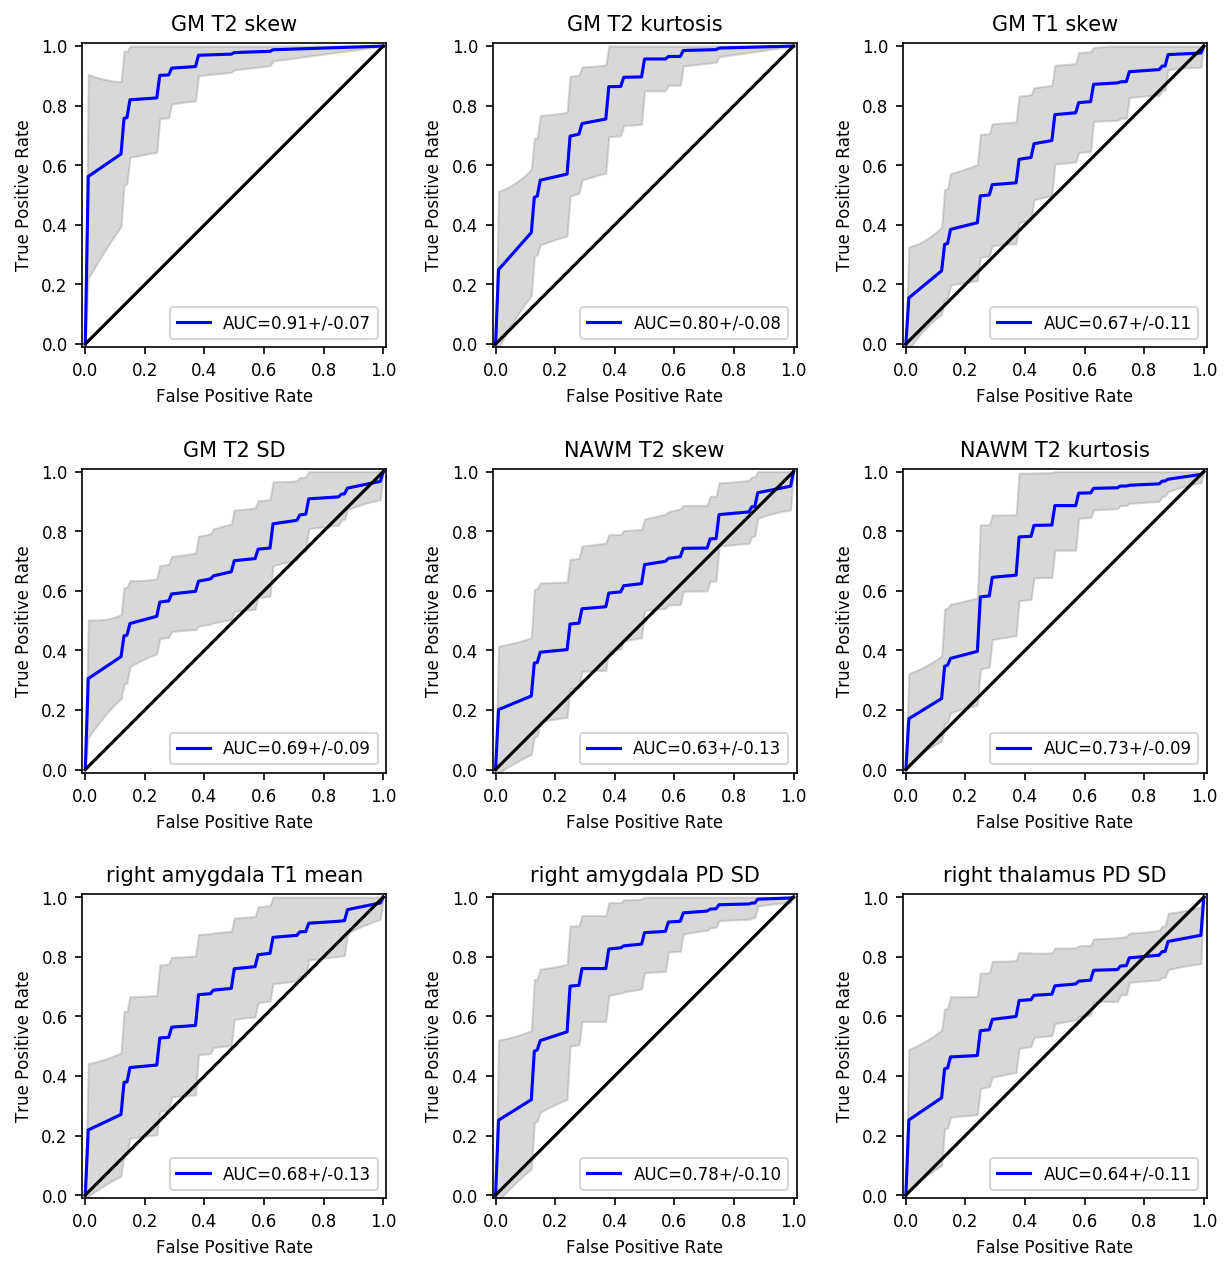
From a cross validation using the full parameter set, we determined all feature importances and restricted further analysis to the nine most important features. Figure 1 shows the relative feature importances for a classification restricted to this subset. The corresponding ROC curve (AUC 0.92) is shown in Figure 2A. One feature (GM T2 skew) outweighs the others in classification performance, which also becomes apparent when using the individual features as single inputs to the classifier as demonstrated in Figure 3. A multidimensional classifier including all but this best feature still yields a comparable average AUC of 0.89 (Figure 2B).
The majority of best features describe the skewness and kurtosis of the distributions, while the mean values seem less relevant.
Discussion
Our analysis implies that the skewness of the T2 distribution in the segmented GM area is a predictive feature for the classification of PD. This may be due to local changes in the cortical GM that are not spatially resolved here. Due to the gradient spoiling in the MRF implementation, the T2 values may also be affected by diffusion effects. Further analysis is necessary to clarify the reason for the classification performance of this parameter.
Notably, even when not considering the GM T2 skewness at all, the combination of the remaining eight parameters still yields an AUC much better than that of the single parameters and almost as good as that of the full parameter set. This demonstrates the benefit of determining multiple tissue properties simultaneously for disease classification tasks.
Next to the GM and WM regions, we identify relevant features in the right amygdala, which is known to be affected by PD10. Other regions known to play a role in PD, such as the putamen, showed only minor parameter variations in our study.
Conclusion
MR Fingerprinting, delivering multiple tissue parameters with a single measurement, can be used to identify PD patients using a machine learning algorithm. The short acquisition time of MRF makes it particularly attractive as a clinical diagnostic tool in this group of patients, who due their movement disorder can hardly endure lengthy protocols.Acknowledgements
No acknowledgement found.References
[1] Politis, M. Neuroimaging in Parkinson disease: from research setting to clinical practice. Nat. Rev. Neurol. 2014;10:708–722
[2] Langley J, Huddleston DE, Sedlacik J et al. Parkinson’s Disease-Related Increase of T2*-Weighted Hypointensity in Substantia Nigra Pars Compacta. Movement Disorders 2017;32:441
[3] Sulzer D, Cassidy C, Horga G et al. Neuromelanin detection by magnetic resonance imaging (MRI) and its promise as a biomarker for Parkinson’s disease. npj Parkinson's Disease 2018;4:11
[4] Baudrexel S, Nürnberger L, Rüb U et al. Quantitative mapping of T1 and T2* discloses nigral and brainstem pathology in early Parkinson’s disease. NeuroImage 2010;51:512
[5] Huddleston DE, Mahmoudi B, Langley J et al. Machine learning classification of Parkinson’s disease using brainstem MRI and demographic features. Proc. Intl. Soc. Mag. Reson. Med. 26 (2018), 0901
[6] Bowman FD, Drake DF, Huddleston DE. Multimodal Imaging Signatures of Parkinson’s Disease. Front. Neurosci. 2016;10:131
[7] Lei H, Huang Z, Zhang J et al. Joint detection and clinical score prediction in Parkinson’s disease via multi-modal sparse learning. Expert Systems With Applications 2017;80:284
[8] Ma D, Gulani, V, Seiberlich, N et al. Magnetic resonance fingerprinting. Nature, 2013;495:187-193
[9] Jiang Y, Ma D, Seiberlich N, Gulani V, Griswold M. MR Fingerprinting Using Fast Imaging with Steady State Precession (FISP) with Spiral Readout. Magn Reson Med 2014;74:1621-1632
[10] Li X, Xing Y, Schwarz ST, Auer DP. Limbic Grey Matter Changes in Early Parkinson’s Disease. Human Brain Mapping 2017;38:3566-3578
Figures