2585
Differentiating Parkinson’s disease patients from healthy controls through high iron content deposition in the substantia nigra1Department of Radiology, School of Medicine, Wayne State University, Detroit, MI, United States, 2Department of Radiology, Ruijin Hospital, Shanghai Jiao Tong University School of Medicine, shanghai, China, 3Magnetic Resonance Innovations, Inc., Bingham Farms, MI, United States, 4Department of Neurology and Institute of Neurology, Ruijin Hospital, Shanghai Jiao Tong University School of Medicine, Shanghai, China
Synopsis
In this work, 25 Parkinson’s disease patients and 24 healthy controls (HC) were scanned in order to quantify brain iron content in eight major deep gray matter structures. In addition to comparing global iron deposition, a novel threshold-based method was used to assess regional high iron (RII) in these nuclei. Among all the structures, the substantia nigra (SN) was the only one showing significantly higher iron content in PD patients compared to that of the HC cohort with the regional analysis revealing more prominent results. There are two populations of PD patients, those that do not change iron content in SN and those that do. For the abnormally high SN iron content group, there was a significantly higher UPDRS-III than the group showing normal iron content.
Introduction
It is well known that iron is important in the pathophysiology of Parkinson’s disease (PD) patients specifically related to degeneration of the substantia nigra (SN)1. Magnetic resonance imaging provides an in-vivo means to measure and monitor brain iron content. This is usually accomplished by measuring iron in the entire (global) structure but this approach is insensitive to regional changes in iron content which may be more representative of changes in the SN. The goal of this work was to use quantitative susceptibility mapping to quantify both global and regional brain iron content2 in PD patients and healthy controls (HC) in order to ascertain if regional changes correlate with clinical conditions and can be used to discriminate PD patients from HC.Methods
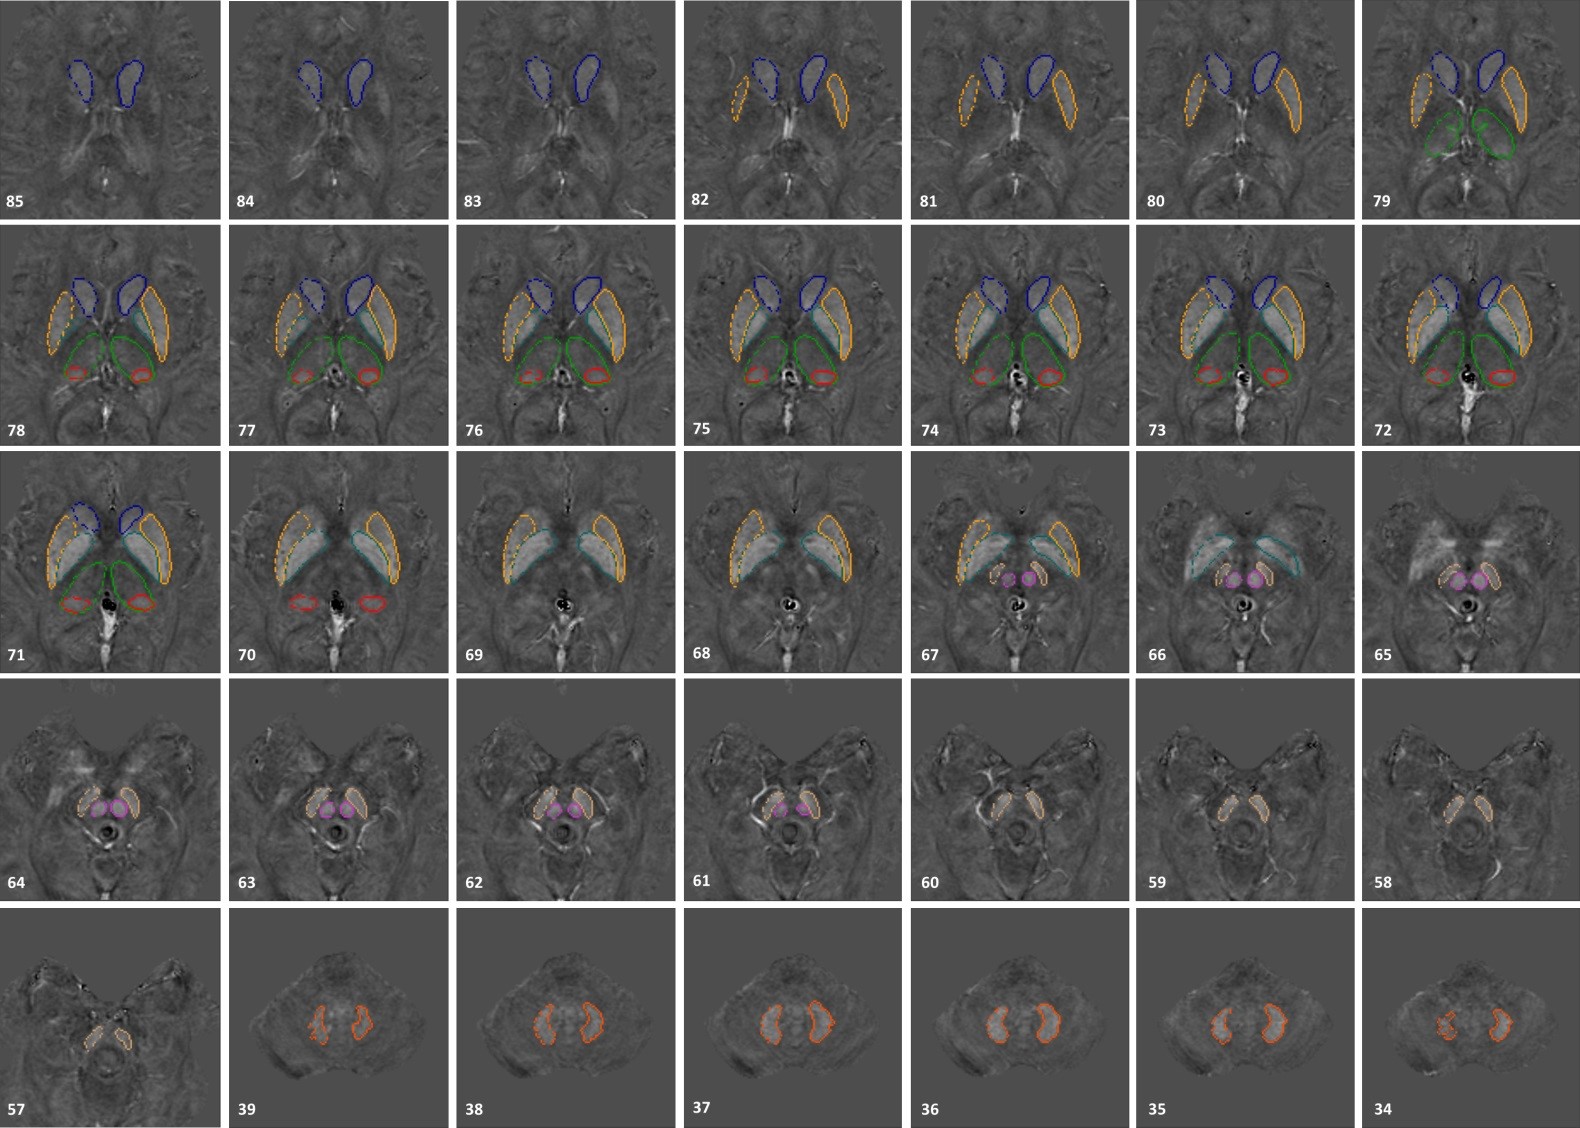
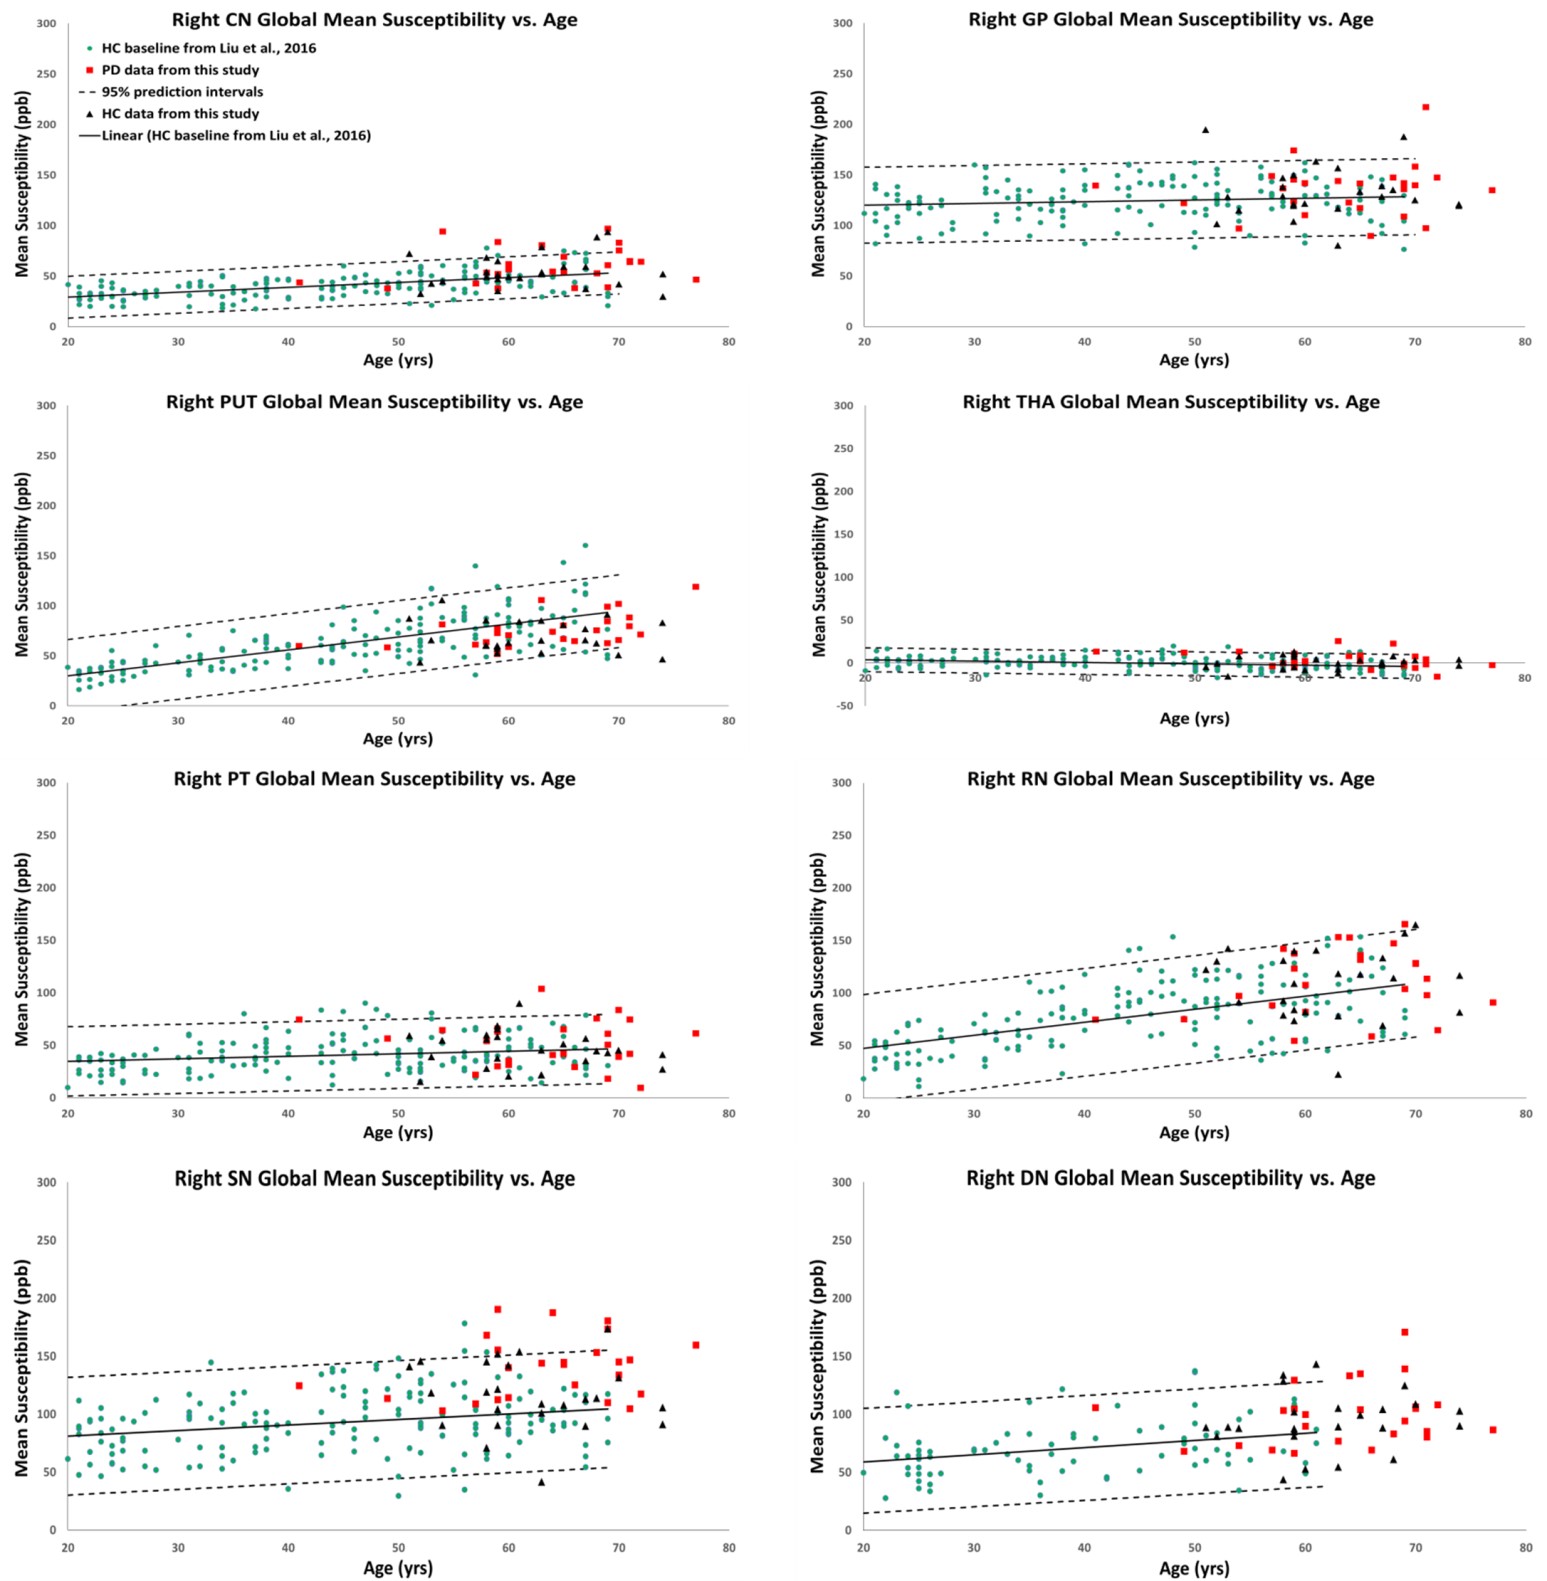
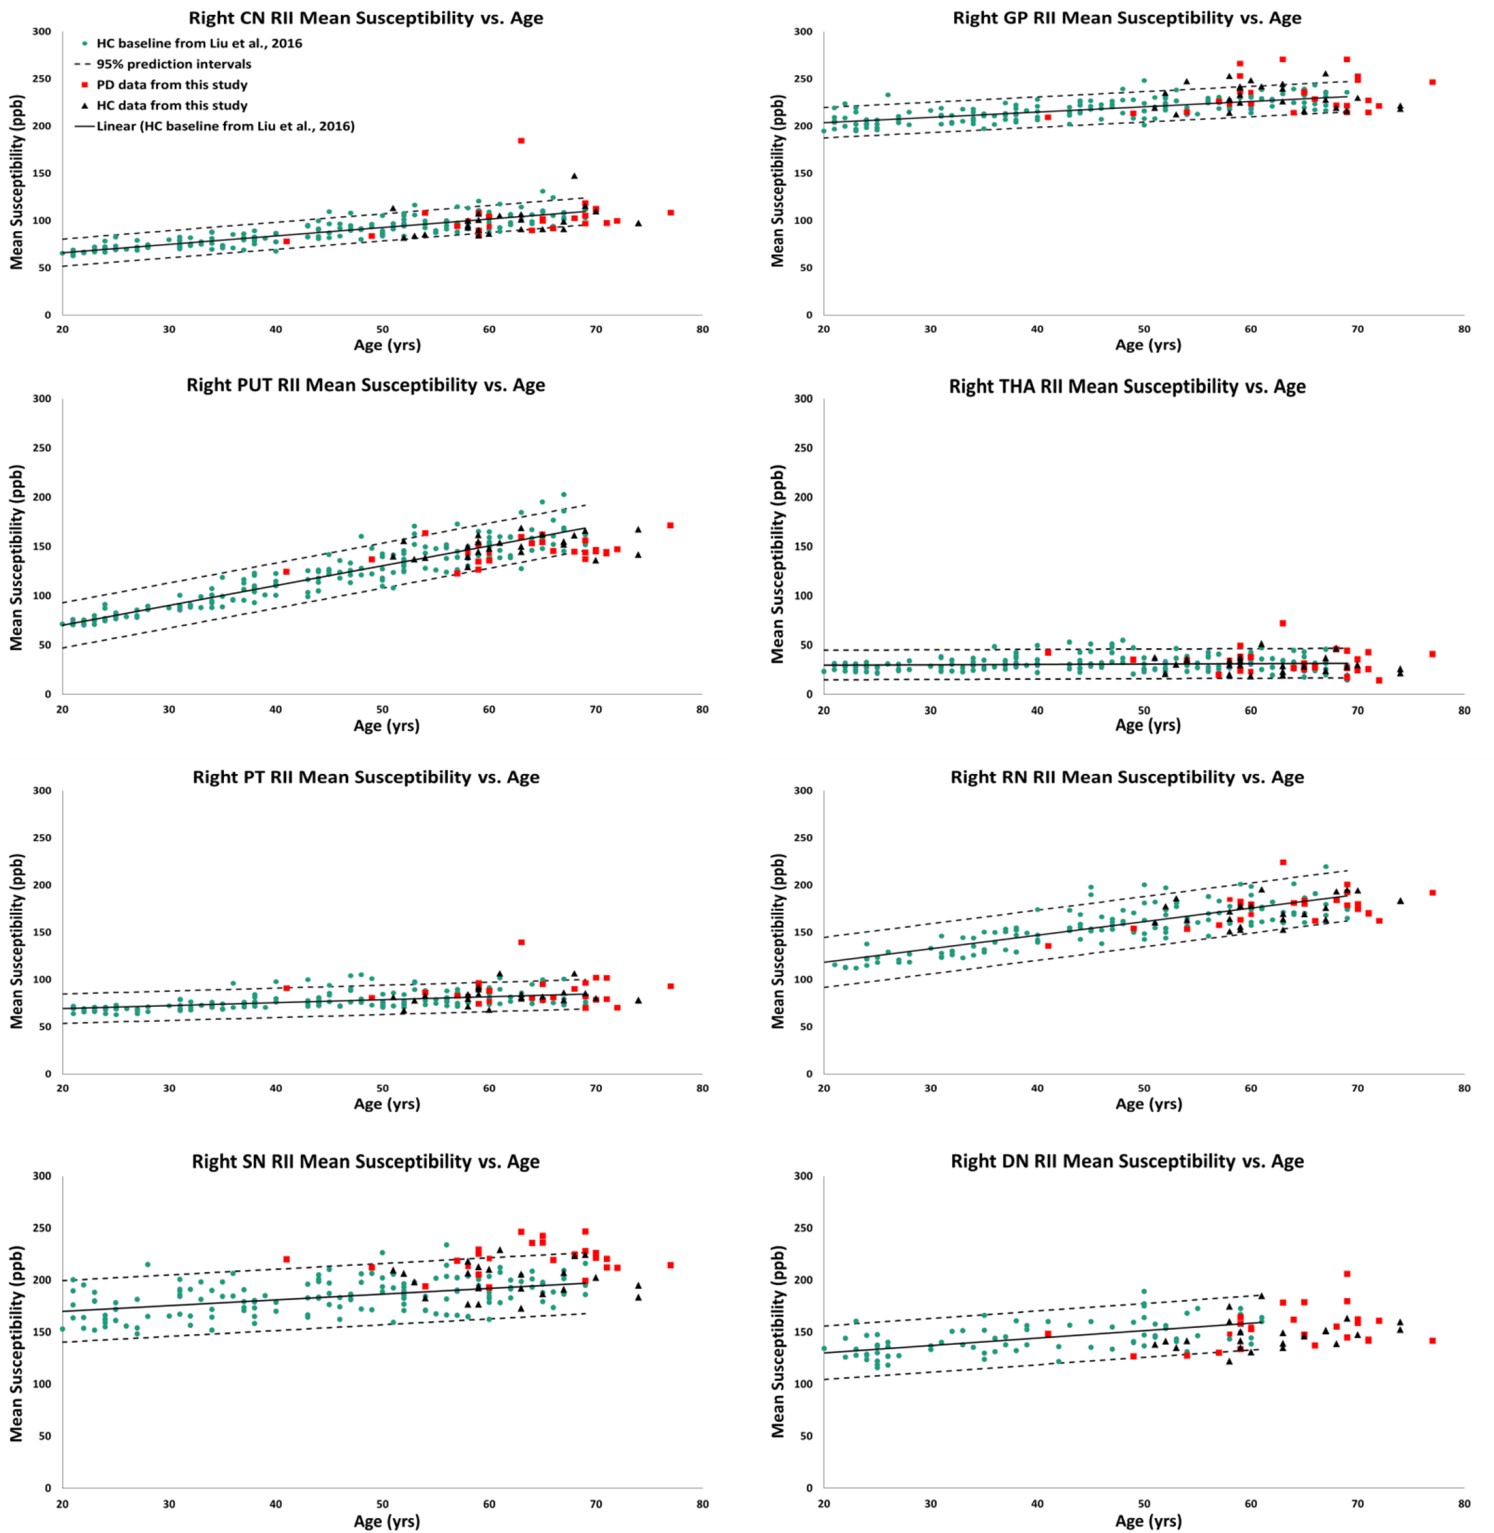
A total of 49 subjects were evaluated: 25 PD patients (61.8 ± 6.4 years old) and 24 HC (63.4 ± 8.0 years old). Data were collected using a 16 echo, gradient echo imaging sequence on a 3T GE Signa HDxt with the following imaging parameters: TE1 = 2.69ms, ΔTE = 2.87ms, TR = 59.3ms, pixel bandwidth = 488 Hz/pixel, flip angle = 12°, slice thickness = 1mm, matrix size = 256 × 256 and an in-plane resolution of 0.86 × 0.86 mm2. Only 8 echoes were used due to severe frontal signal loss at echo times longer than roughly 20ms. The reconstruction steps included the brain extraction tool (BET) to segment only the brain tissue,3 quality guided 3D phase unwrapping algorithm (3DSRNCP) for phase unwrapping,4 sophisticated harmonic artifact reduction for phase data (SHARP) for background field removal,5 and an iterative approach referred to as iterative susceptibility weighted imaging and mapping (iSWIM) for inverse filtering.6,7 Three-dimensional regions of interest were manually traced for eight deep gray matter (DGM) structures using our in-house software SPIN, as shown in Figure 1. Similar to Liu et al.’s work, age-dependent susceptibility values were chosen as thresholds from the upper 95% prediction intervals based on their global analysis of 174 controls from which high iron (RII) content voxels were then estimated for a given structure at a given age for all the basal ganglia and midbrain structures.2 For the dentate nucleus, a similar analysis was performed on the baselines developed by Ghassaban et al.’s study from 81 healthy adults.1 For both PD and HC cohorts, mean susceptibilities from the global and high iron regions were calculated and plotted as a function of age superimposed on the corresponding baselines established by Liu et al and Ghassaban et al..1,2 Additionally, two-sample t-tests were performed to compare the mean susceptibilities of both cohorts using the global and regional analyses. Finally, clinical features from PD patients were compared for those patients with SN mean RII values above and below the upper 95% prediction intervals from the normal population.Results
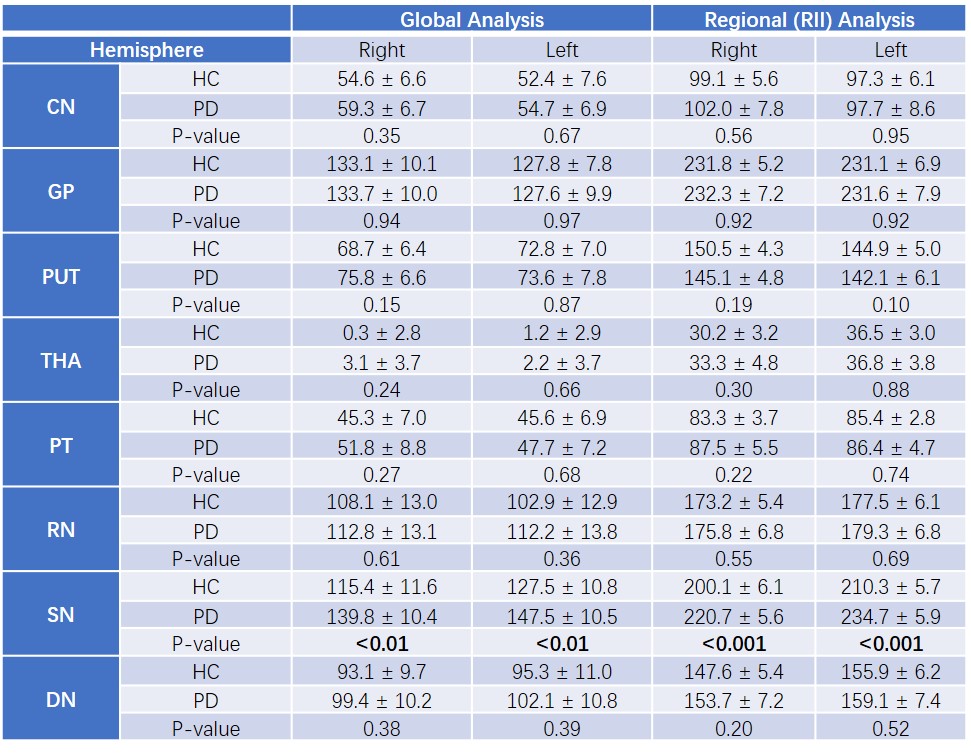
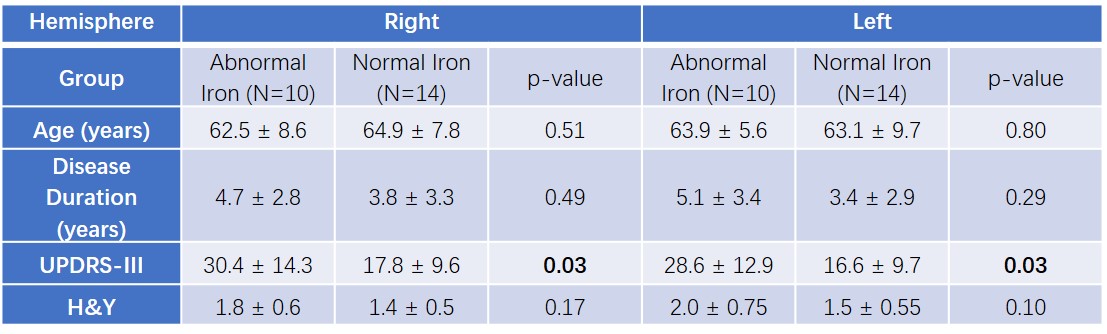
The results of the two-sample t-tests comparing the susceptibility means of HC and PD cohorts in both hemispheres are summarized in Table 1. Only the SN showed significantly higher susceptibility values in PD patients when compared with healthy controls, with the regional analysis revealing more prominent differences compared to those of the global analysis. Figures 2 and 3 show the global and regional analyses for the right hemisphere of both groups, respectively, superimposed on the corresponding normal baselines. The SN also appears to be the only structure showing elevated levels of susceptibility values in both global and regional analyses with a more rapid susceptibility-age increasing trend compared to that of the HC group. The left hemisphere also showed similar trends. Furthermore, those PD patients lying above the 95% prediction intervals had significantly higher unified Parkinson’s diagnostic rating scores (UPDRS)-III, as shown in Table 2.Discussion and conclusion
In this work, we have shown that the SN reveals an increase in iron over and above the normal increases due to age in the PD. We also note that there may, in fact, be two populations of PD patients, those that do not change iron content and those that do. A key finding in this work that validates previous results is the tightness of the iron growth with age in the different DGM structures in the regional iron content measures. That effect is mirrored in this data and may provide a new means to evaluate the role of local high iron content changes. Abnormal iron deposition in the SN, especially where it is regionally high, could serve as a new biomarker both to distinguish Parkinson’s disease patients from healthy controls and to assess the disease severity.Acknowledgements
No acknowledgement found.References
1. Ghassaban K, Liu S, Jiang C, Haacke EM. Quantifying iron content in magnetic resonance imaging. NeuroImage. 2018.
2. Liu M, Liu S, Ghassaban K, et al. Assessing global and regional iron content in deep gray matter as a function of age using susceptibility mapping. Journal of magnetic resonance imaging : JMRI. 2016;44(1):59-71.
3. Smith SM. Fast robust automated brain extraction. Human brain mapping. 2002;17(3):143-155.
4. Abdul-Rahman HS, Gdeisat MA, Burton DR, Lalor MJ, Lilley F, Moore CJ. Fast and robust three-dimensional best path phase unwrapping algorithm. Applied optics. 2007;46(26):6623-6635.
5. Schweser F, Deistung A, Lehr BW, Reichenbach JR. Quantitative imaging of intrinsic magnetic tissue properties using MRI signal phase: an approach to in vivo brain iron metabolism? NeuroImage. 2011;54(4):2789-2807.
6. Haacke EM, Tang J, Neelavalli J, Cheng YC. Susceptibility mapping as a means to visualize veins and quantify oxygen saturation. Journal of magnetic resonance imaging : JMRI. 2010;32(3):663-676.
7. Tang J, Liu S, Neelavalli J, Cheng YC, Buch S, Haacke EM. Improving susceptibility mapping using a threshold-based K-space/image domain iterative reconstruction approach. Magnetic resonance in medicine : official journal of the Society of Magnetic Resonance in Medicine / Society of Magnetic Resonance in Medicine. 2013;69(5):1396-1407.
Figures