2584
Voxel-Based Meta-Analysis of Mutant α-Synuclein transgenic Marmoset using Multiparametric MRI1Center for Brain Science, RIKEN, Wako, Japan, 2Keio University School of Medicine, Tokyo, Japan, 3Central Institute for Experimental Animals, Kanagawa, Japan, 4Tokyo Metropolitan University Graduate School, Tokyo, Japan
Synopsis
In this study, we evaluated the characteristics of the brain in a genetically modified marmoset model of Parkinson’s disease. Various contrast images were acquired using magnetic resonance imaging (MRI), and the whole brain underwent explorative investigation with each contrast. For each image, statistical evaluation was performed using SPM. Diffusion tensor MRI showed significance differences in the thalamus, while magnetization transfer ratio images showed a significant difference in the nigral striatum. The findings suggest that the marmoset is useful as a model animal to study human diseases.
Background/Purpose
Parkinson's disease is an intractable neurodegenerative disease and there has been increasing interest in the methods for its diagnosis and treatment. The disease is predominantly characterized by extrapyramidal symptoms and movement disorders. It is difficult to detect Parkinson's disease at an early stage and distinguish it from other diseases in the differential diagnosis such as dementia. Thus far, we have succeeded in developing a gene-modified Parkinson’s disease model using the common marmoset (1). Using this animal, we have pursued identifying imaging findings that can detect Parkinson’s disease at a very early stage. Using magnetic resonance imaging (MRI), it is possible to acquire the relaxation contrast, magnetization transfer contrast, diffusion contrast, and information concerning the brain tissue. By acquiring images of various contrasts and performing brain image statistical evaluation, we comprehensively evaluated the characteristics of gene-modified Parkinson's disease model animals.
Method
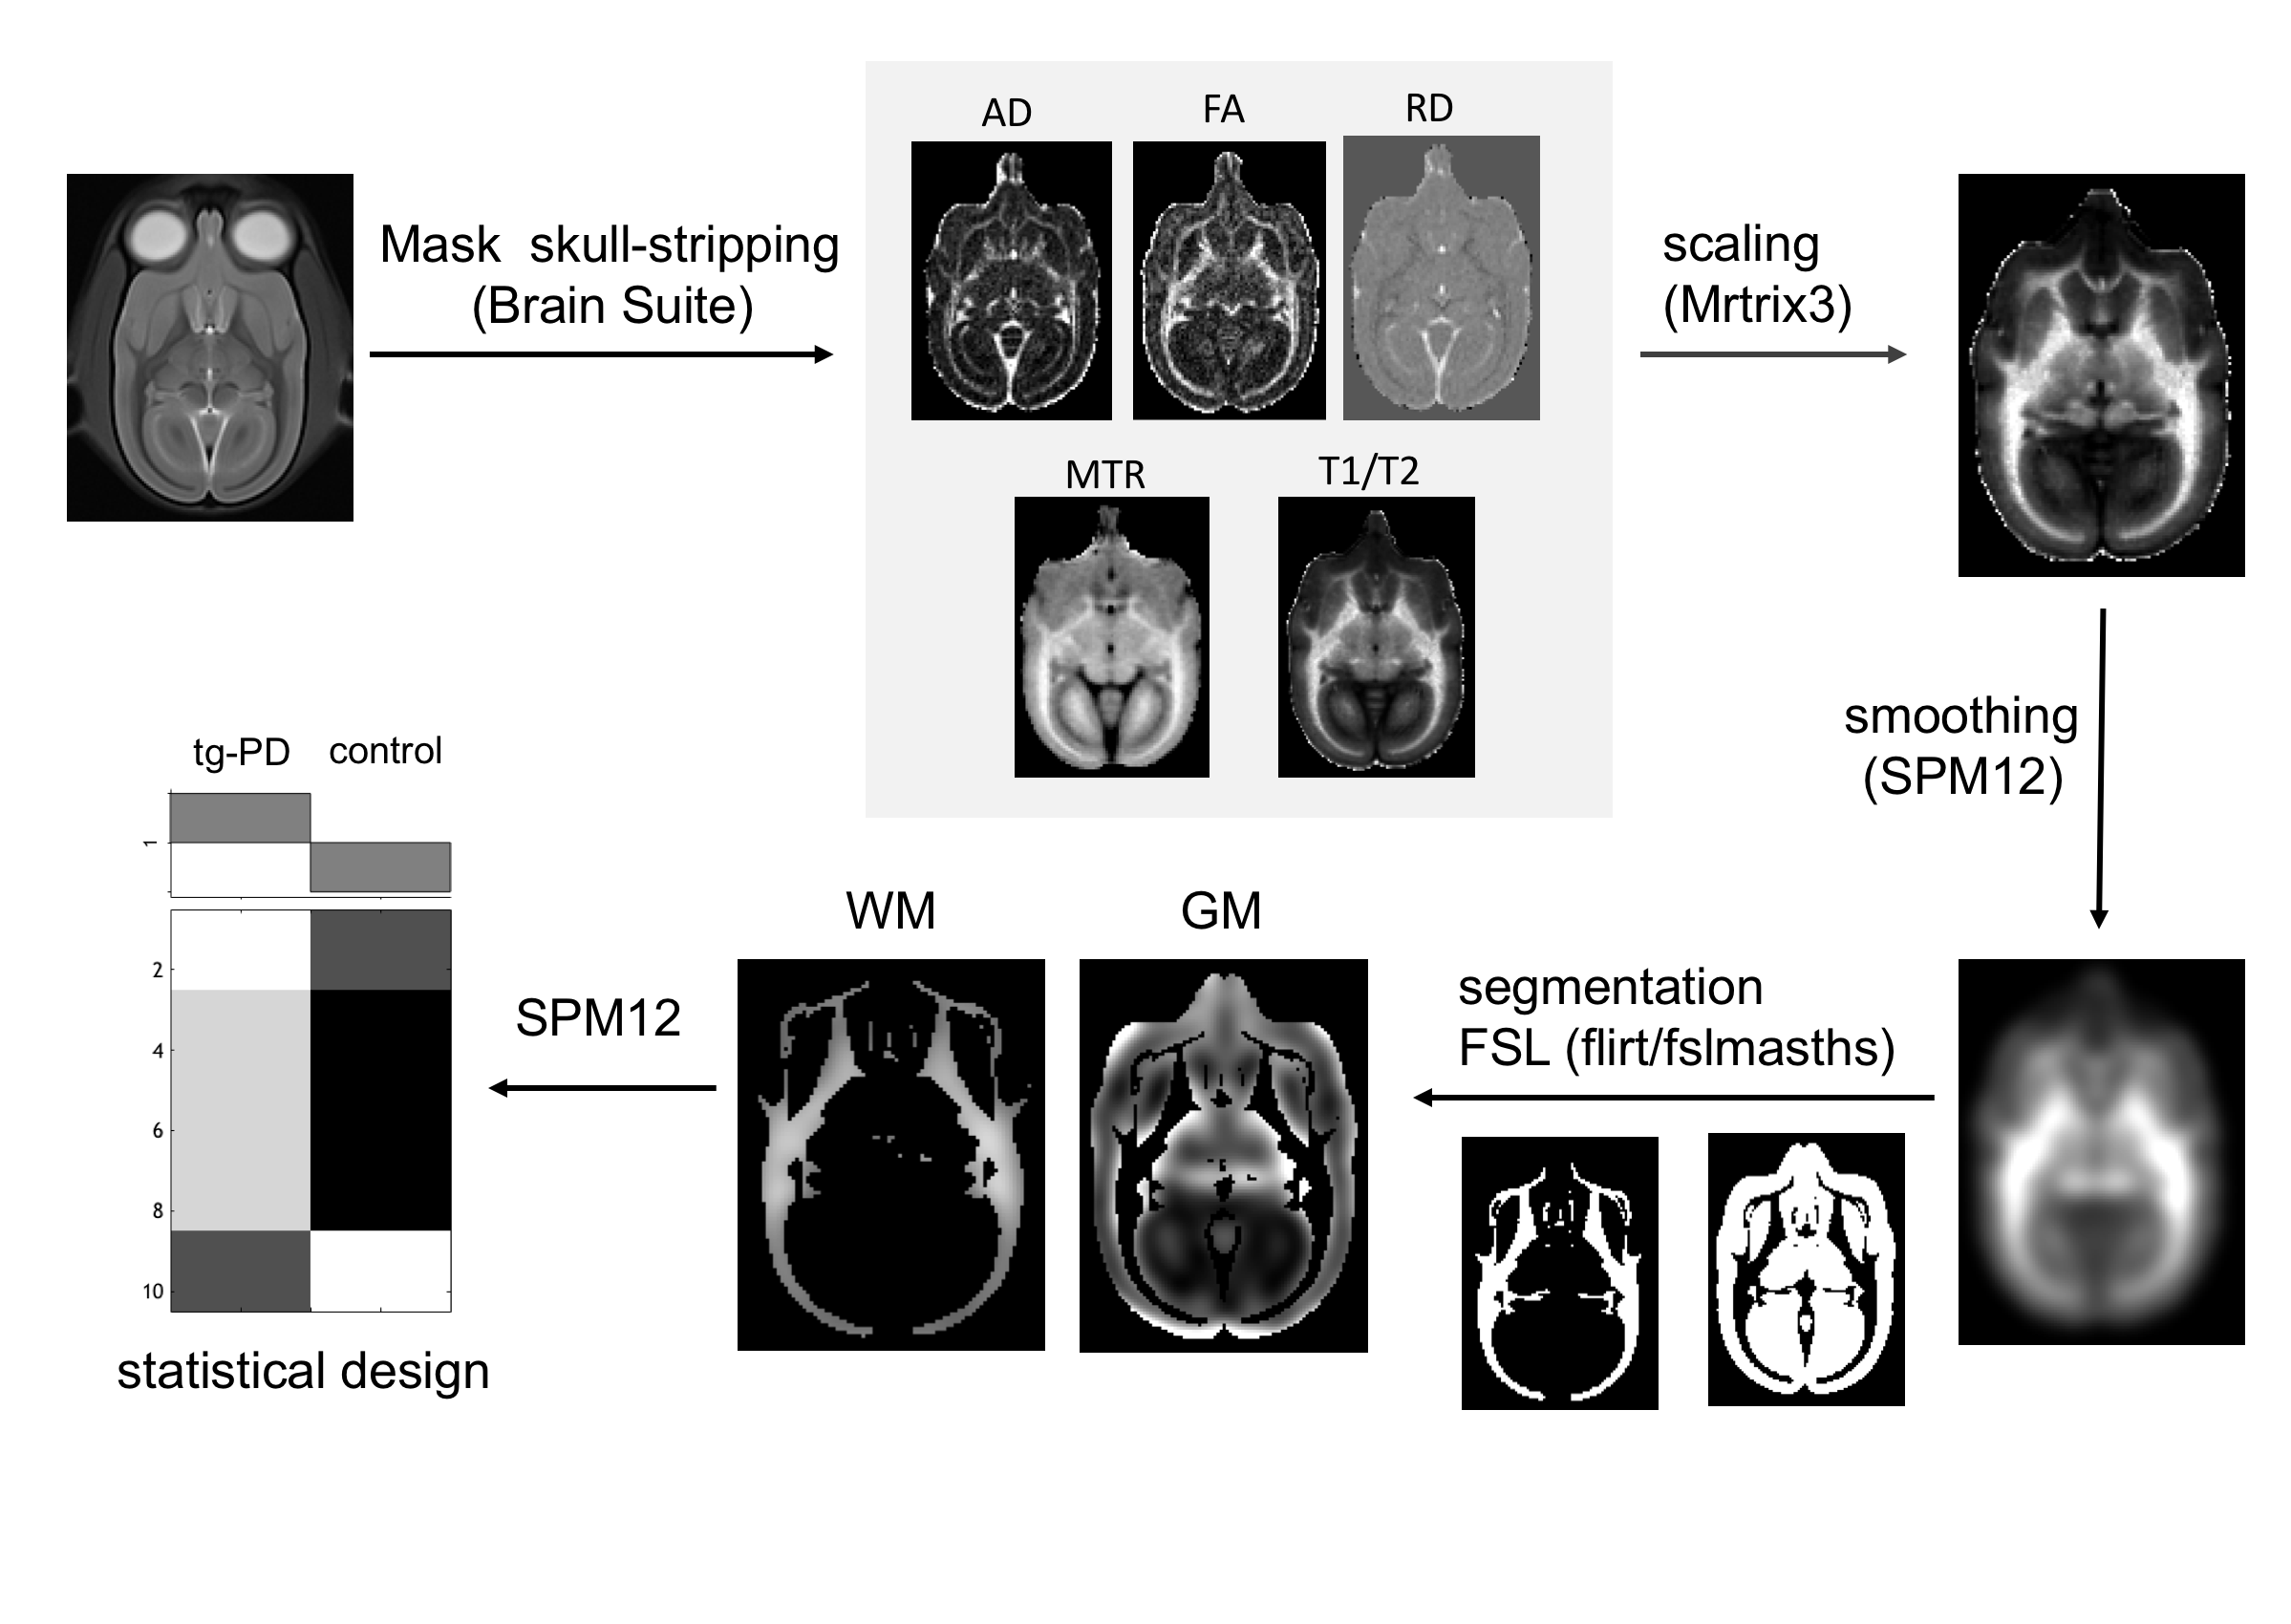
The experiments were conducted using the common marmoset (Callithrix jacchus), a non-human primate. During MRI, the animals were managed by inducing gas anesthesia using a mixture of 1.8-2.5% isoflurane and 0.3 L/min oxygen. Furthermore, the heart rate, respiratory rate, SPO2, and rectal temperature of the animals were monitored and controlled during the scans. The Parkinson’s disease model group that had undergone gene modification and was developed in this laboratory (n=2, mean age = 3.9 years) and the healthy control group that had undergone the natural development process (n = 10, mean age = 4.6 years) were compared. MRI was performed using a 9.4-T MRI scanner (Biospec 94/30 MRI; Bruker BioSpin; Ettlingen, Germany) where the T1-weighted images (WI), T2-WI, diffusion WI (b-value 1000 and 3000 s/mm2), and magnetization transfer ratio (MTR) images were acquired. We used T1WI and T2WI images as T1/T2 to produce an image that emphasized the myelin sheath (2). The MTR image was calculated using an image that was taken to which an MT pulse was not applied (3). For diffusion-weighted images, values of axial diffusivity (AD), radial diffusivity (RD) and fractional anisotropy (FA) were calculated using tensor analysis (4). The analysis procedures are shown in Fig. 1. For each image, we evaluated degeneration in different brain regions using MATLAB 2018a and SPM12. Using respective images from the healthy group and Parkinson’s disease model group calculations, we carried out comparisons between the two groups by voxel based meta-analysis (VBA). This study was approved by the local Animal Experiment Committee and was conducted in accordance with the Guidelines for Conducting Animal Experiments of the RIKEN CBS.Result
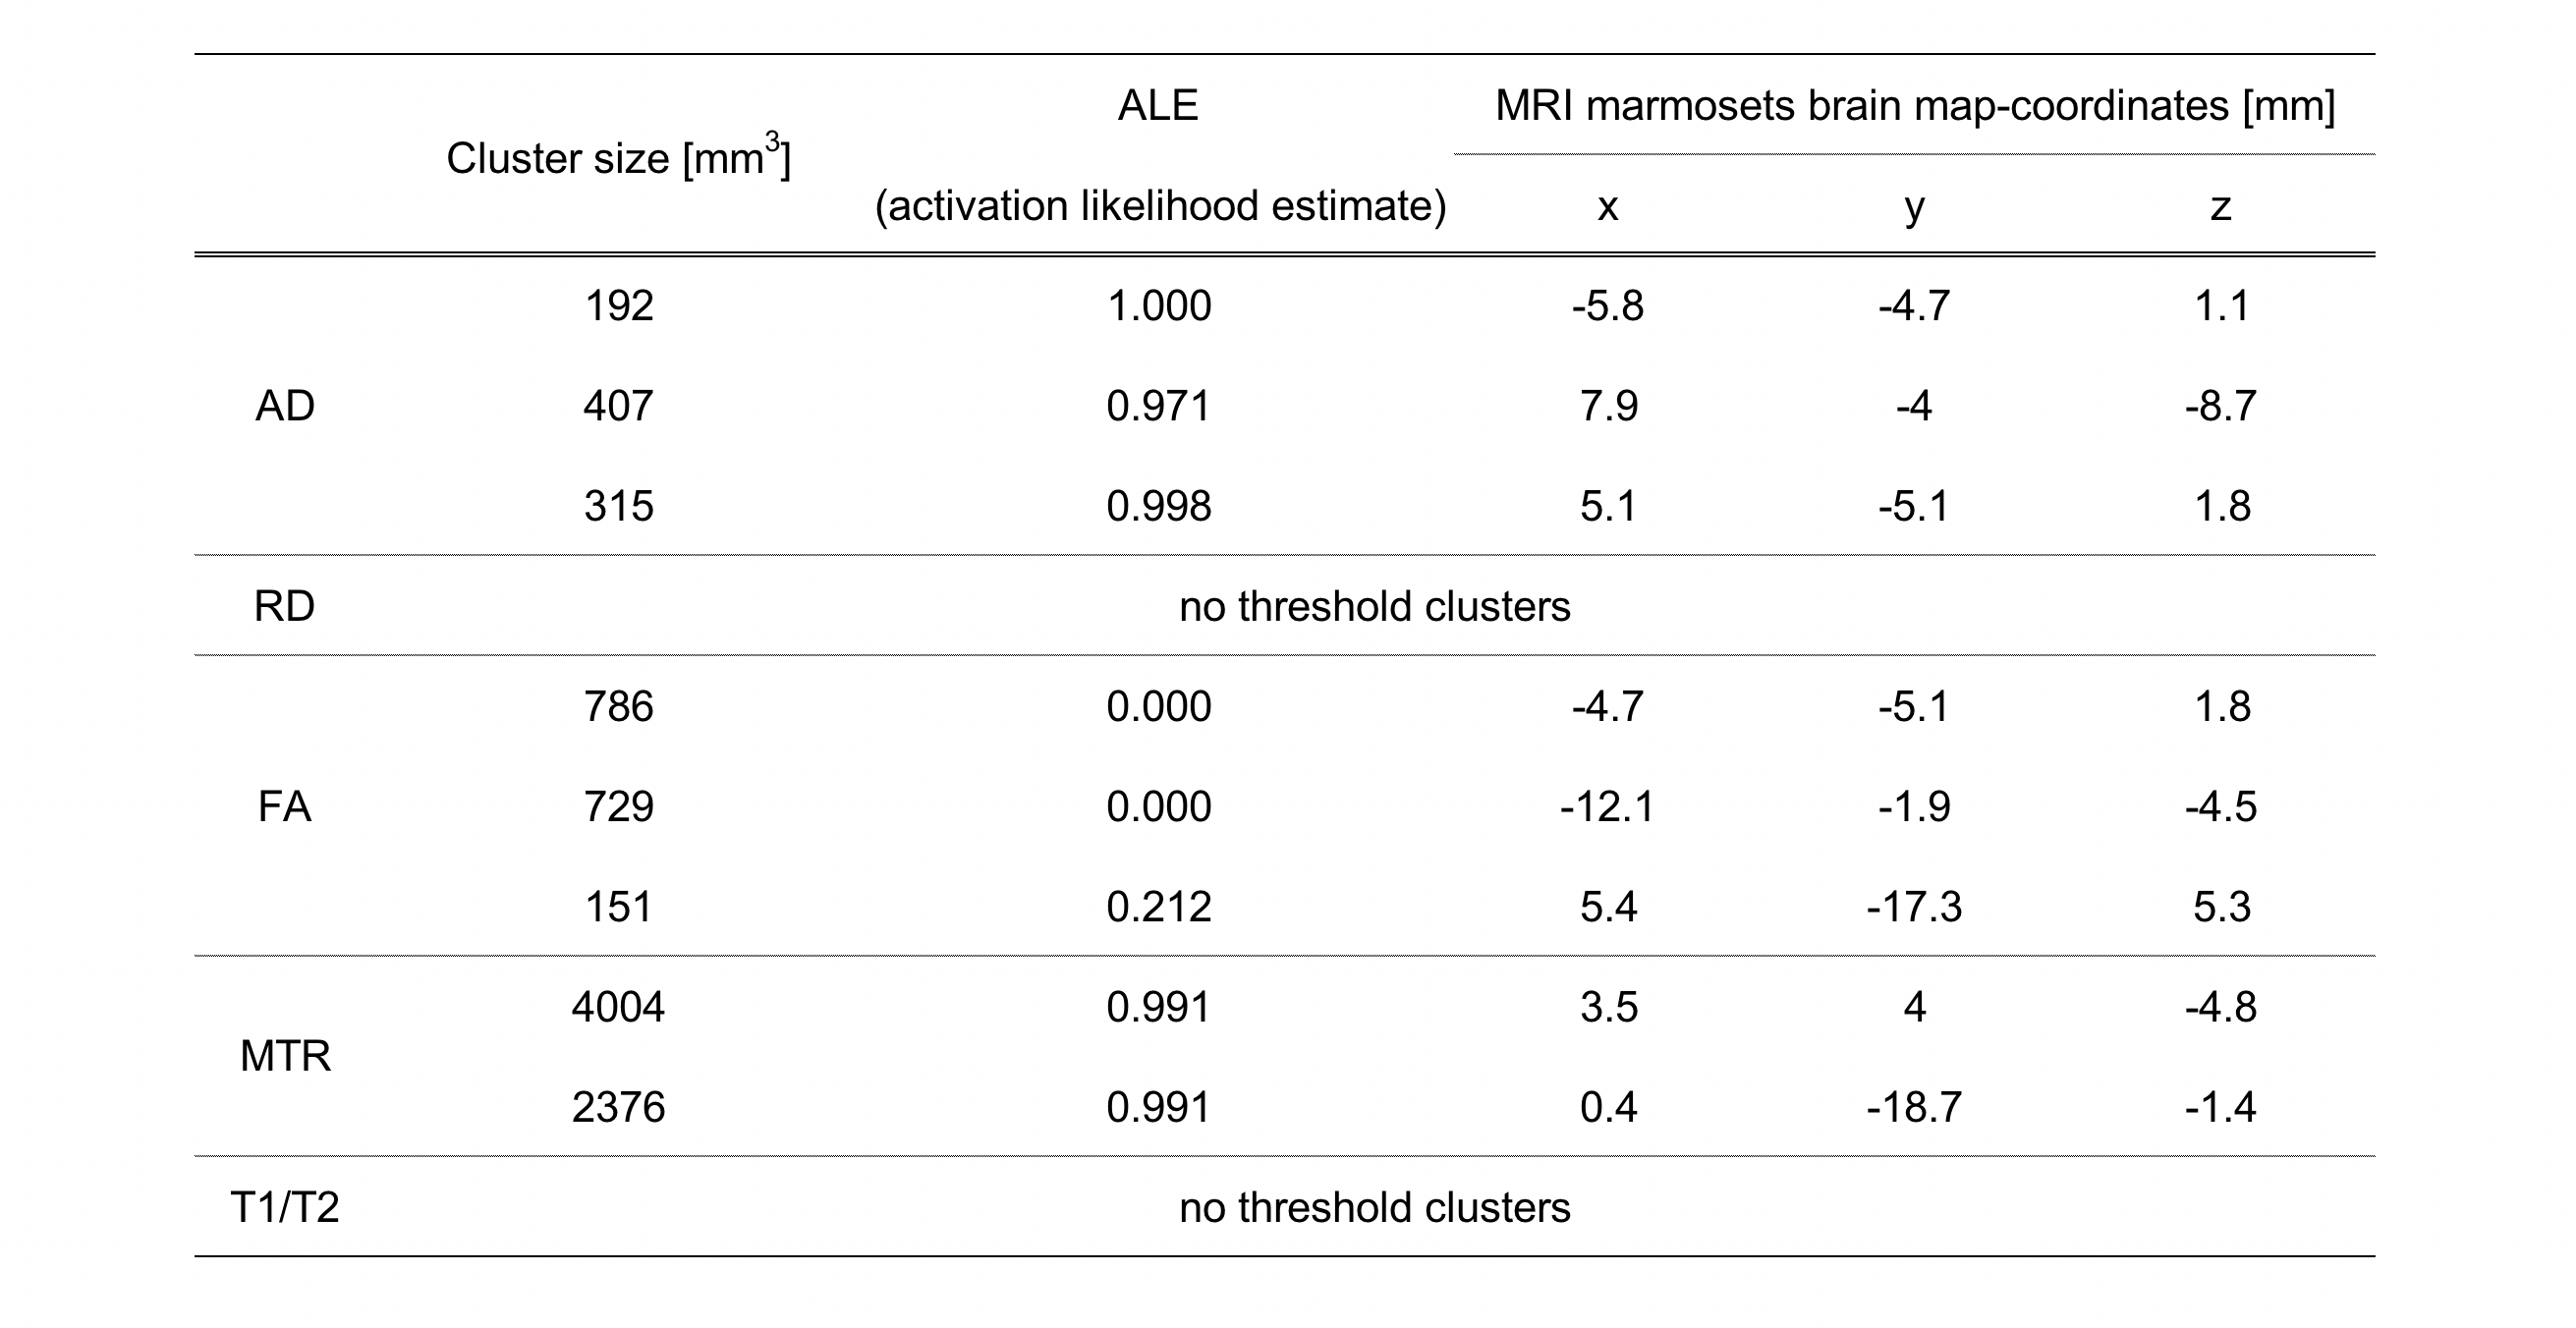
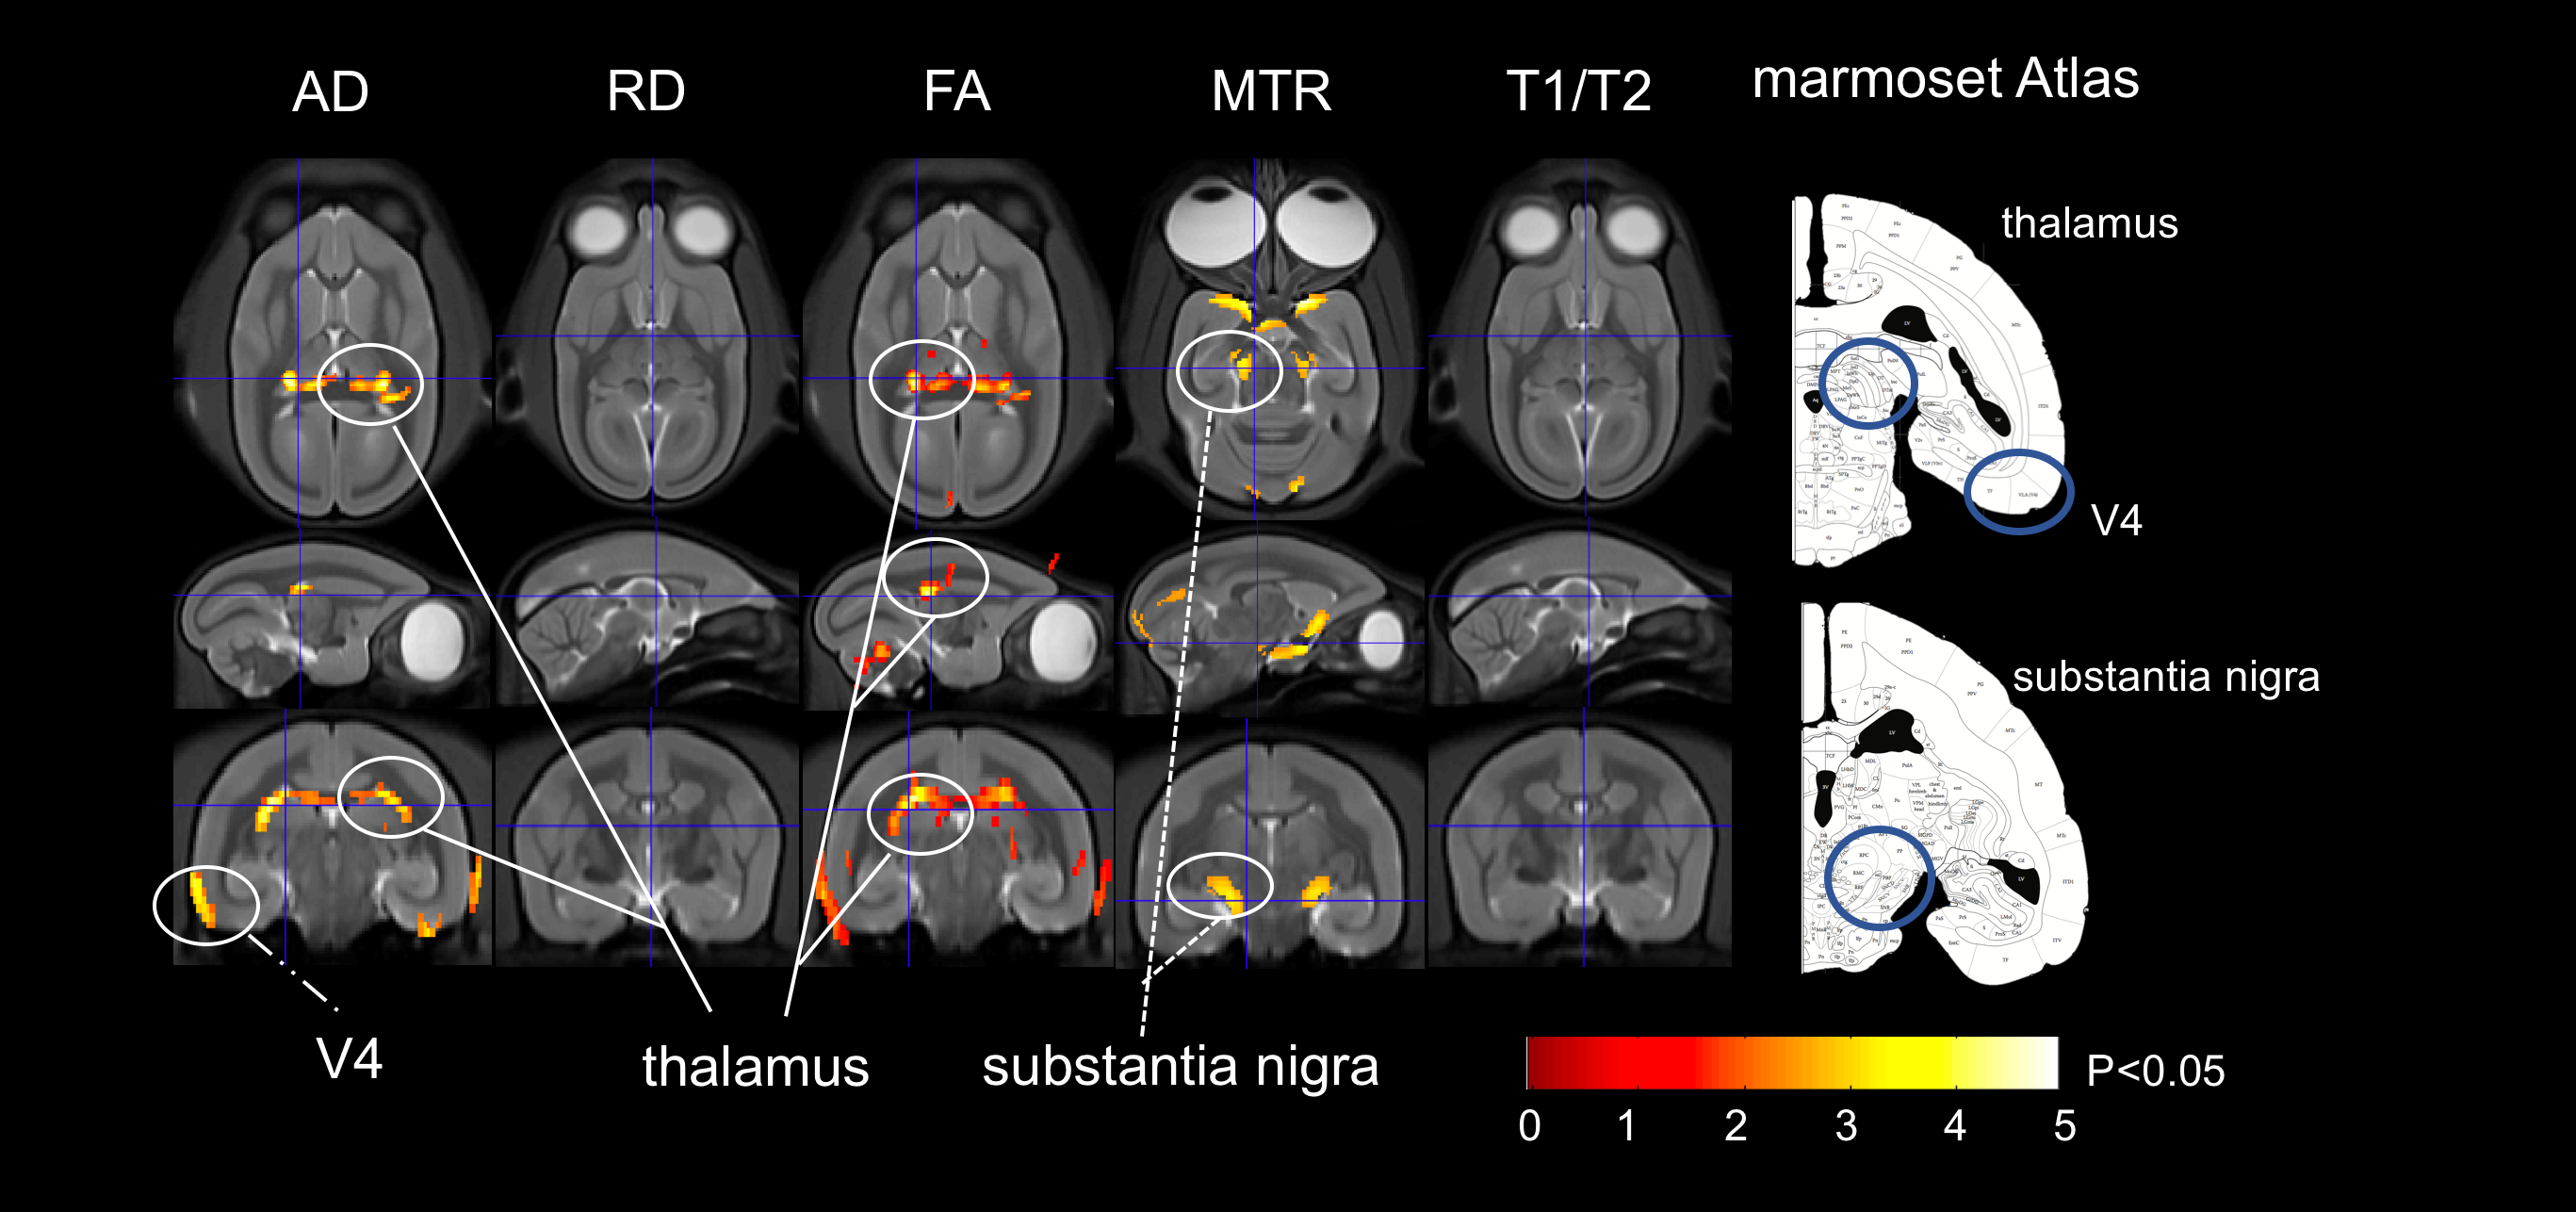
We performed comparisons between the Parkinson’s disease model and healthy control groups. In the T1/T2 image, we detected significant changes in the thalamus. In the diffusion image, when the AD, RD, and FA values were determined, there was a significant difference in the FA values of the two groups. In terms of the area of the brain, as with the T1/T2 image, there were large changes in the thalamus. In the MTR image, we detected changes in areas including the nigral striatum and superior colliculus. Discussion
Compared to clinical studies previously conducted
in humans, degeneration was observed in several areas (5)(6). There
are reports (7) describing changes in the nigral striatum, superior
colliculi, and thalamus, and it was suggested that the gene-modified marmoset
model in this study may have exhibited similar neurodegeneration (8).
In addition, we have been able to observe changes in the microstructure of the
brain using diffusion VBA. By gaining more detailed knowledge such as this, we
believe that we can understand how the brain of the PD marmoset is changing. Furthermore,
we believe that the PD marmoset will be useful as a model animal for the
pre-clinical research of human diseases. Therefore, marmosets that have
undergone genetic modification in this study can be used as a model animal for
the study of human diseases to develop a method for the very early diagnosis of
disease and development of treatments.
Acknowledgements
This research is partially supported by the program for Brain Mapping by Integrated Neurotechnologies for Disease Studies (Brain/MINDS) from Japan Agency for Medical Research and development, AMED.References
(1) Sasaki et al., Nature 2009,
(2) Ganzetti M, et al., Front Hum Neurosci. 2014,
(3) Engelbrecht V. et al.,Am J Neuroradiology. 1998,
(4) Basser PJ, et al., Biophysical journal 1994,
(5) Nan-Kuei Chen et al., Brain Connectivity, 2018,
(6) Anil Y et al., Academic Radiology. 2007,
(7) Hikishima, K., et al., NEUROSCIENCE, 2015,
(8) Padovani A et al., J Neurol Neurosurg Psychiatry. 2006
Figures