2582
Analysis of changes in brain structure in patients with Parkinson's disease and their correlation with the Hoehn-Yahr stage using the MPRAGE sequence1Department of MRI, The First Affiliated Hospital of Zhengzhou University, Zhengzhou, China, 2MR Collaboration, Siemens Healthcare, Ltd., Beijing, China, 3Advanced Clinical Imaging Technology, Siemens Healthcare AG, Lausanne, Switzerland, 4Department of Neurology, The First Affiliated Hospital of Zhengzhou University, Zhengzhou, China
Synopsis
In this study, the volume changes of brain structure in Parkinson's disease (PD) patients were analyzed. We found extensive structural brain changes in PD patients, and most of these changes were correlated with the Hoehn-Yahr stage. The results showed that volume changes in some brain regions may be a potential imaging marker for early diagnosis of PD, and the MPRAGE sequence may be a suitable and quick method to provide a reference for clinicians to diagnose PD.
Introduction
It is still challenging to perform an early diagnosis of Parkinson's disease (PD) using routine imaging. The aim of this study was to explore the application of MRI-based volume measurements of morphological changes caused by PD, and to analyze the differences in brain structural changes with the progression of the disease to improve the early diagnosis of PD.Methods
Data were collected on a MAGNETOM Prisma 3T MR scanner (Siemens Healthcare, Erlangen, Germany) with a 64-channel head coil. Ninety-five PD patients (Group 1: 54 early stage, Group 2: 41 middle-late stage) and 55 healthy volunteers (Group 3) were recruited. All the subjects underwent MRI examinations, including a high-resolution Magnetization-Prepared Rapid Acquisition Gradient Echo (MPRAGE) prototype sequence. A brain morphometry analysis was integrated into this prototype, providing tissue classification and morphometric reports [1]. Acquisition parameters included: TR/TE = 2300 ms/2.9 ms, TI = 900 ms, Flip angle = 9°, FOV = 256 × 256 mm2, voxel size = 1.0×1.0×1.2 mm3, slice thickness = 1.2 mm, iPAT factor = 2, and acquisition time = 5:12 mins. Brain structural volume reports were obtained for each subject. The relative volume, defined as the ratio of one brain region volume to the total intracranial volume, was used for the statistical analysis.
The differences in brain structures between the three groups were analyzed by one-way ANOVA. The correlation between volume changes and the Hoehn-Yahr (HY) stage were analyzed by Spearman analysis. SPSS 22.0 (IBM Corp., Armonk/NY, USA) was used to perform the statistical analysis. A P-value < 0.05 was considered statistically significant.
Results
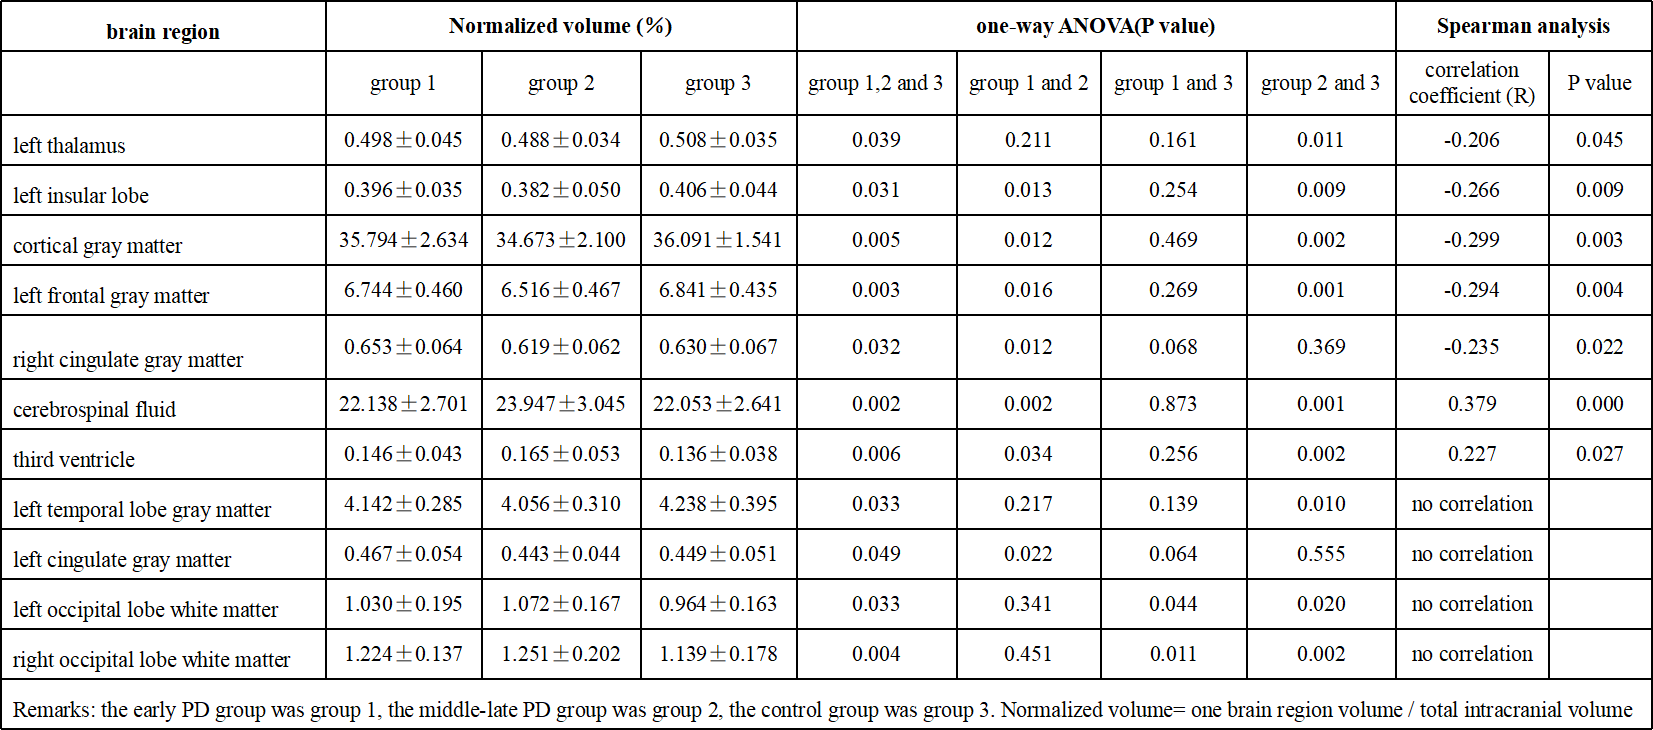
The volume of cortical gray matter, left frontal gray matter, and the left insular lobe in the middle-late PD group was significantly smaller than in the early PD and control groups (Figure 1). The volume of bilateral cingulate gyrus gray matter in the middle-late PD group was significantly smaller than in the early PD group. The volume of left temporal lobe gray matter and left thalamus in the middle-late PD group was significantly smaller than in the control group. In contrast, the volume of cerebrospinal fluid (CSF) and third ventricle in the middle-late PD group was significantly larger than in the early PD and control groups. The bilateral occipital white matter volume in the early and middle-late PD groups was significantly larger than in the control group.
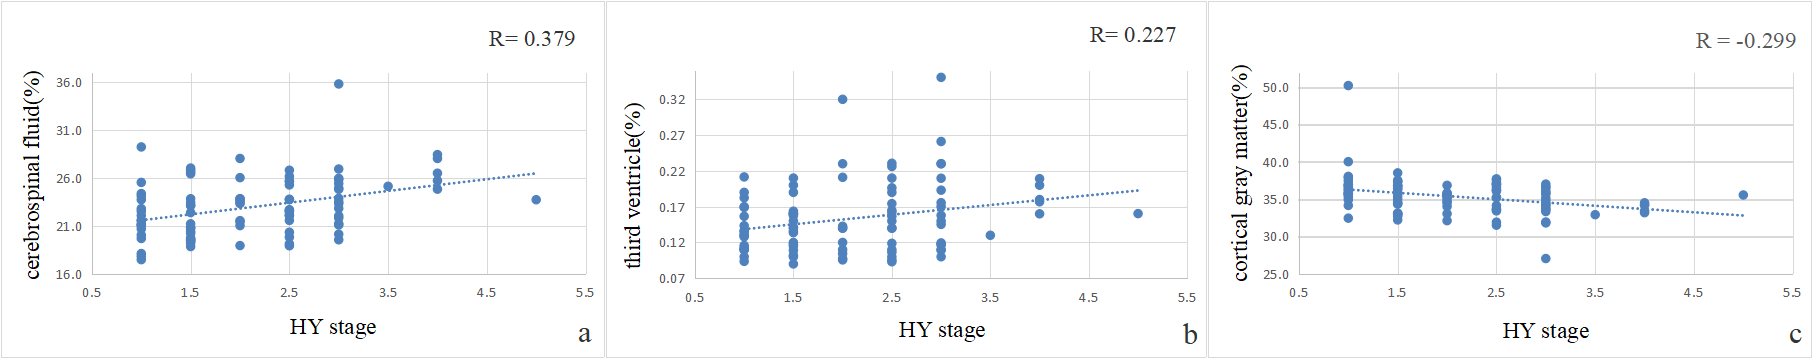
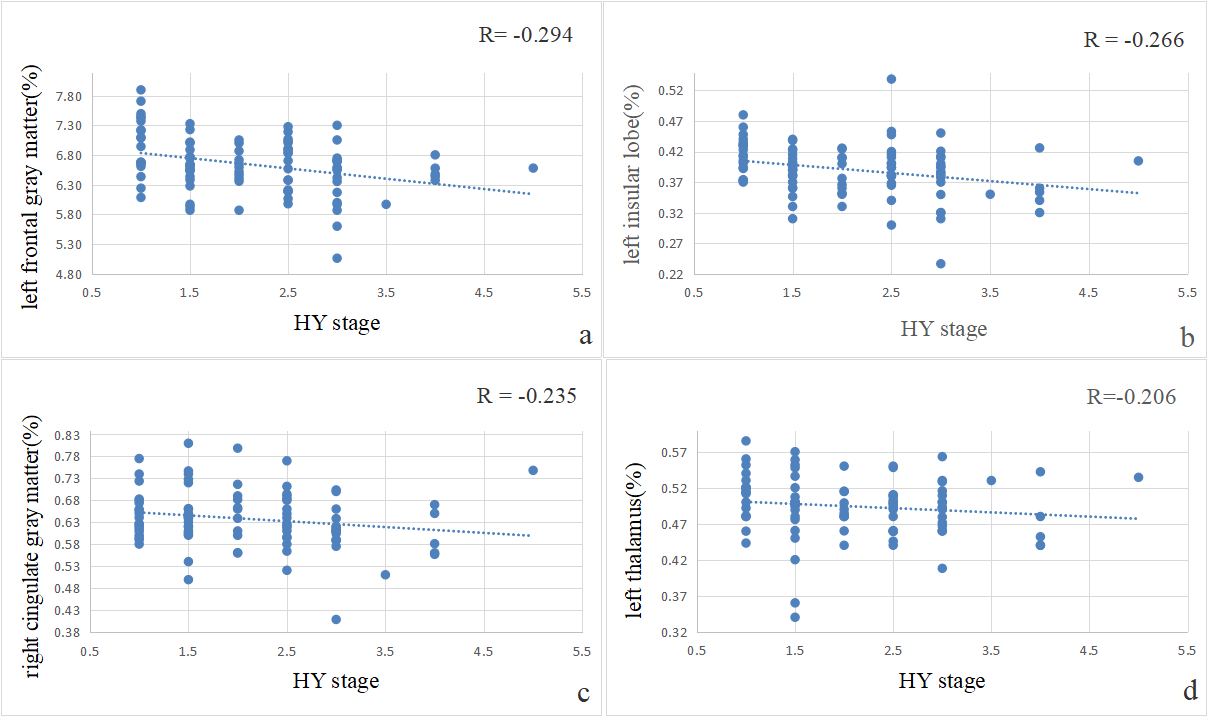
The correlation analysis results between volume changes and the HY stage (Figures 1, 2, and 3) showed a positive correlation with CSF and the third ventricle and a negative correlation with the cortical gray matter, left frontal gray matter, left insular lobe, right cingulate gyrus gray matter, and left thalamus. However, there was no correlation between the HY stage and left cingulate gray matter, left temporal lobe gray matter, and bilateral occipital lobe white matter.
Discussion
The extensive abnormal structural brain changes in PD are closely related to motor and non-motor symptoms. Previous research methods were complex and time-consuming [2]. In this study, the brain volume report was integrated into the MPRAGE prototype sequence. This is simple, convenient, and quick, and is more suitable for clinical application.
In this study, the MPRAGE prototype sequence was first applied to PD patients in China. The data from healthy volunteers provided a reference for the establishment of standard volume values of brain structure in normal middle-aged and elderly individuals. There were more atrophic brain structures in the left cerebral area of PD patients, reflecting the asymmetry of the left and right cerebral hemispheres. In addition, the rate of degeneration in the left hemisphere was faster in PD patients [3]. Those brain structural changes found in early PD patients may be a potential imaging marker for the early diagnosis of PD and a viable marker for prodromal neurodegeneration in PD. This study also showed that some brain structural changes appeared only in middle-late stage patients, possibly because limited face recognition, speech clumsiness, negative emotions, and other symptoms are more likely to occur at the middle-late stages of PD. Brain structural changes shown in Figures 2 and 3 were correlated with the HY stage, indicating that these brain structural volumes increased or decreased with the increase in HY stage in patients.
Conclusion
We found that with disease progression, the volume of many brain structures in PD patients changes. The MPRAGE prototype sequence can quickly assess a patient's brain volume changes and is more suitable for clinical practice. It can also provide a reference for clinical diagnosis and pathogenesis research in PD patients.Acknowledgements
No acknowledgement found.References
[1] Schmitter D, Roche A, Maréchal B, et al. An evaluation of volume-based morphometry for prediction of mild cognitive impairment and Alzheimer's disease. Neuroimage Clinical, 2015, 7(C):7-17.
[2] Fioravanti V, Benuzzi F, Codeluppi L, et al. MRI correlates of Parkinson's disease progression: a voxel based morphometry study. Parkinson’s Disease, 2015, 2015:378032.
[3] Thompson P M, Hayashi K M, De Z G, et al. Dynamics of gray matter loss in Alzheimer's disease. Journal of Neuroscience the Official Journal of the Society for Neuroscience, 2003, 23(3):994-1005.
Figures