2578
Utility of Quantitative Susceptibility Mapping & Diffusion Kurtosis Imaging in the Diagnosis of Early Idiopathic Parkinson’s Disease1National Neuroscience Institute, Singapore, Singapore, 2Duke-NUS Graduate Medical School, Singapore, Singapore, 3Singapore General Hospital, Singapore, Singapore, 4National Cancer Centre Singapore, Singapore, Singapore, 5MRI Institute for Biomedical Research, Bingham Farms, MI, United States, 6Wayne State University, Detroit, MI, United States
Synopsis
Parkinson's disease (PD) is characterised by dopaminergic neuronal loss and iron overload in the nigrostriatum. Diffusion Kurtosis Imaging (DKI) and Quantitative Susceptibility Mapping (QSM) allow quantification of alterations in tissue microstructure based on water diffusion and iron deposition respectively. Our case-control study in PD using DKI revealed greater cellular loss in the lateral SN and complex microstructural degradation in the putamen. QSM showed spatially variant iron deposition (Δχ) in the grey nuclei congruent with histochemical reports, and multivariate analysis showed that putaminal and lateral nigral Δχ significantly predicted UPDRS. Significant correlations between Δχ and DKI indices were found in the putamen.
Introduction
Parkinson's disease (PD) is marked by progressive dopaminergic neuronal loss in the substantia nigra (SN) paralleled by iron deposition, and dopaminergic deafferentation in the basal ganglia. Quantitative susceptibility mapping (QSM) enables superior quantification of iron deposition in the deep grey nuclei. Diffusion Kurtosis Imaging (DKI) is an extension of the diffusion technique which better accounts for non-Gaussian water diffusion and thence more sensitive to alterations in tissue microstructure. In this study, we investigated both QSM and DKI as complementary tools in characterizing pathological changes in the grey nuclei in PD and their clinical correlates.Methods
The study was approved by the institutional ethics committee. Newly diagnosed PD patients with diagnosis made within a year before recruitment by Movement Disorders specialists and sex-, age-matched healthy controls (HC) were recruited. All participants underwent clinical evaluation using the Unified Parkinson’s Disease Rating Scale (UPDRS), and brain MRI on a 3T scanner using standardized protocol, including multi-echo GRE (TR=53 ms, TE=7.5/14.8/20/26.4 ms, FA=15°, matrix=256x192, 2 mm slices) and DKI (SE-EPI with 63 diffusion-encoding directions, b-values=0/1000/2000 s/mm2,TR=10118 ms, TE=102 ms, matrix=122x122, 2.5 mm slices) sequences.
QSM post-processing was performed using SPIN (MR Innovations Inc., Detroit, USA) and DKI post-processing using Diffusion Kurtosis Estimator (Medical University of South Carolina, Charleston, USA). Regions of interest (ROIs) in the caudate, putamen, globus pallidus (GP), and medial and lateral SN were manually drawn by two independent raters to compare the mean susceptibility (Δχ) and DKI indices (mean, axial and radial diffusivity-MD, AD, RD; fractional anisotropy-FA; mean, axial and radial kurtosis-MK, AK, RK; kurtosis fractional anisotropy-KFA) between PD patients and HC. Statistical analyses were performed using R 3.4.2. Intra- and inter-rater reliability were assessed by Intraclass Correlation Coefficient (ICC). Student’s t-tests were carried out to compare differences of Δχ and DKI indices between PD patients and HC. Univariable linear regression models were performed between Δχ and DKI indices with clinical motor scores. Multivariable linear regression models were subsequently developed using metrics with p-value <0.1 from the univariate analysis.
Results
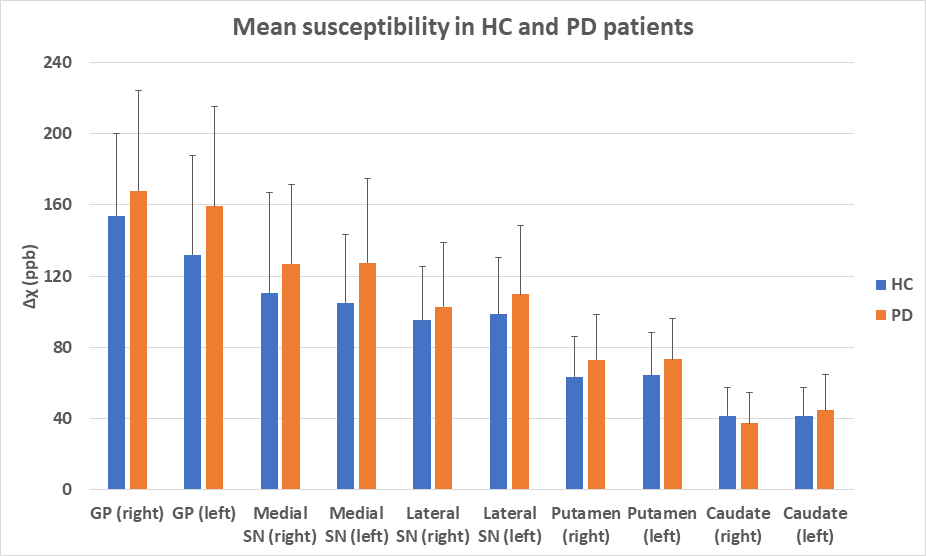
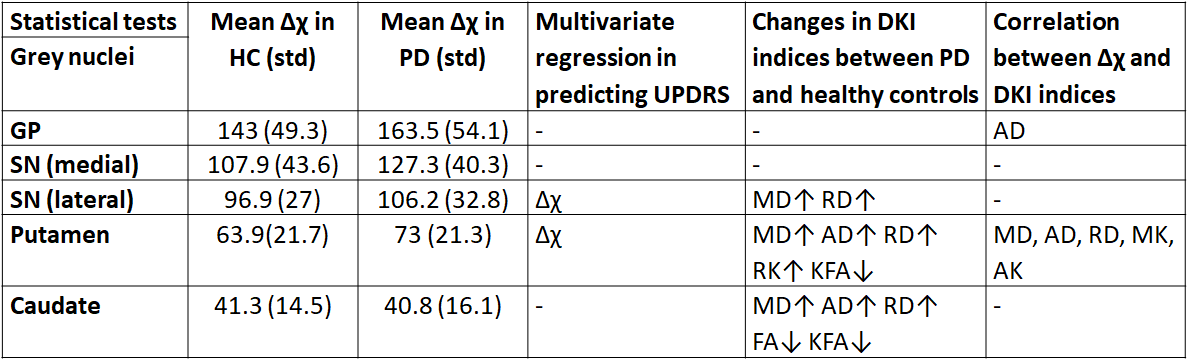
Forty-seven PD patients (M/F 23/24; mean age=64 years) and 16 HC (M/F 9/7; mean age=66.5 years) were included in this study. 53% of PD patients presented with dominant right-sided symptoms. The ICC were >0.7 for all ROIs. There was a gradient of Δχ in the gray nuclei (Figure 1), and Δχ tended to be higher in the SN, putamen and GP for PD patients compared to HC, although these were not statistically significant. Δχ was significantly higher (p<0.05) in the medial than lateral SN in PD patients but not in HC. Multivariate analysis showed that Δχ in the putamen and left lateral SN significantly predicted UPDRS (p<0.05) after adjusting for age and gender (Table 1).
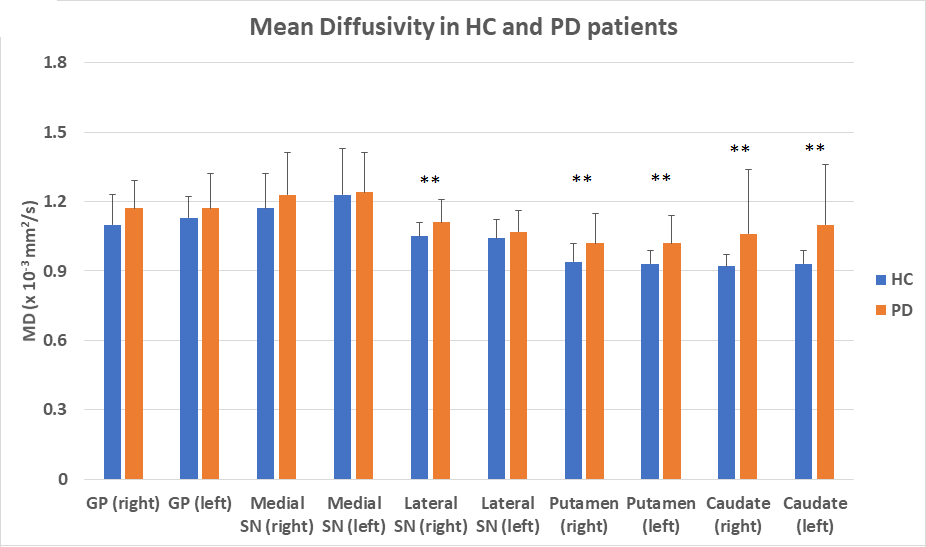
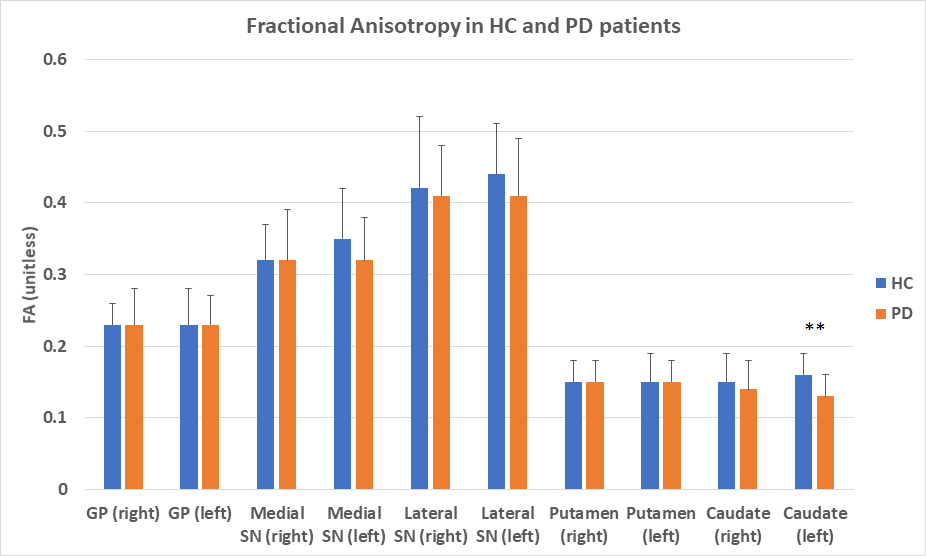
There were significant changes of DKI indices (e.g., Figures 2-3) in the lateral SN [increases in MD (p=0.02), RD (p=0.017)], putamen [increases in MD (p<0.001), AD (p=0.012), RD (p<0.001), RK (p=0.018) and decrease in KFA (p=0.042)] and caudate [increases in MD (p<0.001), AD (p<0.001), RD (p<0.001) and decrease in FA (p=0.036), KFA (p<0.001)] between PD patients and HC. Significant correlations (p<0.05) between Δχ and MD, AD, RD, MK and AK were found in the putamen.
Discussion
Iron deposition was spatially variant in the grey nuclei, being highest in the GP and lowest in the caudate (Figure 1). Our results corresponded with histochemical values in the literature.1 We found a trend of greater iron deposition in PD patients than HC, albeit not statistically significant, which could be attributed to the early stages of PD in our patient group. Nevertheless, changes in iron deposition in the lateral SN and putamen were sensitive enough to detect and predict the clinical motor scores.
Significant increases of MD and RD in PD patients suggest cellular loss and injury in the lateral SN compared to HC. Significant changes in various DKI indices suggest more complex microstructural degradation in the putamen and caudate in PD. The difference in correlation between iron deposition and DKI indices in the SN and putamen (Table 1) could be a result of the spatial differences in iron content in these areas (Figure 1). Increase of local magnetic susceptibility by iron may cause signal perturbation in diffusion-weighted images and artefactually alter diffusion indices in iron-rich grey nuclei such as GP and SN.2-3 A threshold iron content may exist beyond which diffusion indices would be confounded.
Conclusion
Our results suggest that QSM and DKI are complementary tools which should be used together for a better understanding of the complex interplay of iron deposition and microstructural changes in the pathophysiology of PD. Further longitudinal studies exploring these changes in disease progression could shed further light.Acknowledgements
We would like to thank National Medical Research Council, Singapore for their funding support and the excellent team of MR radiographers & physicists for their kind assistance & support in this study.References
1. Hallgren B, Sourander P. The effect of age on the non-haemin iron in the human brain. J Neurochem. 1958 Oct;3(1):41-51.
2. Rulseh AM, Keller J, Tintěra J, et al. Chasing shadows: what determines DTI metrics in gray matter regions? An in vitro and in vivo study. J Magn Reson Imaging. 2013;38(5):1103-10.
3. Gong NJ, Wong CS, Hui ES, et al. Hemisphere, gender and age-related effects on iron deposition in deep gray matter revealed by quantitative susceptibility mapping. NMR Biomed. 2015 Oct;28(10):1267-74.
Figures