2574
MRI Evidence for the Ascending Spread Hypothesis of Parkinson’s Disease1Radiology and Medical Imaging, University of Virginia, Charlottesville, VA, United States, 2Neurology, University of Virginia, Charlottesville, VA, United States, 3Public Health Services, University of Virginia, Charlottesville, VA, United States
Synopsis
Ascending spread models of Parkinson’s disease neurodegeneration remain controversial despite being the dominant model of disease progression in the literature. This study conducted an in vivo evaluation of the ascending spread hypothesis for PD in early and late-stage Parkinson’s disease using measurements of regional grey matter density (GMD) obtained from T1-weighted MRI. Results of this study provide in vivo evidence that regions implicated in stages three and four of the ascending spread model are degenerating ahead of regions implicated in stages five and six. These results further support the proposed ascending pattern of pathological spread in PD.
Introduction
The “Braak hypothesis” proposes that spread of Lewy Body pathology in Parkinson’s disease occurs in an organized, ascending manner, progressing from deep brain structures in early disease stages to neocortex in later stages.1 Ascending spread models of Parkinson’s disease (PD) neurodegeneration remain controversial despite being the dominant model of disease progression in the literature. Evidence for the Braak hypothesis comes primarily from histopathologic evaluation in postmortem brains with relatively little supporting evidence from in vivo human data.2 This study conducts an in vivo evaluation of the Braak hypothesis in early- and late-stage Parkinson’s disease using a combination of: 1) MRI-based measures of grey matter density and 2) histopathologically defined regions of interest corresponding to cortical and subcortical loci implicated by Braak.Methods
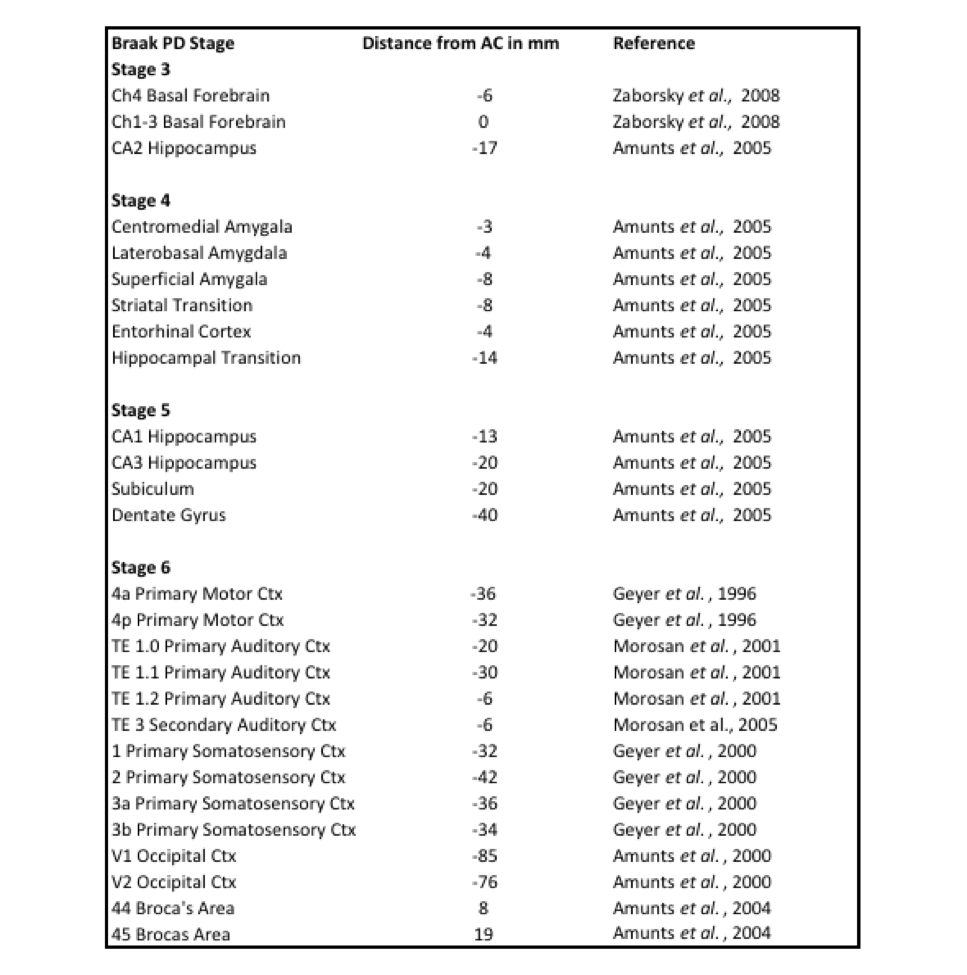
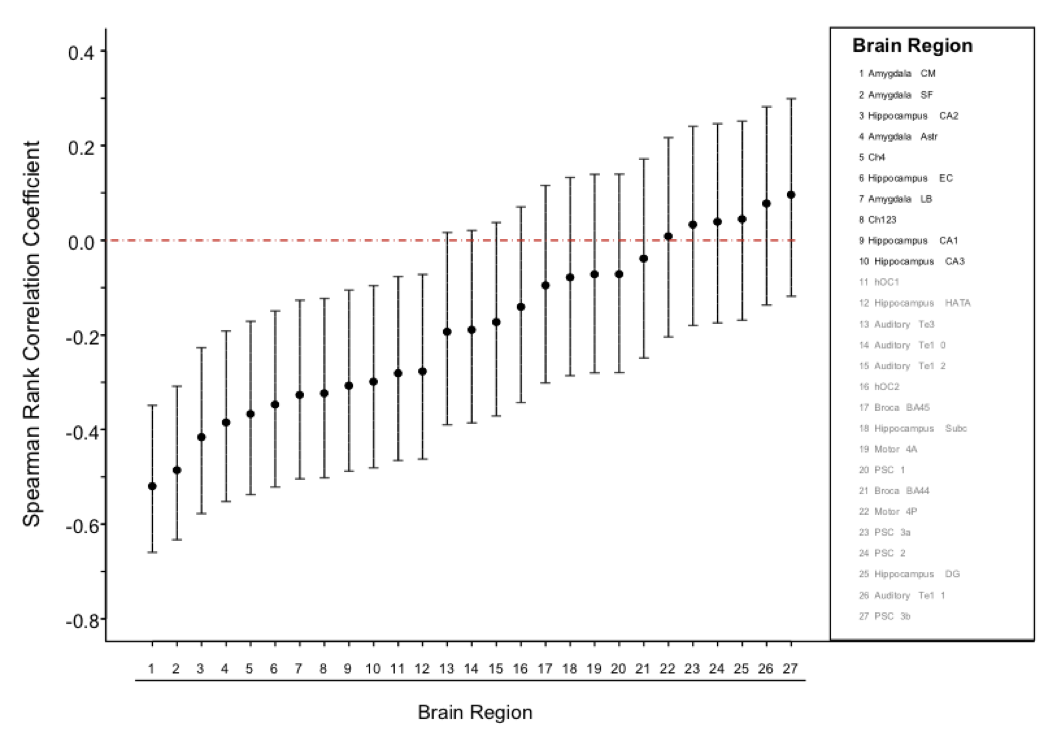
This study evaluated data collected retrospectively from two sources: 228 newly diagnosed PD subjects (M=0.6 years disease duration) and 103 age matched healthy controls from the Parkinson’s Progression Markers Initiative (PPMI),3 and 136 advanced PD subjects (M=8.0 years disease duration) from the University of Virginia. Additionally, this study evaluated longitudinal data collected over a period of 4 years from 92 PD subjects from the PPMI. MRI data from all subjects was acquired with the 3D MP-RAGE T1 weighted sequence on 3-tesla Siemens MRI scanners. Voxel-based morphometry methods4-6 were applied to all images within the CAT12 MATLAB toolbox (http://dbm.neuro.uni-jena.de/cat/) using an enhanced tissue probability map7 for optimum contrast for subcortical areas. Region specific grey-matter density (GMD) was obtained from the processed images according to probabilistic maps derived from 3D reconstruction of histological sections from post mortem brains.8 Regions of interest (Table 1) were selected according to anatomical descriptions of PD stages within the Braak staging model. Statistical tests evaluated between-group differences in GMD, the relationship between GMD and disease duration, and the rate at which regional GMD declines over time.Results
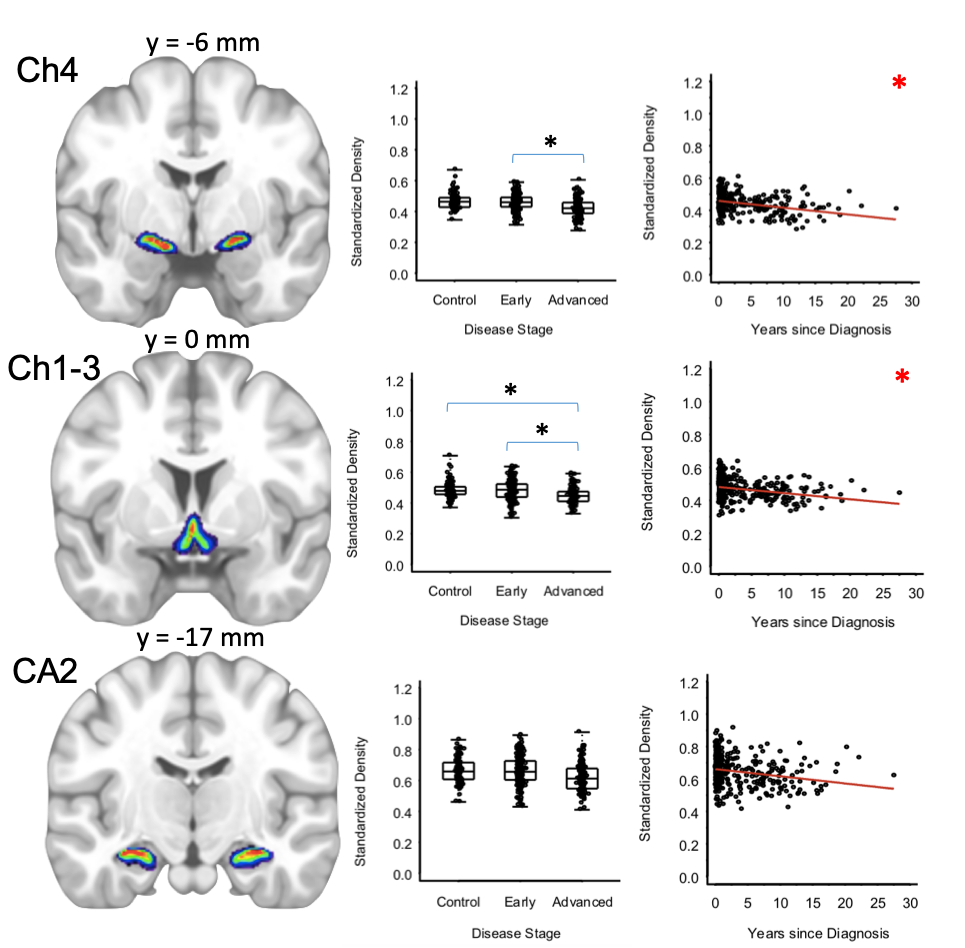
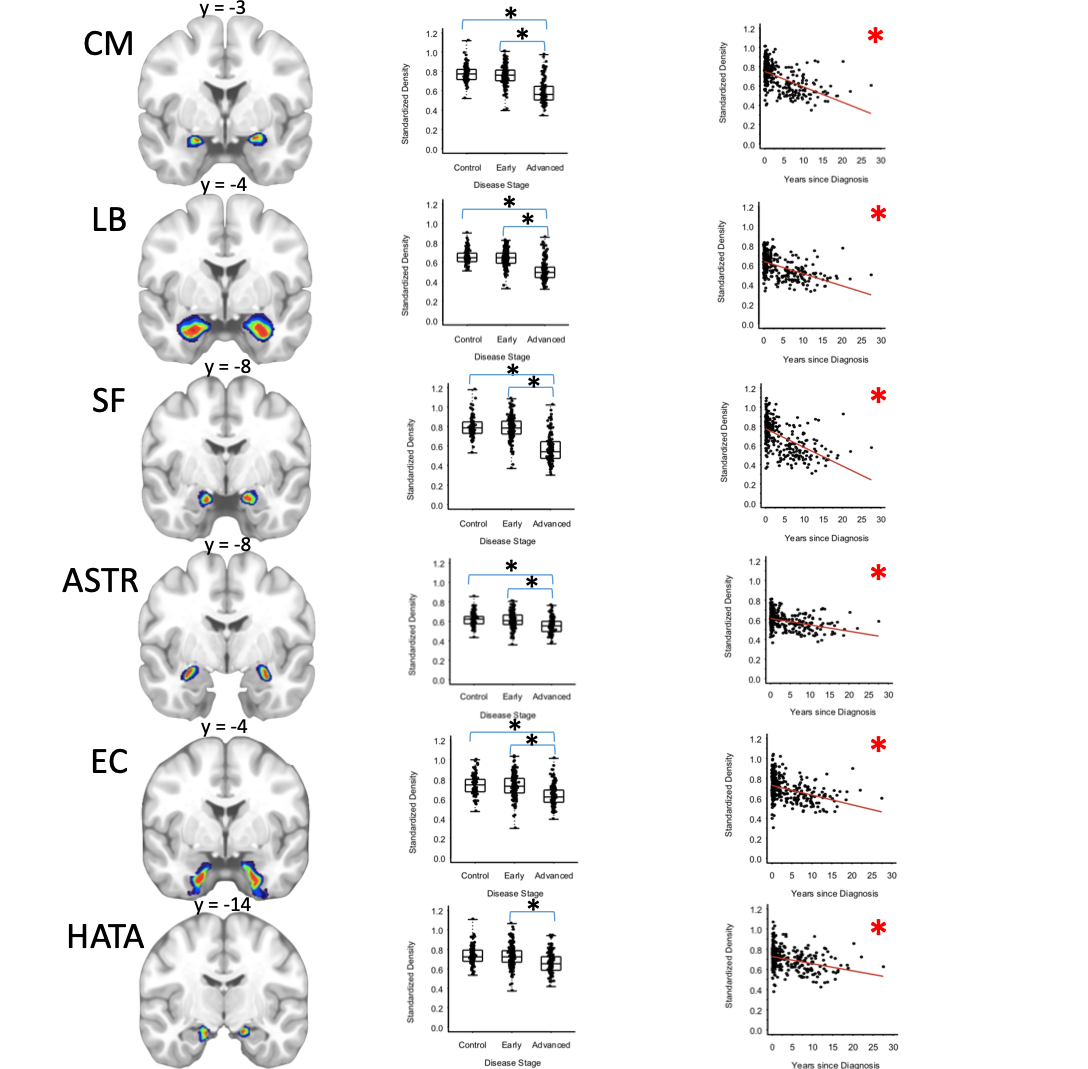
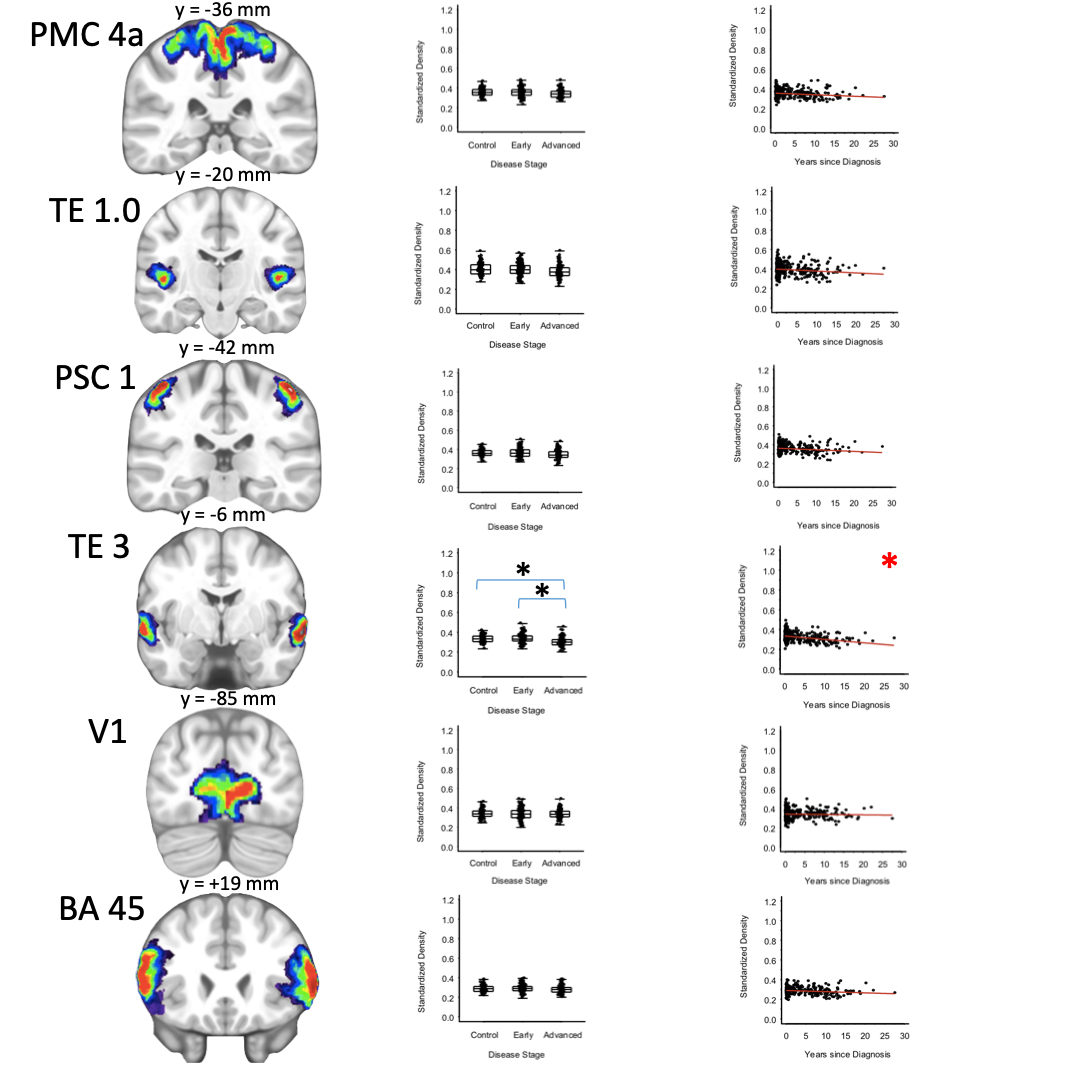
For the 13 subcortical regions associated with “early-stage” PD, it was found that GMD was significantly lower for advanced PD than early PD or healthy controls for regions of the basal forebrain, amygdala, entorhinal cortex, and hippocampal-amygdala transition area. These same early-stage regions were also significantly associated with disease duration (Figures 1-3). For the 14 cortical regions associated with “late-stage” PD, GMD was found to be lower for advanced PD than for early PD or healthy controls in the TE3 of the secondary auditory area, but not for any other cortical region tested. The TE3, but no other cortical area, was associated with disease duration. GMD for early PD subjects and healthy controls was not significantly different for any region tested. In the longitudinal PD cohort, reductions in GMD over time were significant only for early-stage PD regions, but not for late-stage PD regions. GMD loss was localized to the basal forebrain, amygdala, and cornu Ammonis of the hippocampus (Figure 4). None of the 14 cortical regions measured displayed reductions in GMD.Discussion
Results of this study provide in vivo evidence that subcortical regions implicated in earlier stages of the Braak model are degenerating ahead of cortical regions implicated in later stages. These results further support the proposed ascending pattern of pathological spread in PD. The advanced PD group evaluated in this study showed extensive atrophy of the basal forebrain and amygdala, but showed limited atrophy in the hippocampus and neocortex, regions which are known to be associated with cognitive impairment in PD.9,10 These findings place this advanced PD group at the threshold of late stage disease, where pathology has either not spread to meso or neo-cortical areas, or has not yet resulted in measurable neurodegeneration. Though the Braak model proposes extensive pathological development in PD patients at baseline, the finding that early PD is not different from healthy controls fits within a literature that has failed to consistently detect atrophy in MRI studies of early PD.11,12 Longitudinal findings from this study support the cross-sectional findings by showing that early stage regions decline at a faster rate than late stage regions over a 4 year period. As this study sought to use only histologically defined brain maps, it was limited by the inability to measure brain regions from stage one and two of the Braak model, or additional subcortical regions implicated in early stage PD. Future study of these groups will utilize additional probabilistic maps to confirm and enhance these findings.Acknowledgements
Data used in the preparation of this article were obtained from the Parkinson’s Progression Markers Initiative (PPMI) database (www.ppmi-info.org/data). For up-to-date information on the study, visit www.ppmi-info.org. PPMI – a public-private partnership – is funded by the Michael J. Fox Foundation for Parkinson’s Research and funding partners, including [list of PPMI funding partners available at www.ppmi-info.org/fundingpartners].References
1. Braak H, Braak E. Pathoanatomy of Parkinson’s disease. Journal of Neurology 2000; 247: 3-10.
2. Braak H, Del Tredici K, Rüb U, de Vos RA, Jansen Steur EN, Braak E. Staging of brain pathology related to sporadic parkinson's disease. Neurobiology of Aging 2003; 24(2): 197-211.
3. Marek K, Jennings D, Lasch S, Siderowf A, Tanner C, Simuni T, et al. The parkinsons progression marker initiative (PPMI). Progress in Neurobiology 2011; 95: 629-35.
4. Ashburner J. A fast diffeomorphic image registration algorithm. Neuroimage 2007; 38: 95-113.
5. Ashburner J, Friston KJ. Voxel-based morphometry--the methods. NeuroImage 2000; 11: 805-21.
6. Ashburner J, Friston K J. Unified segmentation. NeuroImage 2005; 26, 839-51.
7. Lorio S, Fresard S, Adaszewski S, Kherif F, Chowdhury R, Frackowiak RS., et al. New tissue priors for improved automated classification of subcortical brain structures on MRI. Neuroimage 2016; 130: 157-166
8. Eickhoff S, Stephan KE, Mohlberg H, Grefkes C, Fink GR, Amunts K, Zilles K. A new SPM toolbox for combining probabilistic cytoarchitectonic maps and functional imaging data. NeuroImage 2005; 25: 1325-1335.
9. Beyer MK, Janvin CC, Larsen JP, Aarsland D. A magnetic resonance imaging study of patients with Parkinson’s disease with mild cognitive impairment and dementia using voxel-based morphometry. Journal of Neurosurgery Neurology and Psychiatry 2007; 78:254-59.
10. Weintraub D, Dietz N, Duda J, Wolk D, Doshi J, Xie S, et al. Alzheimer’s disease pattern of brain atrophy predicts cognitive decline in Parkinson’s disease. Brain 2012; 135: 170-80.
11. Longoni G, Agosta F, Kostic V, Stojkovic T, Pagani E. Stosic-Opincal T, et al. MRI measurements of brainstem structures in patients with Richardson’s syndrome, progressive supranuclear palsy-parkinsonism, and Parkinson’s disease. Movement Disorders 2001; 26: 247–255.
12. Pyatigorskaya, N Gallea C, Garcia-Lorenzo D, Vidailhet M, Lehericy S. A review of the use of magnetic resonance imaging in Parkinson’s disease. Therapeutic Advances in Neurological Disorders 2014; 7: 206-220.
Figures