2573
Intra-Voxel Incoherent Motion imaging as a potential marker of parenchymal glymphatic flow1Radiology, University of Washington Medical Center, Seattle, WA, United States, 2Northwest Network Mental Illness Research, Education, and Clinical Center, VA Puget Sound, Seattle, WA, United States, 3Psychiatry and Behavioral Sciences, University of Washington Medical Center, Seattle, WA, United States
Synopsis
We tested the applicability of IVIM to detect increased glymphatic flow using the pseudo-diffusion coefficient (D*). Using known effects of prazosin, to increase interstitial fluid volume and glymphatic flow, we showed that D* increased significantly in 6 individuals before and 9-12 weeks after prazosin. This increase was greater than conventional diffusion. It was also larger than the inter-scan variability of D*, measured in 3 individuals 10 weeks apart.
INTRODUCTION
The glymphatic system (GLS) has been identified as the circulatory system of the brain that clears toxic solutes. It is comprised of cerebrospinal fluid (CSF) flow along the subarachnoid and periventricular spaces, through the parenchyma (interstitial fluid [ISF]/bulk flow), along the spinal nerves, and into the nasal lymphatics, and dural sinuses1. Current imaging approaches2 visualize the glymphatic flow using intrathecal contrast injections which take > 20 hours of scanning and are generally not recommended for human imaging. We propose the use of Intra-Voxel Incoherent Motion (IVIM)3 to measure bulk flow as a marker of the parenchymal component of the GLS, which can also be applied in a practical setting. In the absence of a gold standard, we leveraged the validated effect of prazosin, an α1-adrenergic antagonist to significantly increase ISF volume and GLS flow.METHODS
Eight adults (5F, 47-75 years old) were consented per institutional protocols and scanned before administration of prazosin and after 9-12 weeks of titrated prazosin administration. To date, 6 subjects have completed both time points. Acquisition. IVIM parameters were: 6 directions + b0, 12 b-values (10, 20, 40, 80, 110, 140, 170, 200, 300, 500, 800, and 1000 s/mm2), resolution = 1×1×5 mm3, 30 slices, TR/TE =3000/62 ms. Processing. Conventional Diffusion, D, was calculated using the standard mono-exponential decay rate for the high b-values (500, 800, and 1000 s/mm2). Then capillary volume f and pseudo-diffusion coefficient, D* were derived in MATLAB 2016a using the equation: 𝑆 = 𝑆0[𝑓𝑒-bD*+ (1 − 𝑓)e-bD], where S0 = signal intensity of the b0 image. The parameter maps before and after prazosin administration were then co-registered and D, D*, and f were compared using a whole-brain region of interest. IVIM was performed twice within the same session to obtain intra-scan variability in 4 other individuals. Inter-scan variability was evaluated in 3 of these 4 individuals, scanned 10 weeks apart.RESULTS
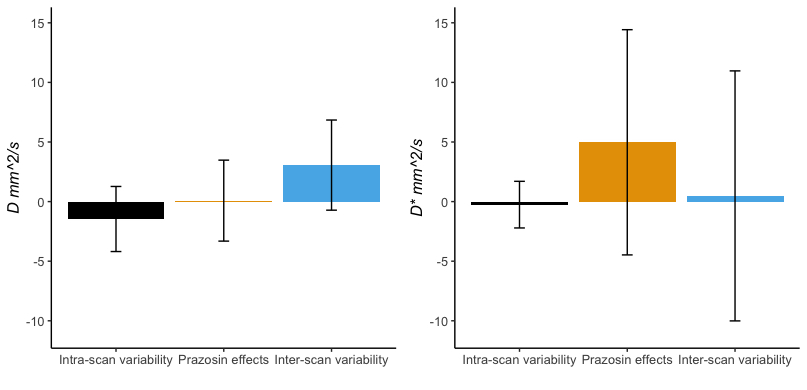
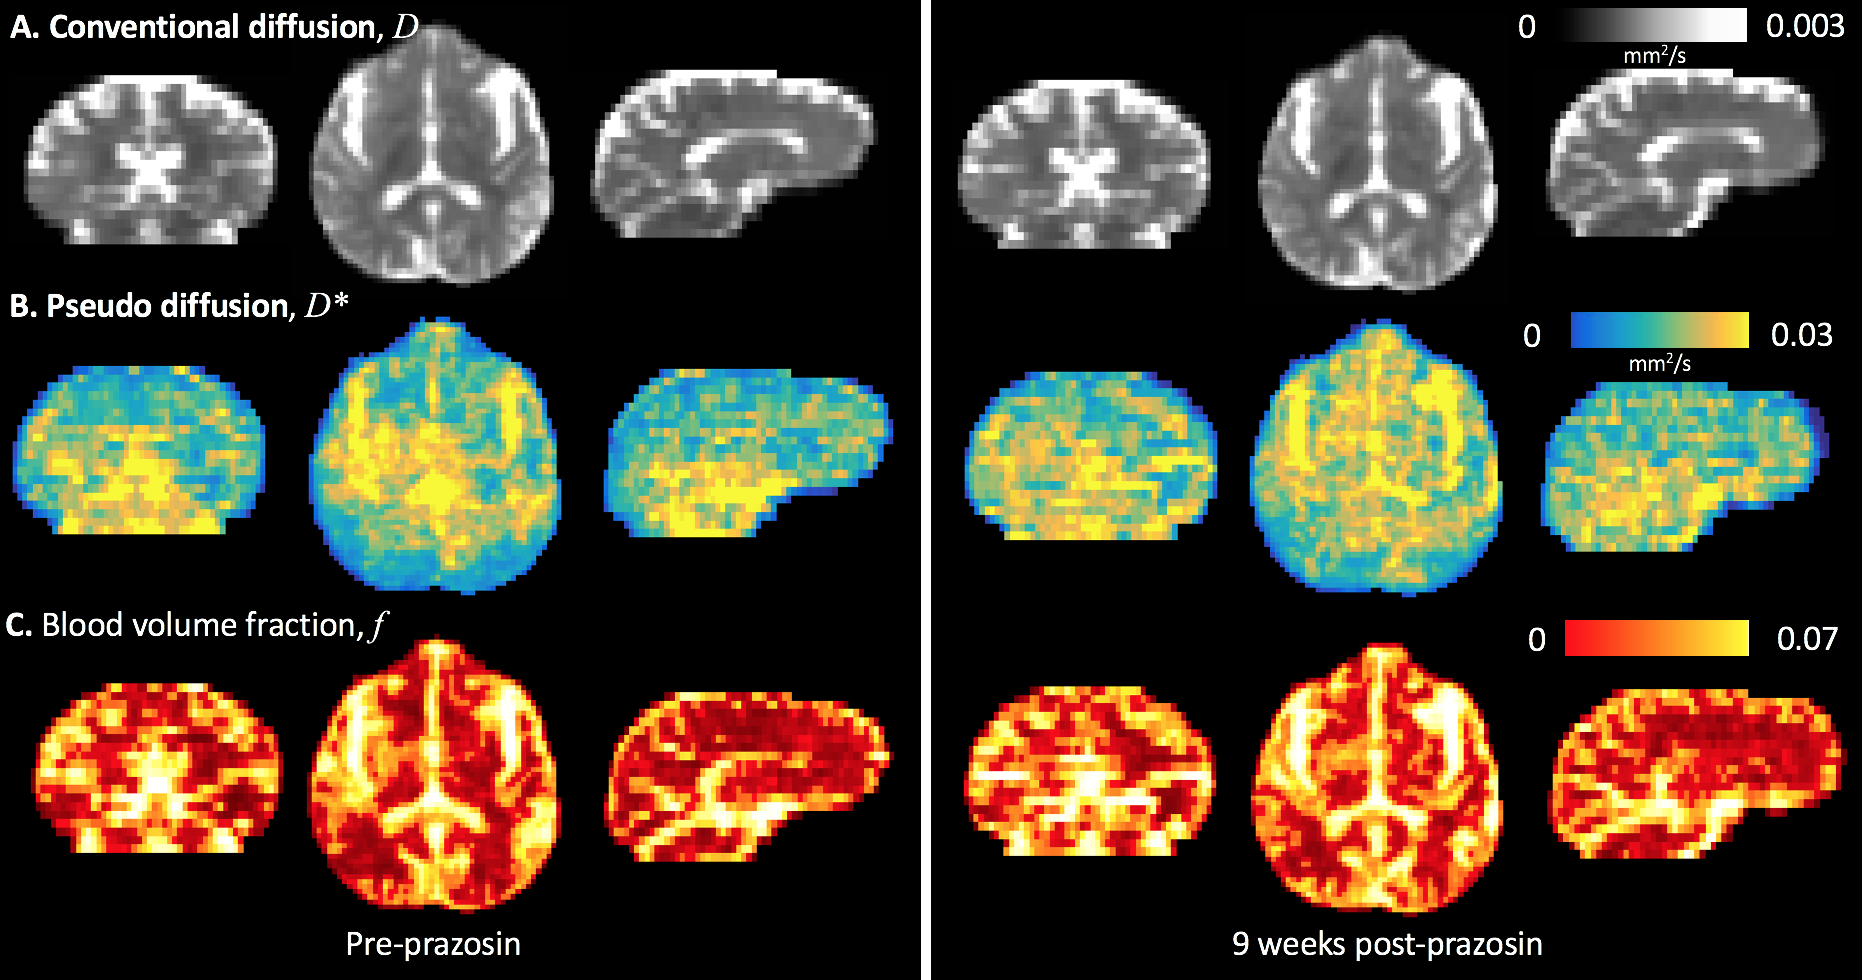
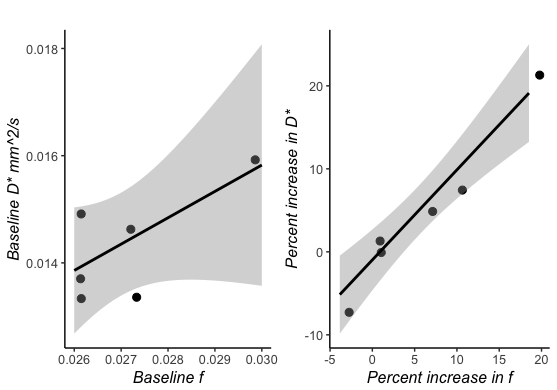
The average change in D* was 4.97±9.44% while average change in typical diffusion, D, was 0.08±3.39% in 6 individuals with prazosin treatment (yellow, Figure 1). This change in D* was >> intra-scan variability of D* (black, -0.25±1.95%) and >> inter-scan variability of D* (blue, 0.47±10.8%). Corresponding changes in D were 0.08±3.39% with prazosin, -1.46±2.72% within a scan session, and 3.06±3.78% between scan sessions. With prazosin, f changed by 5.44±8.47%, by -0.66±5.97% within a scan session, and by 2.63±5.90% between scan sessions. Figure 2 shows pre and post prazosin scans in one individual. D changed minimally following treatment with prazosin. D* showed high values (16.0 x10⁻³ mm2/s) near CSF spaces surrounding larger arteries (paravascular spaces) in the pre-prazosin scan. Following prazosin treatment for 9-12 weeks, there were higher values of D* in the parenchyma in addition to the large paravascular CSF spaces (16.9 x10⁻³ mm2/s, percent increase in D*, 100×ΔD*/D* = 5.6). Note that D represents slow diffusion but fast transport over short distances, and D* represents fast diffusion but slow transport over long distances. Both f and D* showed greater changes than D. Observing the similar behavior of f and D* post prazosin, we evaluated Spearman's correlation (ρ) between them at baseline for all 6 participants. We also evaluated how change in f (Δf/f) was correlated with change in D* (ΔD*/D*). Baseline correlation was 0.39 (p = 0.47, Figure 3). Interestingly, ρ for Δf/f to ΔD*/D* was 0.96 (p = 0.005).DISCUSSION
Leveraging known effects of prazosin to increase ISF volume and GLS flow, we show that IVIM is a potential marker to detect the increase in parenchymal ISF flow. While the exact physiological basis is unclear, D* is known to have contributions from perfusion, as well as ISF and CSF flow. The latter are believed to comprise the GLS flow. At baseline, a weak correlation was observed between f and D*. However, Δf/f was strongly correlated with ΔD*/D*, which suggests a possible mechanistic coupling of the vascular system to GLS when using prazosin. Indeed, aquaporin water channels (AQP4)1 allow glymphatic flow from the perivascular and parvascular spaces into the interstitium. Particularly, syntrophins4 are scaffolds for many proteins including AQP4 and neuronal nitric oxide synthase, and can be modulated by prazosin. Stroke studies show localized impairment in glymphatic clearance following focal ischemic events5. Cardiac arrests immediately cease perivascular solute transport, providing further evidence of a vascular component as a driver of GLS flow6.CONCLUSION
We explored the applicability of IVIM as a marker of GLS flow using prazosin to indirectly validate our measurements. Future work will involve validation using contrast-based, invasive, gold-standard markers of GLS as well as testing advanced models for evaluation of D*.Acknowledgements
No acknowledgement found.References
1. Iliff, J.J., Wang, M., Liao, Y., Plogg, B.A., Peng, W., Gundersen, G.A., Benveniste, H., Vates, G.E., Deane, R., Goldman, S.A. and Nagelhus, E.A., 2012. A paravascular pathway facilitates CSF flow through the brain parenchyma and the clearance of interstitial solutes, including amyloid β. Science translational medicine, 4(147), pp.147ra111-147ra111.
2. Eide PK, Ringstad G. MRI with intrathecal MRI gadolinium contrast medium administration: a possible method to assess glymphatic function in human brain. Acta Radiologica Short Reports. 2015 Nov 17;4(11):2058460115609635.
3. Le Bihan D, Breton E, Lallemand D, Grenier P, Cabanis E, Laval-Jeantet M. MR imaging of intravoxel incoherent motions: application to diffusion and perfusion in neurologic disorders. Radiology. 1986 Nov;161(2):401-7.
4. Lyssand JS, DeFino MC, Tang XB, Hertz AL, Feller DB, Wacker JL, Adams ME, Hague C. Blood pressure is regulated by an α1D-adrenergic receptor/dystrophin signalosome. Journal of Biological Chemistry. 2008 May 9.
5. Carare RO, Bernardes‐Silva M, Newman TA, Page AM, Nicoll JA, Perry VH, Weller RO. Solutes, but not cells, drain from the brain parenchyma along basement membranes of capillaries and arteries: significance for cerebral amyloid angiopathy and neuroimmunology. Neuropathology and applied neurobiology. 2008 Apr;34(2):131-44.
6. Bakker EN, Bacskai BJ, Arbel-Ornath M, Aldea R, Bedussi B, Morris AW, Weller RO, Carare RO. Lymphatic clearance of the brain: perivascular, paravascular and significance for neurodegenerative diseases. Cellular and molecular neurobiology. 2016 Mar 1;36(2):181-94.
Figures