2571
Quantitative Measurement of Glymphatic Flow in Man with Contrast-Enhanced MRI1Radiology, Lenox Hill Hospital, New York, NY, United States, 2Donald and Barbara Zucker School of Medicine at Hofstra/Northwell, New York, NY, United States, 3Department of Civil and Environmental Engineering, University of Vermont, Burlington, VT, United States, 4Department of Psychology, Yale University, New Haven, CT, United States, 5Department Radiology, University of Vermont, Burlington, VT, United States
Synopsis
Impairment in glial lymphatic "glymphatic" flow is hypothesized to be an etiologic factor in the development of Alzheimer’s disease (AD). We report a quantitative study of glymphatic flow in man, combining intrathecal administration of gadobutrol (macrocylic gadolinium-based contrast agent) with serial T1-mapping to produce contrast concentration maps up to 3 days post-injection. This demonstrates proof-of-concept feasibility and offers data on the pharmacokinetics of glymhatic flow.
INTRODUCTION
Protein aggregation is the pathologic signature of many neurodegenerative diseases. The recently discovered glial lymphatic (“glymphatic ) system may play a critical role in protein removal including soluble amyloid-β1 and HPF-tau2. This perivascular glymphatic pathway drives exchange between CSF and interstitial fluid, and its dysfunction may be a causal factor in the development of Alzheimer’s disease3. Qualitative MRI using percentage signal enhancement on T1-weighted images has previously been reported in animal models and humans4, with a single study reporting quantitative MRI in a rat model at 9.4T5. Here we employ the combination of an intrathecal administration of a macrocylic gadolinium-based contrast agent (gadobutrol) with quantitative T1-mapping at 3T to quantify contrast concentration vs. time. This allows quantitative measurements of glympathic flow throughout the brain in a human volunteer.METHODS
Patient History: A 55-year old male normal volunteer (no disc herniation or central canal stenosis) with no significant past medical history was recruited for this HIPAA-compliant, IRB-approved study using an intrathecal injection of 0.5cc of 1.0mmol gadobutrol.
Data Acquisition: Quantitative T1-mapping data was acquired on a 3T Philips Achieva TX MRI scanner with 8-channel head coil using a multiple flip angle 3D spoiled gradient echo sequence with TE/TE=2.8ms/20ms, flip angles of 2°/5°/10°/20°/40°, field of view 240×228×120 mm3, and acquired resolution of 1.2×1.2×1.2 mm3. Acquisition time was 3 min 47 seconds for each flip angle using a SENSE factor of 2. Scans were acquired at baseline and at eight further times during the first ten hours, followed by acquisitions at 26 hours, 50 hours and 79 hours.
Data Analysis - Theory: The method is based on the NMR steady-state signal equation, transformed to a linear form, from which the tissue T1 can be determined6. The T1-value can be directly related to the contrast agent concentration based on the intrinsic T1-value of the tissue (T10, measured pre-contrast) and the relaxivity of the contrast agent, assumed to be 5.1 l/mmol/s for gadobutrol.
Data Processing: Each volume was coregistered to the 20° flip angle acquisition from the first scan acquired prior to contrast injection using SPM12. T1 maps were generated using least squares fitting to the signal equation using custom Matlab (Mathworks) scripts. The pre-contrast map provided baseline T1 values (T10), enabling contrast concentration to be calculated at each subsequent time. Brain segmentation of cortical gray matter, juxtacortical white matter, and CSF was performed using SPM12 on the 20° flip angle acquisition.
RESULTS
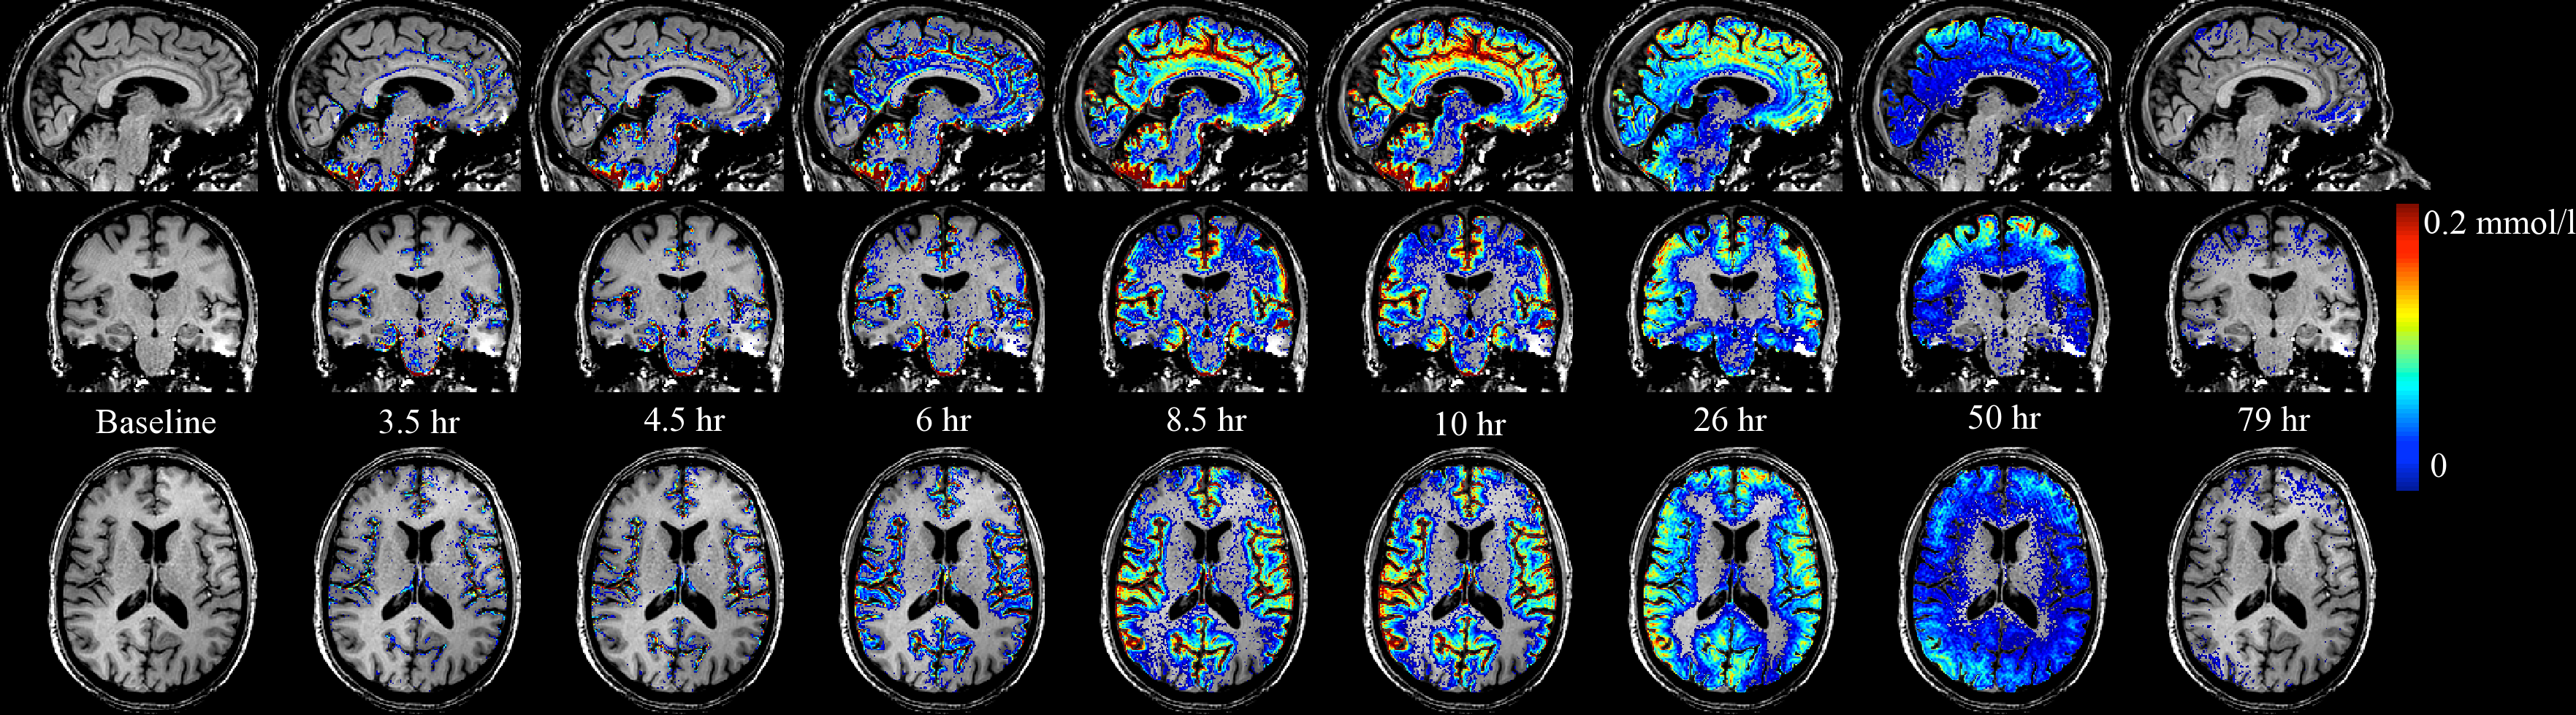
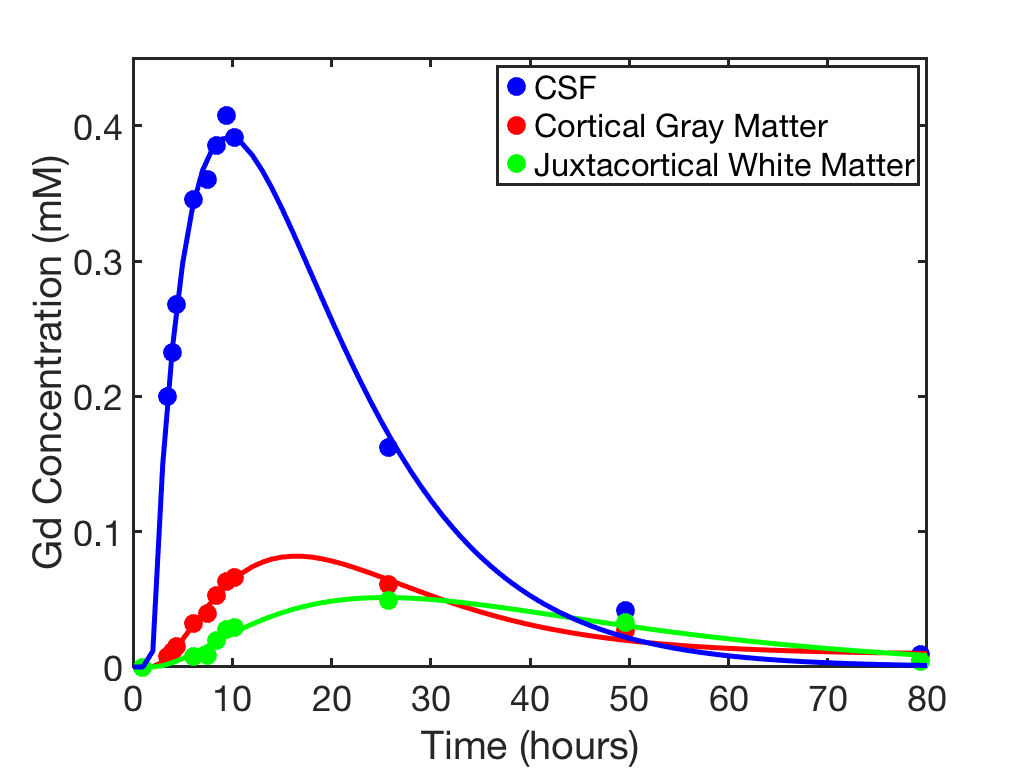
The time-course of tissue contrast concentration over 79 hours post-injection is shown in Figure 1. Contrast was observed in the Cisterna Magna at 3 hours and within the entire subarachnoid space at 8 hours. Concentration in the subarachnoid spaces peaked between 10- and 15-hours at approximately 0.5mmol/l. Cortical enhancement was measurable from 4 hours and peaked between 10 and 26 hours, with maximum concentration of approximately 0.1 mmol/l. The largest concentrations were seen in the temporal lobes and insula in the first 10 hours. Cortical contrast remained at 50 hours with near complete clearance at 79 hours. Concentration-time curves were calculated for cortical gray matter and juxtacortical white matter (Figure 2). The biological half-life of gadabutrol in the subarachnoid CSF, based on the washout curve, was approximately 12 hours. A two-compartment model provided a good fit to cortical contrast concentration curve.DISCUSSION
Literature on glymphatic flow is based primarily on rodent models using highly invasive techniques. Glymphatic flow in humans has been investigated qualitatively5,9. This report is novel by quantifying contrast concentration, uptake and clearance. These are much slower in our subject compared to animal models, but faster than would be expected due to only passive diffusion. Only a single individual was imaged, but acquiring serial quantitative data at multiple time points over three days represents a unique data set. The cost and inconvenience to exactly replicate this approach is prohibitive, but these results suggest abbreviated protocols may suffice. Regarding gadolinium retention, studies on long-term follow-up after intrathecal contrast injection have not identified adverse effects7,8. Gadolinium-retention after intrathecal administration was not observed previously for gadobutrol at the dosage used in the current study9.CONCLUSION
It is feasible to perform T1-mapping to determine contrast concentration to quantitatively analyze glymphatic flow in man. There is increasing interest in its potential use as an imaging marker and potential therapeutic target in AD.Acknowledgements
This study was funded by the Foundation of the American Society for Neuroradiology Berger Fund.References
1. Hawkes CA, Sullivan PM, Hands S, et al. Disruption of arterial perivascular drainage of amyloid-beta from the brains of mice expressing the human APOE epsilon4 allele. PloS one 2012;7:e41636
2. Iliff JJ, Chen MJ, Plog BA, et al. Impairment of glymphatic pathway function promotes tau pathology after traumatic brain injury. The Journal of neuroscience : the official journal of the Society for Neuroscience 2014;34:16180-16193
3. Bakker EN, Bacskai BJ, Arbel-Ornath M, et al. Lymphatic Clearance of the Brain: Perivascular, Paravascular and Significance for Neurodegenerative Diseases. Cellular and molecular neurobiology 2016
4. Eide PK, Ringstad G. MRI with intrathecal MRI gadolinium contrast medium administration: a possible method to assess glymphatic function in human brain. Acta radiologica open 2015;4:2058460115609635
5. Lee H, Mortensen K, Sanggaard S, Koch P, Brunner H, Quistorff B, Nedergaard M, Benveniste H. Quantitative Gd-DOTA uptake from cerebrospinal fluid into rat brain using 3D VFA-SPGR at 9.4T. Magnetic resonance in medicine : official journal of the Society of Magnetic Resonance in Medicine / Society of Magnetic Resonance in Medicine. 2018;79(3):1568-78. doi: 10.1002/mrm.26779. PubMed PMID: 28627037; PubMed Central PMCID: PMCPMC5736474.
6. Cheng HL, Wright GA. Rapid high-resolution T(1) mapping by variable flip angles: accurate and precise measurements in the presence of radiofrequency field inhomogeneity. Magnetic resonance in medicine : official journal of the Society of Magnetic Resonance in Medicine / Society of Magnetic Resonance in Medicine 2006;55:566-574
7. Safriel Y, Ang R, Ali M. Gadolinium use in spine pain management procedures for patients with contrast allergies: results in 527 procedures. Cardiovasc Intervent Radiol 2008;31:325-331
8. Nacar Dogan S, Kizilkilic O, Kocak B, et al. Intrathecal gadolinium-enhanced MR cisternography in patients with otorhinorrhea: 10-year experience of a tertiary referral center. Neuroradiology 2018;60:471-477
9. Ringstad G, Valnes LM, Dale AM, et al. Brain-wide glymphatic enhancement and clearance in humans assessed with MRI. JCI Insight 2018;3
Figures