2569
Imaging Cerebellum Venous Oxygenation: a T2-based approach1Research Imaging Institute, University of Texas Health at San Antonio, San Antonio, TX, United States, 2Johns Hopkins University, Baltimore, MD, United States
Synopsis
Cerebellum has been used for normalization in fMRI and blood flow studies, and yet little for its oxygen metabolism. This abstract aims to explore T2-Relaxation-Under-Phase-Contrast (TRUPC) MRI to reliably image cerebellar venous oxygenation. We try to explore the regional small vein Yv and it adjacent sinus signals.
PURPOSE
Cerebellum has been known with abundant blood flow, and yet little for its oxygenation properties. Previous studies have been using cerebellum as a “normal reference” for blood flow and oxygen extraction fraction, even in diseases.[1]
The aim of this study is to develop a reliable protocol to image cerebellar venous oxygenation with T2-Relaxation-Under-Phase-Contrast (TRUPC) MRI. Phase contrast and TRUPC MRI will be performed to locate cerebellar vermian veins flowing into the straight sinus, and estimate vein T2. The vein oxygenation (Yv) will be estimated via eddy current corrected T2 map and compared between the small vein and adjacent large sinus. Reliability of the cerebellar vein T2 measurement will be also tested.
METHODS
Young healthy subjects (n=4, age 27±1.9, 2M2F) were asked to avoid taking coffee. tea, and alcohol and be scanned in the afternoon. MRI was performed at 3T with 12 channel receive-only head coil. T1w anatomical scans were made using MPRAGE with FOV=200 x 200mm with isotropic 1mm resolution. Two 3D Phase contrast with sagittal and transversal orientation were applied to explore the posterior cerebellum vein structure, with a acquisition matrix 256x256x30 , FOV 200x200x60mm, PE=AP, sagittal VENC = 5cm/s for sagittal orientation, in-plane VENC = 5 cm/s for transversal orientation. 2 sets of TRUPC scan( 0, 4,8 eTEs) were then made with acquisition matrix 272x164, FOV 220x200mm, single 5mm slice, reconstruction matrix 272x272, sagittal VENC = 2cm/s for male and 5cm/s for female, τCPMG=10ms, 2 minute break between sessions. Eddy current correction was performed on complex data as described[2]. T2 was fitted pixel-wise using the non-linear least square method, with error calculated. Mean Yv in cerebellum and adjacent straight sinus area was calculated by ROIs from a vascular mask generated from complex difference images in each TRUPC scan. Yv was calculated from T2 using a calibrated equation.[3] The coefficient of variation was used to determine intersession reproducibility of cerebellum vein TRUPC. The relation between cerebellum Yv and adjacent straight sinus was compared by the linear correlation coefficient.RESULTS
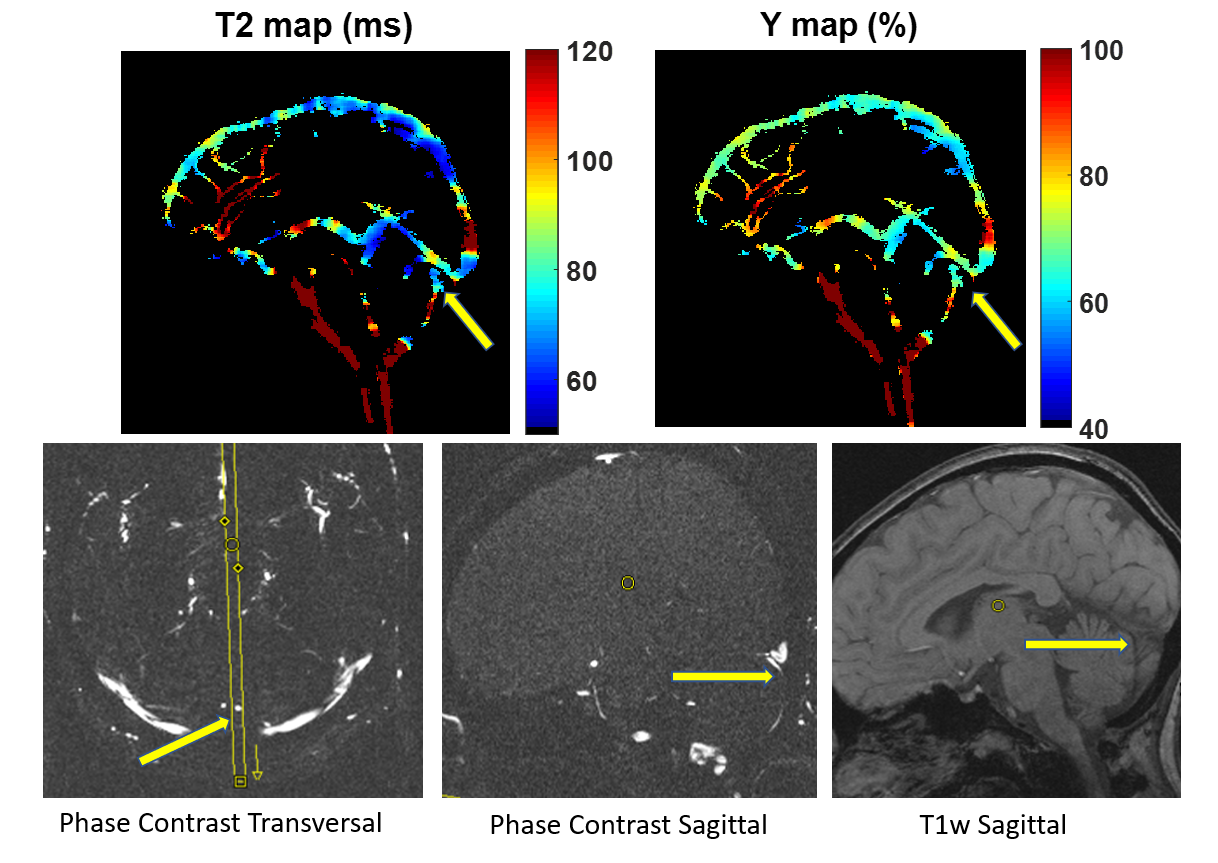
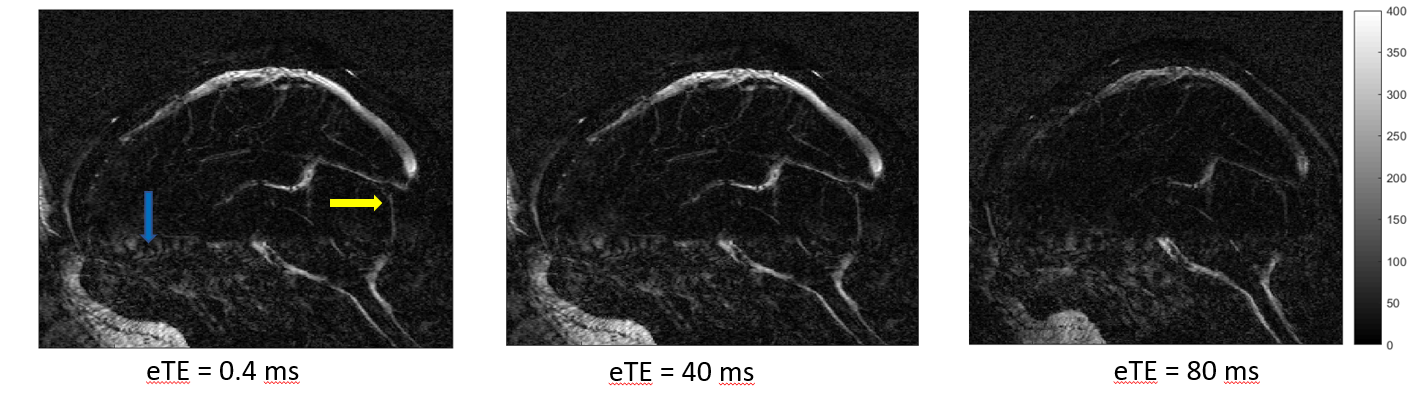
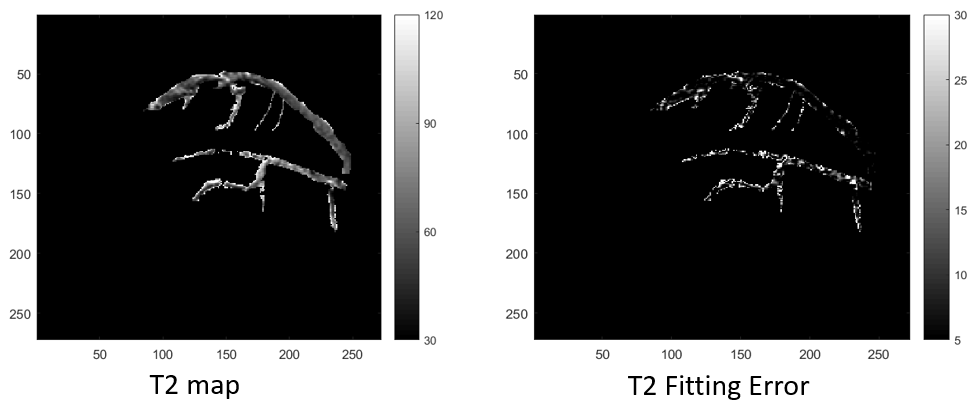
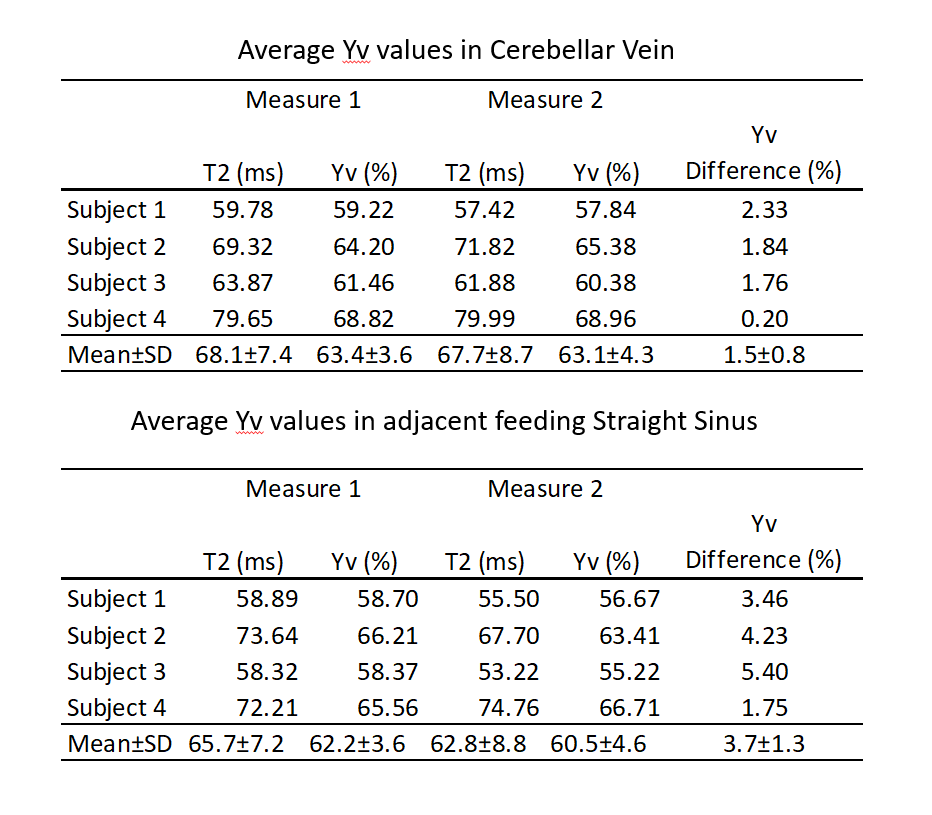
In the high-resolution 3D PC scans, superficial vermian veins(n=4) were reliably identified near the medial plane, going superficially posterior to the cerebellum and flow into straight sinus (illustrated in Figure 1.), with. After eddy current correction, there is motion artifact along phase encoding direction in magnitude images, but not have an effect on the image quality in the targeted cerebellar vermian vein(Figure 2). The T2 fitting error is good in cerebellum vein with a vessel mask. (Figure 3) Yv in cerebellum vein is 67.9±8% across all subjects, with a 1.5±0.8% inter-session difference, and a 0.8% inter-session coefficient of variation[4].(more details in Figure 3). Strong correlation between cerebellum Yv and adjacent straight sinus was found (r=0.88, p= 0.0033).DISCUSSION
Superficial cerebellum vein has been considered highly variable and mostly discussed in cerebellar diaschisis and AVM diseases[5]. With 3D Phase Contrast MR, the vermian vein can be reliably identified within 20mm in the medial sagittal plane, connecting to the straight sinus((Figure 1 yellow arrow). A normal 5 mm sagittal slice would be enough to cover the posterior 2-3 mm cerebellum vein. Relative oxygen extraction fraction and CMRO2 in cerebellum have been reported in various PET method, ranging from 34 to 45%[6], which is slightly higher than global OEF of cerebral cortex. In our data, the cerebellum vein Yv is also lower than the adjacent sinus. If assume Ya = 1, the OEF converted from cerebellum Yv agrees with the quantitative PET publications. Lower occipital region have been reported to suffer from artefacts[7]. In our current protocol, major motion artefact coming from swallowing and eyes is avoided by tilting the FOV(Figure 1 blue arrow).Conclusion
- We have identified a reliable marker for quantifying cerebellum venous oxygenation, with good physiological and technical reproducibility.
- The current protocol is non-invasive and fast( ~10 minutes for a set), which would give potential to evaluate cerebellar metabolic function in age-related diseases.
- Future advances in accelerated TRUPC would allow us further explore oxygenation properties of the cerebellum, and even deep gyrus.
Acknowledgements
No acknowledgement found.References
[1] Lyoo, C.H., Ikawa, M., Liow, J.S., Zoghbi, S.S., Morse, C., Pike, V.W., Fujita, M., Innis, R.B. and Kreisl, W.C., 2015. Cerebellum can serve as a pseudo-reference region in Alzheimer’s disease to detect neuroinflammation measured with PET radioligand binding to translocator protein (TSPO). Journal of nuclear medicine: official publication, Society of Nuclear Medicine, 56(5), p.701.
[2] Krishnamurthy, L.C., Mao, D., King, K.S. and Lu, H., 2016. Correction and optimization of a T2‐based approach to map blood oxygenation in small cerebral veins. Magnetic resonance in medicine, 75(3), pp.1100-1109.
[3] Lu, H., Xu, F., Grgac, K., Liu, P., Qin, Q. and van Zijl, P., 2012. Calibration and validation of TRUST MRI for the estimation of cerebral blood oxygenation. Magnetic resonance in medicine, 67(1), pp.42-49.
[4] Battiston, M., Schneider, T., Prados, F., Grussu, F., Yiannakas, M.C., Ourselin, S., Gandini Wheeler‐Kingshott, C.A. and Samson, R.S., 2018. Fast and reproducible in vivo T1 mapping of the human cervical spinal cord. Magnetic resonance in medicine, 79(4), pp.2142-2148.
[5] Huang, Y.P. and Wolf, B.S., 1965. The veins of the posterior fossa—superior or galenic draining group. American Journal of Roentgenology, 95(4), pp.808-821.
[6] Ibaraki, M., Miura, S., Shimosegawa, E., Sugawara, S., Mizuta, T., Ishikawa, A. and Amano, M., 2008. Quantification of cerebral blood flow and oxygen metabolism with 3-dimensional PET and 15O: validation by comparison with 2-dimensional PET. Journal of Nuclear Medicine, 49(1), p.50.
[7] Lajoie, I., Tancredi, F.B. and Hoge, R.D., 2016. Regional reproducibility of BOLD calibration parameter M, OEF and resting-state CMRO2 measurements with QUO2 MRI. PloS one, 11(9), p.e0163071.
Figures