2566
Sodium T2* Heterogeneity of Cerebrospinal Fluid in Healthy Brains and Neurological Disorders1Radiology, New York University, New York, NY, United States, 2Siemens Healthineers USA, New York, NY, United States
Synopsis
The literature reports a wide variance in CSF T2* values (46-64ms). This variance may suggest T2* heterogeneity of CSF. Here we explore the possibility of CSF T2* heterogeneity among healthy and neurologically-disordered brains.
INTRODUCTION
In sodium (23Na) MRI of the brain, cerebrospinal fluid (CSF) is considered a major source of signal contamination that degrades quantification of sodium concentration in the brain parenchyma and limits potential clinical utility in a host of neurological disorders with ionic abnormalities such as concussion (or mild traumatic brain injury, mTBI), epilepsy, bipolar disorder, and multiple sclerosis (MS). Current methods are limited in eliminating CSF signal when applied in a clinical setting at 3T due to the difficulty in reliably distinguishing between CSF and brain signals. Triple quantum filtering (TQF)1,2 was pursued as an ideal technique that eliminates signals from sodium ions at free-motion, including those in CSF. However, TQF approach suffers from low signal-to-noise ratio (SNR) when applied to human brains at 3T. Inversion recovery3,4, an alternative to TQF technique, takes advantage of difference in T1 relaxation time between CSF and brain to null CSF signal. However, it inevitably decreases brain signal as well and complicates sodium quantification. A new technique was recently reported that has the potential to separate CSF signal from the brain using multiple-TE acquisitions5,6, however, it requires prior knowledge of T2* value in CSF. The literature reports a wide variance in CSF T2* values (46-64ms)7-9. This variance may suggest T2* heterogeneity of CSF. Here we explore the possibility of CSF T2* heterogeneity among healthy and neurologically-disordered brains.METHODS
Sodium ions in CSF are in fast and free motion and thus have a mono-exponential T2* relaxation (Eq. 1)10. If sodium signal, y(t), is measured at two echo times of TE1 and TE2, T2* value is estimated via a curve fitting in Eq. 2. The distractive variation of T2* value with B0 field inhomogeneity was minimized through a correction in Eq. 3. The B0 field map was attained using the phase difference between the two TE images5. CSF was selected in lateral ventricles (left and right) for the T2* measurement. Multiple neighboring slices were used to define the extension of ventricles. T2* value was calculated voxel-by-voxel and then averaged over a CSF volume of voxels 70±50 in a range of 16-169.
Eq. [1]. $$$ y(TE)=Aexp(-TE/T_2^*) $$$
Eq. [2]. $$$ T_2^*=(TE_2-TE_1)/ln(y_1/y_2) $$$
Eq. [3]. $$$ 1/T_{2c}^*=1/T_2^*-\gamma|\delta B_0| $$$
EXPERIMENTS
Sodium MRI scans were performed on a clinical scanner at 3T (MAGNETOM Prisma, Siemens Healthineers, Erlangen, Germany) with a custom-built 8-channel dual-tuned 1H-23Na Tx/Rx head coil11. Nineteen subjects (6 mTBI, 3 epilepsy, 2 bipolar disorder,1 MS, and 7 healthy controls; age 32±13 years in 18-70 years; 7/12 Male/Female) were scanned, with the approved IRB and written consent. A custom-developed sequence, the twisted projection imaging (TPI)12, was used for the data acquisition with FOV=220mm, matrix size=64, 3D isotropic, TR=100ms, TE1/TE2=0.3/5ms, q=90°, averages=4, p=0.4, and TA =10min28sec per a TE imaging. The image reconstruction was performed offline with custom-developed programs in C++ (MS Visual Studio 2012, Redmond, WA), while the T2* and B0 map calculations in MATLAB (MathWorks, Natick, MA).RESULTS AND DISCUSSION
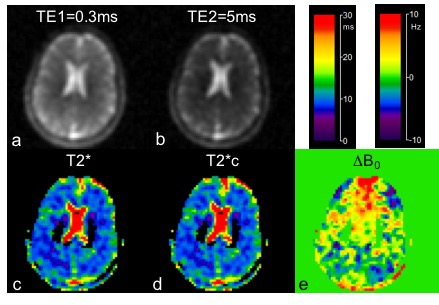
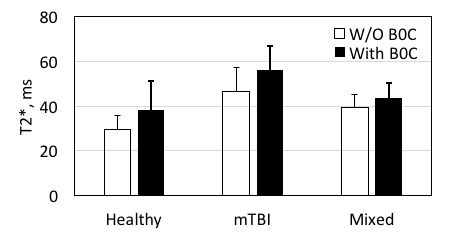
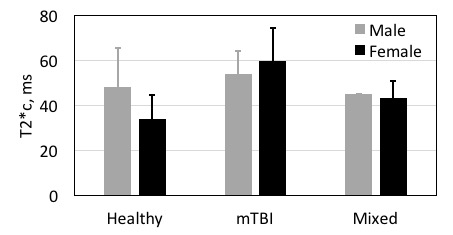
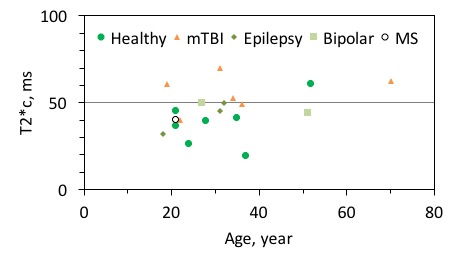
Fig. 1 shows the two-TE sodium images, T2* maps, and B0 field inhomogeneity for a typical patient with mTBI, where the ventricular CSF has large T2* values (>30ms) under small inhomogeneity (~5Hz) in the B0 field. Fig. 2 demonstrates that the studied subjects have a wide range of the corrected T2* (or T2*c) values (38-56ms), consistent with what has been reported in the literature7-9. More importantly, it demonstrates a significant difference between the healthy and mTBI groups (p=0.02) as well as between the mTBI and other (mixed) patient groups (p=0.04). However, biological variables such as age and sex did not present any impact on the T2*c value (Figs. 3 and 4).CONCLUSION
Collectively, these results provide a piece of evidence supporting heterogeneity of ventricular CSF T2* among subjects, especially after mTBI, independent of age and sex. The physiological basis for this heterogeneity is unclear at this early stage. In addition, the sample size of subjects studied in this work is small (n=19) and thus the statistical significance of the results needs to be further tested in a large pool of subjects.Acknowledgements
This work was financially supported in part by NIH grants R01 MH088370, R01 CA111996 and R01NS082436. This work was also performed under the rubric of the Center for Advanced Imaging Innovation and Research (CAI2R, www.cai2r.net), an NIBIB Biomedical Technology Resource Center (NIH P41 EB017183).References
- Reddy R, Shinar M, Wang Z, Leigh JS. Multiple-quantum filters of spin-3/2 with pulse of arbitrary flip angle. J Magn Reson 1994; B104:148-152.
- Hancu I, Boada FE, Shen GX. Three-dimensional triple-quantum-filtered (23)Na imaging of in vivo human brain . Magn Reson Med. 1999 Dec;42(6):1146-54.
- Kline RP, Wu EX, Petrylak DP, Szabolcs M, Alderson PO, Weisfidt ML, Cannon P, Katz J. Rapid in vivo monitoring of chemotherapeutic response using weighted sodium magnetic resonance imaging. Clin Cancer Res 2000; 6:2146-2156.
- Stobbe R, Beaulieu C. In vivo sodium magnetic resonance imaging of the human brain using soft inversion recovery fluid attenuation. Magn Reson Med 2005; 54:1305-1310.
- Qian Y, Panigrahy A, Laymon CM, Lee VK, Drappatz J, Lieberman FS, Boada FE, Mountz JM. Short-T2 imaging for quantifying concentration of sodium (23 Na) of bi-exponential T2 relaxation. Magn Reson Med 2015; 74:162-174.
- Qian Y, Zhao T, Lakshmanan K, Ge Y, Lui Y, Shepherd T, Boada FE. Proof of concept for the separation of free and bound sodium in human brain through two-TE acquisitions at 3T. In the Proceedings of the 25th Annual Meeting of ISMRM, Honolulu, Hawai, USA, 2017, p.2956.
- Bartha R, Menon RS. Long component time constant of 23Na T*2 relaxation in healthy human brain. Magn Reson Med. 2004 Aug;52(2):407-10.
- Fleysher L, Oesingmann N, Stoeckel B, Grossman RI, Inglese M. Sodium long-component T2* mapping in human brain at 7 Tesla. Magn Reson Med. 2009 Nov;62(5):1338-41.
- Blunck Y, Josan S, Taqdees SW, Moffat BA, Ordidge RJ, Cleary JO, Johnston LA. 3D-multi-echo radial imaging of 23 Na (3D-MERINA) for time-efficient multi-parameter tissue compartment mapping. Magn Reson Med 2018; 79:1950-1961.
- Jaccard G, Wimperis S, Bodenhausen G. Multiple-quantum NMR spectroscopy of S=3/2 spins in isotropic phase: A new probe for multiexponential relaxation. J Chem Phys 1986; 85: 6282-6293.
- Lakshmanan K, Brown R, Madelin G, Qian Y, Boada F, Wiggins GC. An eight-channel sodium/proton coil for brain MRI at 3 T. NMR Biomed 2018; 31 e3867.
- Boada FE, Gillen JS, Shen GX, Chang SY, Thulborn KR. Fast three dimensional sodium imaging. Magn Reson Med 1997; 37:706–715.
Figures