2565
Chronic anemic patients have impaired cerebral oxygen delivery using Pseudo Continuous Arterial Spin Labeling MRIYaqiong Chai1,2, Adam Michael Bush3, Chau Vu2, Natasha Lepore1, Thomas Coates4, and John Wood5
1Radiology, Children's Hospital Los Angeles, Los Angeles, CA, United States, 2Biomedical Engineering Department, University of Southern California, Los Angeles, CA, United States, 3Radiology, Stanford University, Palo Alto, CA, United States, 4Hemotology, Children's Hospital Los Angeles, Los Angeles, CA, United States, 5Cardiology, Children's Hospital Los Angeles, los angeles, CA, United States
Synopsis
We quantified and compared cerebral blood flow (CBF) and oxygen delivery in patients with thalassemia intermedia and other chronic anemic patients and healthy controls, using arterial spin labeling MRI. Anemic patients exhibited elevated CBF globally and in grey matter (GM). While global and GM O2 delivery was preserved in anemic patients, white matter (WM) O2 delivery was 20% lower in this cohort compared to healthy controls. Age was the strongest predictor for both CBF and O2 delivery, but the mechanisms of decreased WM O2 delivery needs further study, given the inadequate neovascularization in response to chronic hypoxia and other factors.
Introduction
Patients with thalassemia intermedia, sickle cell disease and other chronic anemias have a higher risk of cerebrovascular disease and stroke1. We have previously demonstrated that cerebral blood flow (CBF) increases to preserve global cerebral oxygen delivery, yet the sufficiency of regional cerebral tissue oxygen (O2) delivery has never been studied2. In this study, we used pseudo continuous arterial spin labeling (PCASL) to measure cerebral blood flow (CBF) and O2 delivery in patients with chronic, non-sickle anemia syndromes and age matched healthy controls.Methods
The study includes 23 anemic patients (ACTL) and 25 healthy control patients (CTL) that were recruited from the Children’s Hospital Los Angeles. Brain MRI was performed on a Philips Achieva 3 Tesla scanner with an 8-channel head coil. Imaging protocol consisted to 3D T1w, 3D T2w, 3D MRA, and 3D pseudo continuous arterial spin labeling (PCASL) scans3. CBF quantification was calculated using a two-compartment kinetic quantification model reported by Wang et. al4. We corrected for the effect of hematocrit on blood T1, velocity and B1+ inhomogeneity on labeling efficiency, and increased cerebral blood flow on transit time as previously described3. Then CBF maps were converted into cerebral O2 delivery maps to correct for hemoglobin and O2 saturation in anemic group. The following equations show the relationship of hemoglobin, O2 content and O2 delivery5: Oxygen Delivery = CBF × Oxygen Content (1) Oxygen Content = 1 .34 × Hemoglobin×SpO2 + 0.003 × pO2 (2) where SpO2 is the arterial oxygen saturation and pO2 is the partial pressure of oxygen. After both CBF and oxygen delivery maps were produced, non-zero mean of the central 5 slices were used for each subject to conduct group-wise comparison. The preprocessing and registration pipeline of CBF to standard atlas was previously published in Chai et. al.6. Predictors of global, grey matter (GM) and white matter (WM) were identified using univariate and stepwise multivariate regression (JMP Pro, SAS, Cary NC).Results
Patients’ demographic information is summarized in Table 1. There was no significance difference in age and sex between two groups. Fourteen of the 23 anemic subjects were receiving transfusion therapy every three weeks; these patients were studied at their hemoglobin nadir to better match non-transfused subjects. Two of the spherocytosis patients were polycythemic and were excluded from group-wise comparisons. Anemic subjects were mildly desaturated compared to CTL group and exhibited higher circulating cell-free hemoglobin due to ineffective erythropoiesis. MRA images were screened by a licensed neuroradiologist and were normal for all participants. Ten patients out of 23 patients and 5 out of 25 healthy controls were identified with white matter hyperintensities (WMHs) from T2 w images. One patient was excluded due to poor image quality. The left panel of Figure 1 compares the spatial distribution of CBF in CTL and ACTL patients and the right panel of Figure 1 compares regional O2 maps. Group differences are not visually obvious on the color maps, but Figure 2 demonstrates that whole brain and GM CBF were significantly higher in ACTL group than healthy controls but WM CBF was not. When expressed as oxygen delivery, GM and whole brain O2 delivery was not different between the two groups but WM O2 delivery was 20% lower in anemic subjects. To further explore the contributions to CBF and O2 delivery, we regressed CBF and O2 delivery across patient demographics and blood test results. Age was inversely correlated with whole brain and GM CBF (p<0.05), and more strongly correlated with whole brain and GM O2 delivery (p<0.01). Other strong predictors are listed in Table 2. On multivariate analysis, age and hematocrit predicted whole brain and GM CBF with combined R2=0.45 and 0.48, respectively. When O2 delivery was examined, factors related to anemia were no longer significant. Only age was remained in multivariate model with R2=0.20.Discussion
Similar to our prior studies using phase contrast MRI, we found that global CBF was elevated in anemic patients to compensate for decreased oxygen carrying capacity2. While global and GM O2 delivery was preserved in anemic patients, WM O2 delivery was 20% lower in anemic subjects. This finding is consistent with the white matter volume loss, abnormal diffusion weighted imaging, silent stroke heat maps, and increased oxygen extraction fractions observed in borderzone white matter regions7–9. However, whether the decreased WM O2 delivery falls into a physiological steal phenomenon: cerebral compensatory mechanisms protect GM, or simply inadequate neovascularization in response to chronic hypoxia requires further investigation.Acknowledgements
This work is supported by the National Heart Lung and Blood Institute (1RO1HL136484-A1, 1U01HL117718-01), the National Institute of Clinical Research Resources (UL1 TR001855-02) and by Research Support In Kind from Philips Healthcare.References
1. Musallam KM, Taher AT, Karimi M, Rachmilewitz EA. Cerebral infarction in β-thalassemia intermedia: Breaking the silence. Thromb Res. 2012;130(5):695-702.. 2. Bush AM, Borzage MT, Choi S, et al. Determinants of resting cerebral blood flow in sickle cell disease. Am J Hematol. 2016;91(9):912-917. 3. Bush A, Chai Y, Choi SY, et al. Pseudo continuous arterial spin labeling quantification in anemic subjects with hyperemic cerebral blood flow. Magn Reson Imaging. 2018;47(August 2017):137-146. 4. Wang J, Alsop DC, Li L, et al. Comparison of quantitative perfusion imaging using arterial spin labeling at 1.5 and 4.0 Tesla. Magn Reson Med. 2002;48(2):242-254. 5. Wasserman K, Whipp BJ. State of the Art Exercise Physiology in Health and Disease. Am Rev Respir Dis. 1975;112(3):219-249. 6. Chai Y, Coloigner J, Bush AM, Wood JC, Lepore N. Regional Cerebral Blood Flow Measurement in Patients with Sickle Cell Disease Using Pseudo Continuous Arterial Spin Labeling. 2016:2016. 7. Choi S, Bush AM, Borzage MT, et al. Hemoglobin and mean platelet volume predicts diffuse T1-MRI white matter volume decrease in sickle cell disease patients. NeuroImage Clin. 2017;15(April):239-246. 8. Chai Y, Coloigner J, Qu X, et al. Tract specific analysis in patients with sickle cell disease. In: In 11th International Symposium on Medical Information Processing and Analysis. Vol 9681. ; 9. Ford AL, Ragan DK, Fellah S, et al. Silent infarcts in sickle cell anemia occur in the borderzone region and are associated with low cerebral blood flow. Blood. 2018;(314):blood-2018-04-841247.Figures

Whole brain CBF and oxygen
delivery map in axial view. The coordinates in the standard atlas is 41, 44 and
49 from left to right for CBF and oxygen delivery maps, respectively. the
color-bar represents absolute perfusion on the left panel in ml/100g/min and ml
O2/100g
brain tissue per minute on the right panel.
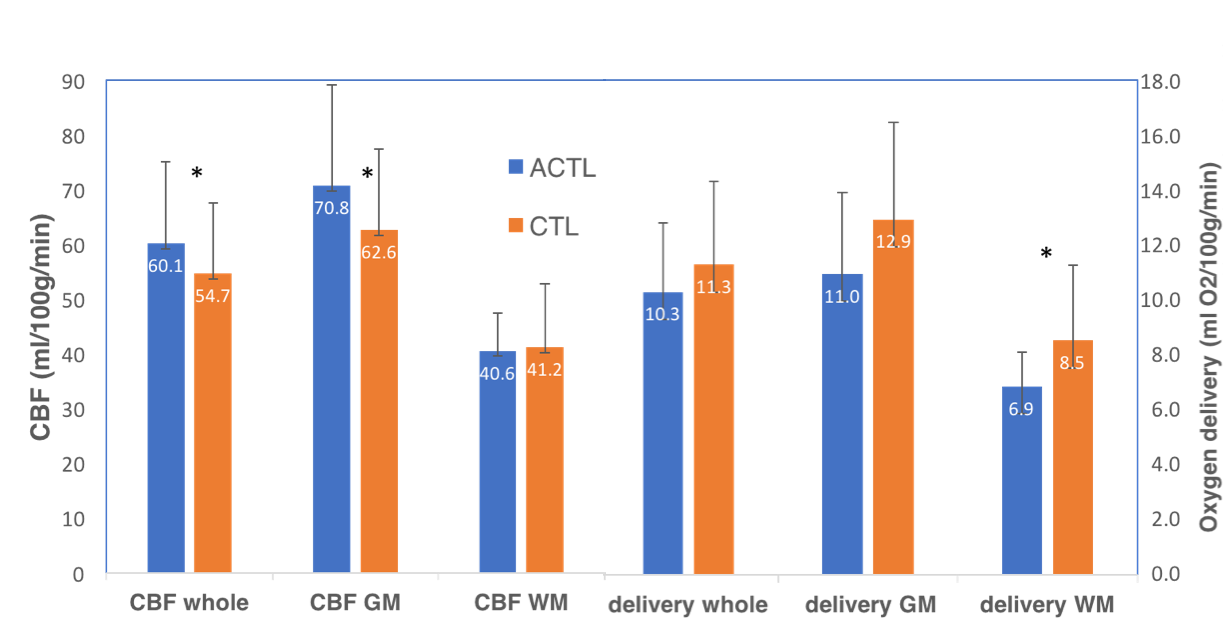
Measurements of CBF and O2
delivery for the whole brain, grey matter (GM) and white matter (WM).
CTL
= healthy controls, ACTL = anemic control subjects. Asterisk indicatse
significant group difference (p<0.05). Error bar shows standard deviation.