2563
Computational assessment of enlarged perivascular spaces on brain magnetic resonance images in Vascular Dementia patients.Martha Singh1, Anuja Pradhan2, Mustafa Salimeen2, Habib Tafawa2, Xianjun Li2, Miaomiao Wang2, Congcong Liu2, Guanyu Yang3, Qu Qiumin4, and Jian Yang2,5
1Radiology, The First Affiliated Hospital of Xi’an Jiaotong University, Xi'an, China, 2The First Affiliated Hospital of Xi’an Jiaotong University, Xi'an, China, 3Xi’an AccuRad Network and technology Co. Ltd, Xi'an, China, 4Department of neurology, The First Affiliated Hospital of Xi’an Jiaotong University, Xi'an, China, 5Department of Biomedical Engineering, School of Life Science and Technology, Xi’an, China, Xi'an, China
Synopsis
Enlarged perivascular spaces (EPVS) are common in Vascular Dementia (VaD) patients, associated with aging, inflammation, etc. Many studies address EPVS as it is related to count and volume but very few on the density using 3T MRI. Our aim in this study is to describe an effective and user-friendly computational method to aid in the perivascular spaces segmentation to yield EPVS count, volume and density in VaD patients. EPVS count, volume and density are significantly greater than in the control group (P<0.05). The results suggest that computational assessment of EPVS can further aid in an early diagnostic of VaD.
Introduction
Perivascular space (PVS), referred to as enlarged perivascular spaces (EPVS) or Virchow-Robin spaces (VRS), have been defined as cavities that surround small penetrating cerebral arterioles as they course from the subarachnoid space through the brain parenchyma (1). They conform to the path of the associated arterial branches and typically present bilaterally (2). On a transverse/axial T2-weighted (T2W) MRI, they can be identified as round, oval or curvilinear hyper intensities (3,4). Previous studies show a method for detecting EPVS using computational methods using 7T for EPVS counts and volume. (5,6) However, to our knowledge, only one study did on the density of EPVS but in mild cognitive impairment. (7) The identification of EPVS at clinical MR imaging is well established by using visual rating scales. (8) Visual rating scales, moreover, are limited in their sensitivity because they rely on subjective selection, and may be unreliable across studies and laborious to implement. EPVS are common in Vascular Dementia (VaD) patients. The limitations inherent in the current methods of diagnosing VaD have constrained the use of early therapeutic interventions to delay the progression of this disease. This study evaluated whether quantifying EPVS observed on MR imaging can help differentiate those with VaD from cognitively healthy controls and, thus, have an application in the diagnosis of VaD.Methods
The Institutional Review Board approved this retrospective study. Forty-eight VaD patients who met the NINDS-AIREN criteria for VaD and forty healthy controls were recruited from the neurological department at our hospital between 2013 to 2018. T2-weighted images (T2WI) were acquired on a 3T scanner (Signa HDxt, GE, Milwaukee, Wisconsin, USA) with an 8-channel array head coil. In total,30 axial slices with a thickness of 5 mm and a 0 mm gap, covering a total of 78 mm. The other parameters for the T2-weighted scans included the following: TR/TE =4680/105.34 ms, echo-train length=32, echo spacing=18.3ms, FOV = 240mm, matrix =384×384. The total acquisition time for the T2WI dataset is about 2-3 minutes. The visual rating was performed by two radiologists. Correlations between visual counts and automatic counts were assessed. EPVS number, volume, and densities were measured on T2WI. Whole-brain algorithm was used by automatic segmentation on MRI–based multi-sequence images. Then, auto identification of PVS in white matter was preformed.Finally, EPVS count, white matter volume, brain volume, and density were calculated.(Fig.1) Linux virtual machine with FSL (https://fsl.fmrib.ox.ac.uk/fsl/fslwiki), was used in processing T2WI images and segmented into brain tissue types which, white matter, cortical gray matter and ventricular CSF. The images were exported from FSL to custom software built in Matlab (The Mathworks, Inc., Natick, MA) (https://www.mathworks.com). The core of the algorithm used to segment VRS is 2D Frangi filtering which enable to filter vessel like tubular structures from 2D images of axial planner T2WI. The software keeps the structures with 2~50 voxels (the voxel volume we used is about 0.35mm*0.35mm*4mm), and regards the other structures as non-VRS.(fig.2) All statistical analysis was performed by using SPSS (Version 21.0; IBM, Armonk, New York, USA). And P < 0.05 was considered as statistically significant.Results
Among the 88 patients studied, of which 48 were Vad ( male/ female, 27/21) and 40 healthy patients (male/female, 23/17) with a mean age of 65.17±10.761 in Vad and 63.80±10.199 in healthy patients(fig 2), ranging from 40-86 years. In the risk factors looked at (hypertension, Diabetes Mellitus, smoking, stroke, and heart disease; P<0.0001, P<0.006, P< 0.023, P< 0.001 and P<0.001 respectively ) all show a significant difference (table 1). They were significant correlation between counts by visual raters and computational detection of EPVS in the same section (r=0.56, P<0.002;r=0.59,P<0.002; and r=0.56, P<0.01 for raters respectively). With regards to visual rating score of WM EPVS count and computational rating score of WM of selected slice P< 0.01 for BG EPVS count P< 0.001 region. As for WM EPVS volume P< 0.001 and BG EPVS volume P < 0.050.(table 2) The densities of the enlarged perivascular spaces were calculated to be 1.03 0.40 v/v% for controls and 2.540.58v/v% in Vascular Dementia patients (P<0.001). (table 2)Discussion
In this study evidence was provided to support that there is significant difference between our VaD patients and our control group in EPVS counts, volume and density. The aim of this study describe an effective and user-friendly computational method to aid in the perivascular spaces segmentation to yield EPVS count, volume and density which can further aid in an early diagnostic of VaD.Conclusion
This computational method is applicable to clinical protocols and offers quantitative means for PVS presence. It shows rational agreement with the visual rating scale and EPVS count, volume and density are higher in Vad patients than in healthy ones.Acknowledgements
This study was supported by the National Key Research and Development Program of China (2016YFC0100300), National Natural Science Foundation of China (81471631, 81771810 and 81171317), the 2011 New Century Excellent Talent Support Plan of the Ministry of Education, China (NCET-11-0438), the Fundamental Research Funds for the Central Universities (xjj2018265), the Fundamental Research Funds of the First Affiliated Hospital of Xi'an Jiaotong University (2018QN-09).References
1. Kwee RM, Kwee TC. Virchow-Robin spaces at MR imaging. RadioGraphics 2007;27:1071–1086. 2. Jungreis CA, Kanal E, Hirsch WL, Martinez AJ, Moossy J. Normal perivascular spaces mimicking lacunar infarction: MR imaging. Radiology 1988;169:101–104. 3. Akter M, Hirai T, Kitajima M, et al. Multiple prominent dilated perivascular spaces do not induce Wallerian degeneration as evaluated by diffusion tensor imaging. AJNR Am J Neuroradiol 2007;28:283–284. 4. Di Costanzo A, Di Salle F, Santoro L, Bonavita V, Tedeschi G. Dilated Virchow-Robin spaces in myotonic dystrophy: frequency, extent and significance. Eur Neurol 2001;46:131–139. 5. ID Kilsdonk, Steemwijk, Pouwels, et al. Perivascular spaces in MS patients at 7 tesla MRI: A marker of neurodegeneration. MSJ. 2014;1-4 6. Kejia Cai, Rongwen Tain, Sandhitsu Das, et al. The feasibility of quantitative MRI OF PERIVASCULAR SPACES AT 7T. Neurosci Methods. 2015;1-6 7. M. Niazi, M.Karaman, S.Das, et al. Quantitative MRI of perivascular spaces at 3T for elderly diagnosis of mild cognitive impairment. AJNR. 2018;1-8 8. Potter GM, Chappell FM, Morris Z, Wardlaw JM. Cerebral perivascular spaces visible on magnetic resonance imaging: development of a qualitative rating scale and its observer reliability. Cerebrovasc Dis 2015;39(3-4):224–231.Figures
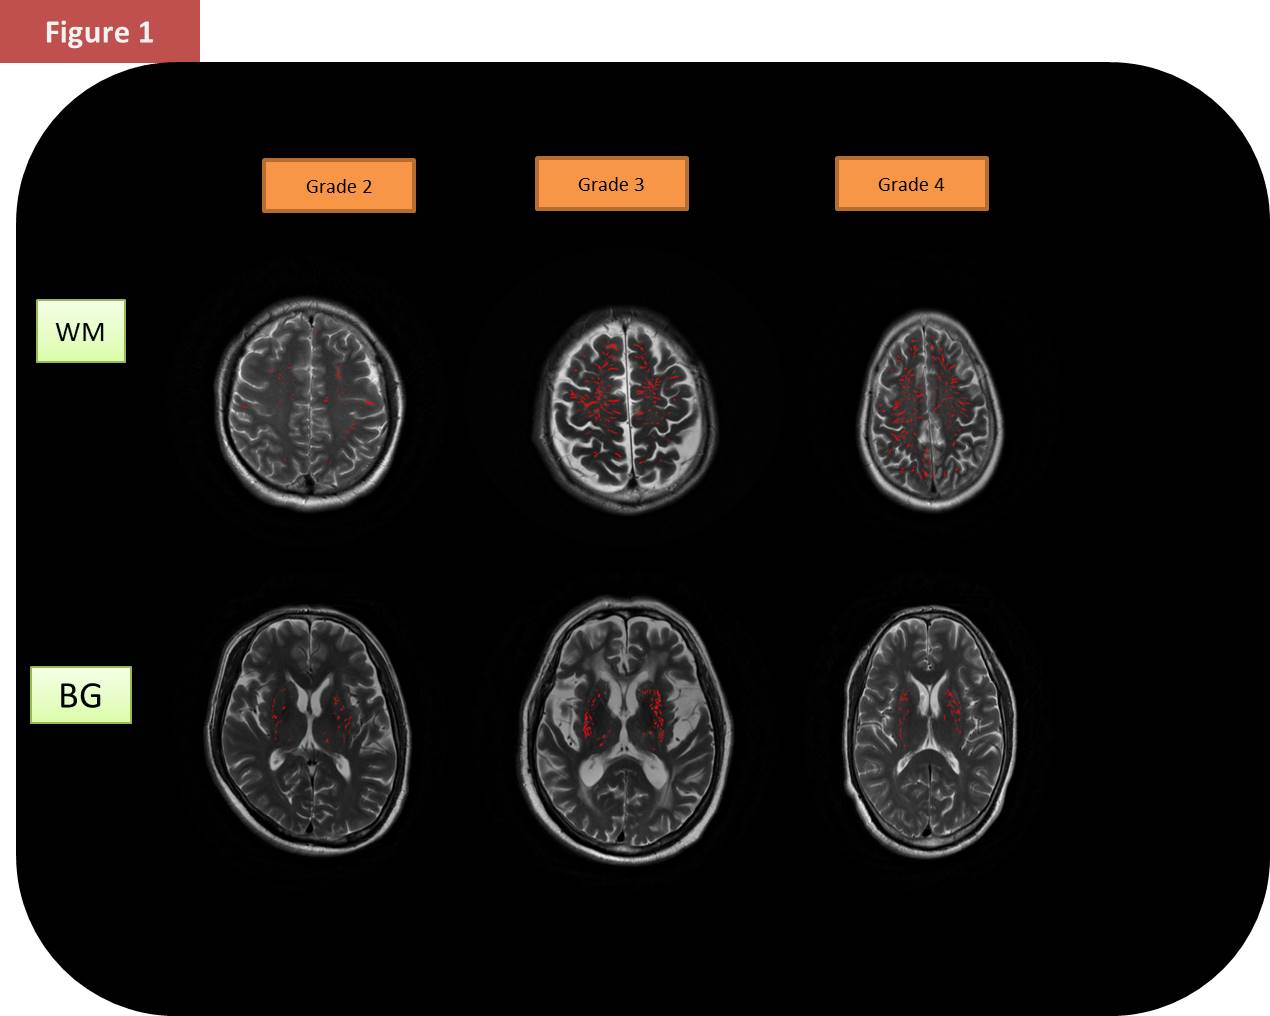
Fig.1 Examples of the enlarge
perivascular space, axial T2WI show extensive VRS dilatation in the White
matter and Basial Ganglia as demonstrated with computational method
(highlighted red).
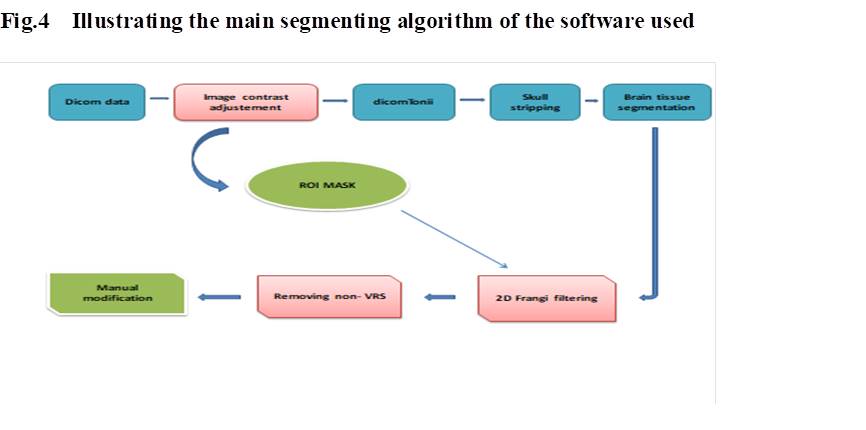
Fig.2
Illustrating the main segmenting algorithm of the software used
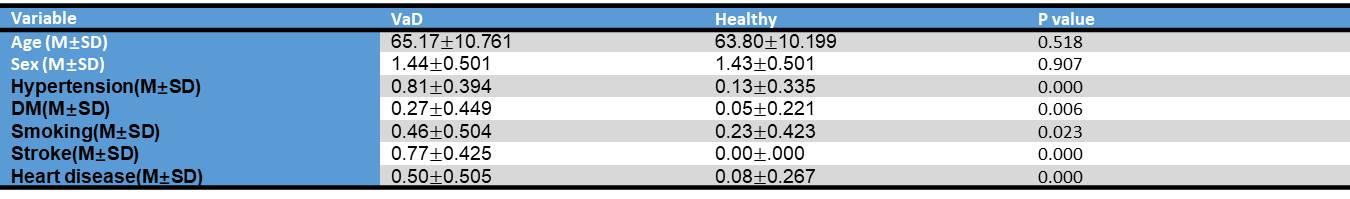
Table1: Demographic data of patients with their P
values.
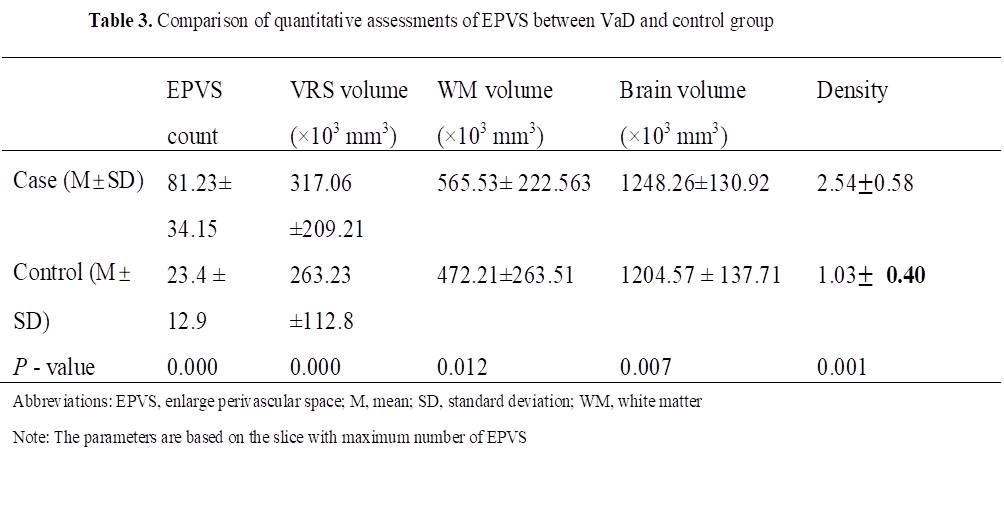
Table
2. Comparison of quantitative assessments of EPVS
between VaD and control group