2560
Using Perfusion Weighted Imaging to Aid in Drawing Prominent Veins on Quantitative Susceptibility Mapping1The MRI Institute for Biomedical Research, Bingham Farms, MI, United States, 2Department of Neurology, Pusan National University Yangsan Hospital, Pusan National University School of Medicine, Yangsan, Korea, Republic of, 3Radiology Department, Shanghai Fourth People's Hospital, Shanghai, China
Synopsis
Current literature references Asymmetrically Prominent Cortical Veins as a valid marker, but identification is user dependent. We aim to quantify APCV using PWI, greatly reducing the reliance on observer input. This method is a stepping stone for automatic APCV segmentation and has the potential to play a role in establishing a reliable identifier for ischemic penumbra from SWI data.
INTRODUCTION
Ischemic penumbra is one of the important factors that determine the response to treatment and functional outcome in patients with acute cerebral infarction.1 Therefore, identifying the penumbra is an important role of stroke imaging.2 The concept of Diffusion-Perfusion Mismatch (DPM) has been introduced to identify ischemic penumbra. Several studies attempted to demonstrate the efficacy of treatment using DPM as a deciding marker, but no definitive results were obtained.3-5 One explanation is the concept of DPM being incomplete to predict the ischemic penumbra because the Oxygen Extraction Fraction (OEF) is not considered.6 In this context, Susceptibility-Weighted Imaging (SWI) is an important candidate to complement the imperfection of DPM. Deoxyhemoglobin increases in the cerebral veins with poor blood supply, so SWI displays those Asymmetrically Prominent Cortical Veins (APCV) in the area of elevated OEF.7,8 But there are debates as to whether SWI-DWI mismatch using APCV could replace DPM. In this work, we explore using Perfusion Weighted Imaging (PWI) to define regions of interest and assessing APCV only within those regions. This method increases objectivity in APCV drawing and builds the backbone of the next stage in penumbra quantification.METHODS
Data Acquisition: We acquired 167 acute stroke datasets from our collaborators at Shanghai Forth People's hospital. All cases included SWI, PWI, and diffusion weighted images and were collected on a Siemens 3T scanner. For our study, exclusion criteria included brainstem or posterior infarct, hemorrhage affecting SWI, and unavailable PWI data.
Image Analysis: A processor with 4 years of experience and a Stroke Neurologist reviewed the SWI data to determine whether APCV was present. This was used as a gold standard to create two groups: APCV and normal. SWI and PWI sequences were spacially coregistered and Quantitative Susceptibility Maps (QSM) were generated using SPIN software (SpinTech, Inc., Bingham Farms, MI). Maximum intensity projections of QSM were generated to match the slice thickness in PWI (6.5mm including 1.5mm acquisition gap). Relative mean transit time was used to outline a region of interest around the hyperintensity. This ROI was overlayed on the QSM image. After excluding extra parenchymal space and edge artifacts, a symmetrical contralateral region was drawn. A threshold of 90 ppb was applied to both regions. Thresholded areas on every slice were converted into individual objects. Six consecutive pixels were required for a vein to be counted. The number of veins and occupying pixels were summed in both hemisphere for each case and compared.
RESULTS
This quantification method showed a statistically significant (p<0.05) separation between the APCV and normal groups. 19 cases (12 males 75.4+/-13 years old and 7 females 78.4+/-7 years old) with well defined infarcts on PWI were included. Seven of those were in the APCV group. The median times since onset for the APCV and normal groups were 4 and 3.5 hours, respectively. All normal cases had less than 14 veins or 200 pixels differences between the two regions and five out of seven APCV cases had a greater separation.DISCUSSION
Objective APCV segmentation can be achieved using the affected area of PWI. Most of the previous clinical studies used the Alberta Stroke Program Early CT Score (ASPECTS) to assess the APCV on SWI. This method, however, always has a potential for a interobserver variability. In contrast, the APCV segmentation newly applied in our study can objectively assess the OEF changes in PWI lesions. Veins in the contralateral tissue are a good indicator of normal OEF on QSM, so we used them as a comparison control. The result is a possible biomarker to predict the fate of the perfusion lesion, and therefore the patient outcome. Given the reliability of PWI, this method can be implemented into a post-processing automated software and provide OEF information. This method excels because it can use any PWI variable, regardless of manufacturer. The separation between the two groups makes it clear that a strong sensititvity is not in question.CONCLUSION
This method brings us closer to an objective APCV segmentation replicable across studies. Although lesion drawing around APCV remains subjective, overlaying the PWI area takes it in a different direction since we are no longer comparing to PWI but rather using it. We plan to take it a step further and depict a percentage of PWI lesion area with elevated OEF to provide this vital information for acute stroke clinicians.Acknowledgements
No acknowledgement found.References
1. Fisher M. The ischemic penumbra: identification, evolution and treatment concepts. Cerebrovasc Dis. 2004;17 Suppl 1:1-6.
2. Davis S, Donnan GA. Time is Penumbra: imaging, selection and outcome. The Johann jacob wepfer award 2014. Cerebrovasc Dis. 2014;38(1):59-72.
3. Broderick JP, Palesch YY, Demchuk AM, et al. Endovascular therapy after intravenous t-PA versus t-PA alone for stroke. N Engl J Med. 2013;368(10):893-903.
4. Ciccone A, Valvassori L, Investigators SE. Endovascular treatment for acute ischemic stroke. N Engl J Med. 2013;368(25):2433-2434.
5. Kidwell CS, Jahan R, Gornbein J, et al. A trial of imaging selection and endovascular treatment for ischemic stroke. N Engl J Med. 2013;368(10):914-923.
6. Kidwell CS, Alger JR, Saver JL. Beyond mismatch: evolving paradigms in imaging the ischemic penumbra with multimodal magnetic resonance imaging. Stroke. 2003;34(11):2729-2735.
7. Luo S, Yang L, Wang L. Comparison of susceptibility-weighted and perfusion-weighted magnetic resonance imaging in the detection of penumbra in acute ischemic stroke. J Neuroradiol. 2015;42(5):255-260.
8. Park MG, Yang TI, Oh SJ, Baik SK, Kang YH, Park KP. Multiple hypointense vessels on susceptibility-weighted imaging in acute ischemic stroke: surrogate marker of oxygen extraction fraction in penumbra? Cerebrovasc Dis. 2014;38(4):254-261.
Figures
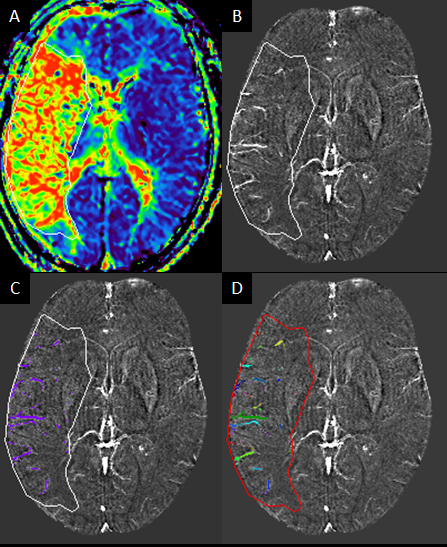
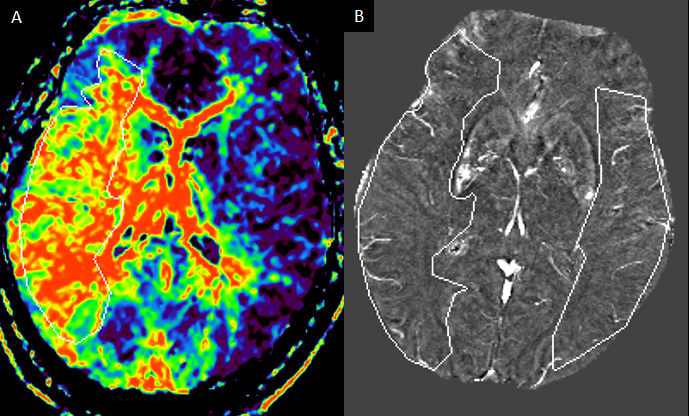
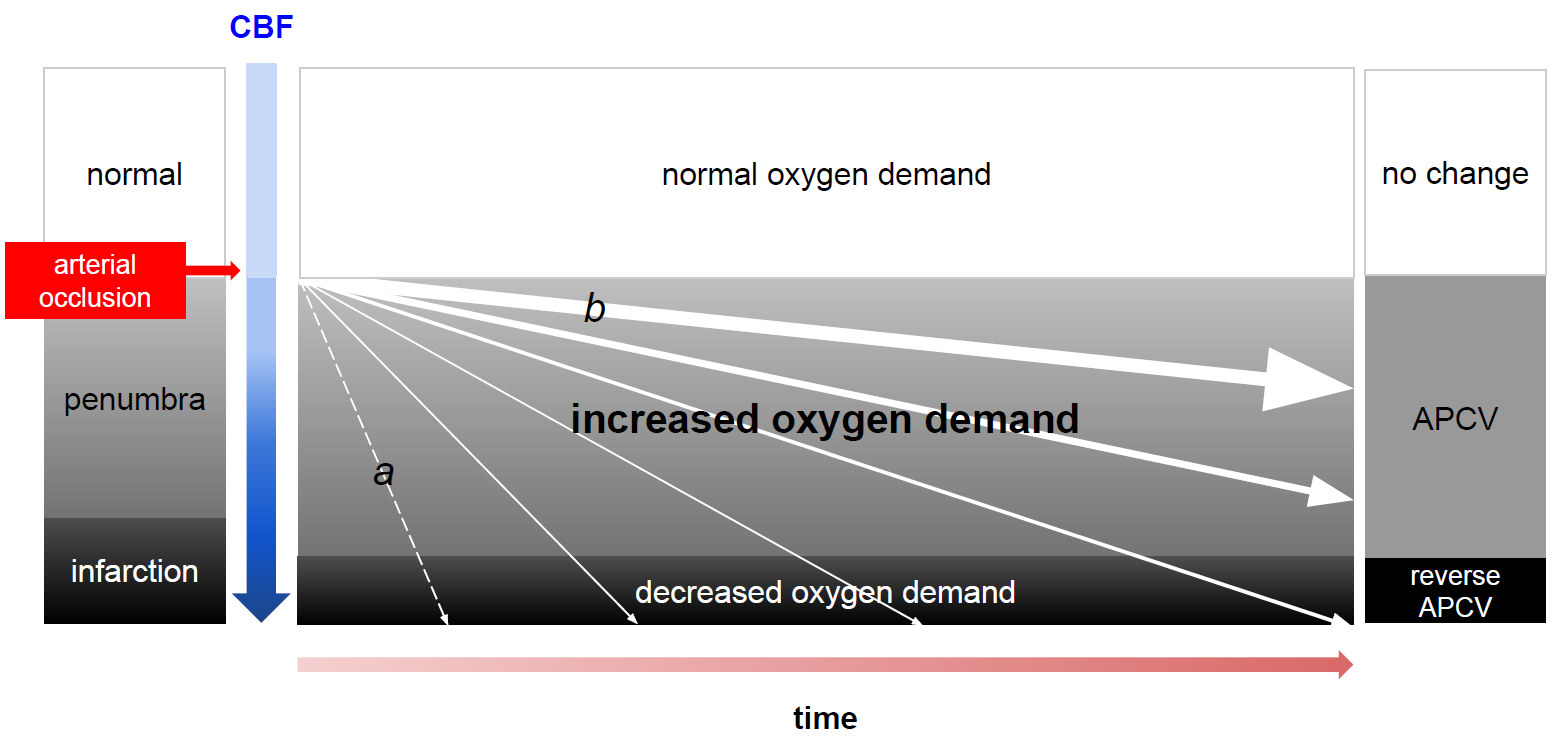
Figure 3: A schematic visualizing the spacial and temporal stages of occlusion within the parenchyma and the cardiovascular result that leads to prominent veins in the affected tissue.
a: subjects with poor collateral flow
b: subjects with good collateral flow
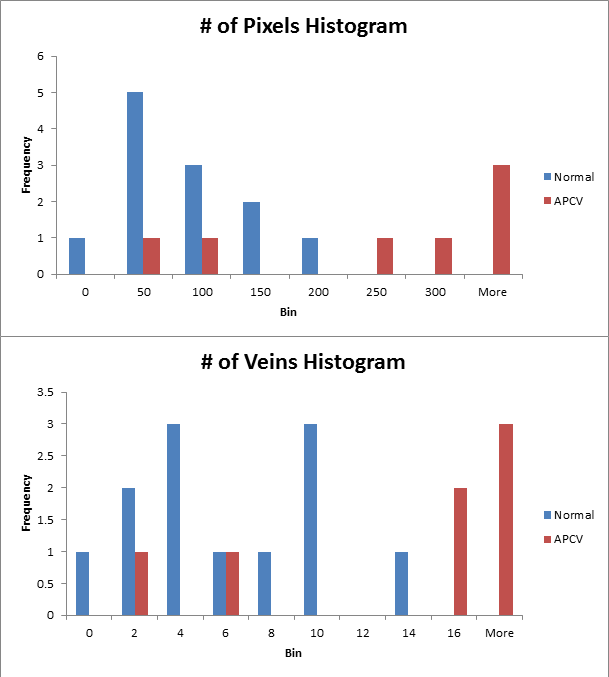
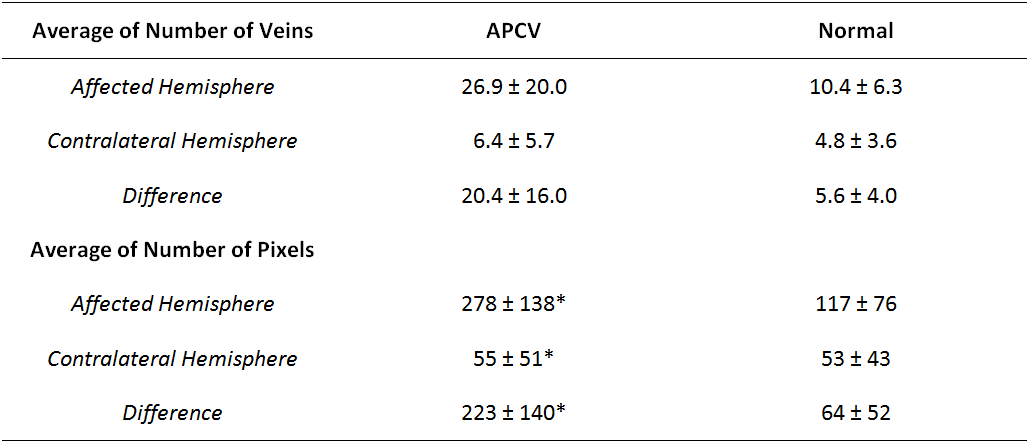
Table showing the resultant number of veins and pixels after segmentation was completed.
* indicates result with one outlier removed