2559
Study of the cerebral blood flow metabolism in patients with Parkinson’s disease using arterial spin labeling MRI1Radiology, Northen Jiangsu people's hospital, Yangzhou, China, 2GE Healthcare, MR Research, Beijing, China
Synopsis
There are still debates on the alterations of subcortical metabolism in Parkinson’s disease. We performed 3D pseudo-continuous pulse ASL on PD and control groups. The absolute cerebral blood flow (CBF) values and relative CBF (rCBF) in subcortical regions were automatically extracted and calculated. We found widespread decreased absolute CBF in PD patients. However, the subcortical rCBF increased significantly. We conclude that widespread blood hypoperfusion in PD brain is absolute, and hyperperfusion in the subcortical brain regions is only relative to the whole brain level of patients themselves.
Introduction
The ganglia is critical subcortical node within the well-documented complicated extrapyramidal circuitry that has been seriously implicated in the course of Parkinson’s disease (PD), and there are increasing interests to reveal the pathophysiological changes in the striatum in PD brain.
However, there exist debates on the alterations of subcortical metabolism. Some studies indicated a PD-related spatial covariance pattern (PDRP) which is characterized by increased cerebral blood flow (CBF) and FDG hypermetabolism in a set of subcortical regions such as pallidum-thalamus and pons1,2. In the meanwhile, some others argued that subcortical blood flow and glucose metabolism were decreased in the PD brain and assumed that the so-called PDRP could be caused by an artifact of global mean normalization during data preprocessing3,4.
Therefore, the aim of this study was to investigate alterations of blood perfusion in subcortical regions in Parkinson’s disease patients by three dimensional arterial spin labeling (ASL) MRI.
Materials and Methods
Thirty patients with PD and forty control subjects were recruited. Routine brain MRI and 3D pseudo-continuous pulse ASL were performed on all the subjects.
All MRI examinations were performed at a 3T MR imaging system (Discovery 750, GE Healthcare, Milwaukee, WI) with an 8-channel phased array head coil.
The 3D ASL parameters were as follows: 36 axial slices parallel to the anterior commissure - posterior commissure line, covering the whole brain; TR 4844 ms; TE 10.5 ms; slice thickness 4.0 mm; FOV 24 × 24 cm; NEX 3; post labeling delay time 2025 ms. Multi-arm spiral imaging was used with 8 arms and 512 points acquired on each arm. The scanning time was 4 mins 41 s.
In addition, 3D T1 weighted images of the whole brain were also acquired with 160 thin slices of 1mm thickness.
The cerebral blood flow maps derived from 3D ASL were co-registered to the Montreal Neurological Institute (MNI) brain space through a transfer matrix obtained ahead from 3D T1 weighted images normalization. The stereo-templates of bilateral caudate nucleus, putamen nucleus, globus pallidum and thalamus were used as regions of interest (ROIs) to extract absolute CBF values in these subcortical regions, respectively. The relative CBF (rCBF) values represented by individual whole brain CBF divided by each of the regional CBF were also calculated in consideration of the difference between individual whole brain CBF. The absolute and relative CBF values were compared respectively between groups by one-way analysis of variance (ANOVA).
Results
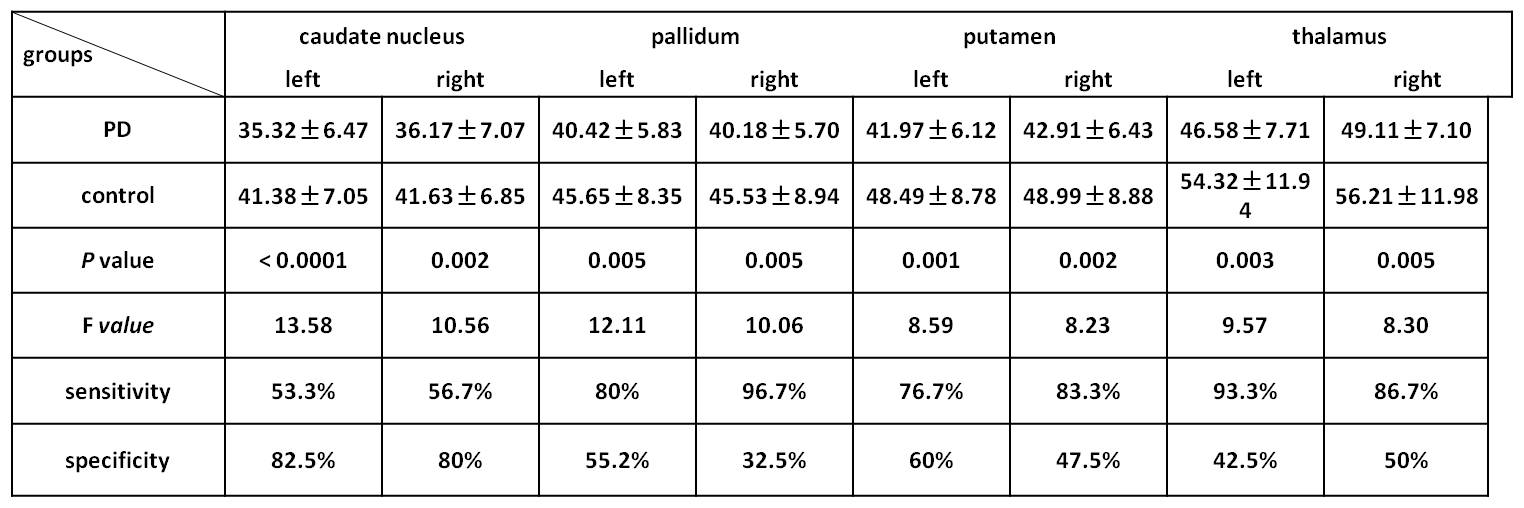
The subcortical CBF values for each ROI in PD were significantly lower than that in the control group, with p values less than 0.0001, 0.002, 0.001, 0.002, 0.005, 0.005, 0.003, 0.005 and F values 13.58, 10.56, 12.11, 10.06, 8.59, 8.23, 9.57, 8.30 for left and right caudate nucleus, globus pallidum, putamen nucleus and thalamus, respectively. The details of group mean CBF, sensitivity, specificity of each ROI were shown in Table 1. It’s notable from Table 1 that CBF in most subcortical ROIs has high sensitivity.
The whole brain mean CBF values of all subjects were also extracted and compared between groups, and mean CBF values in PD patients decreased significantly than those in the control group, with a p value 0.0001, and there was 18.31% decrement in whole brain mean CBF in the patient group.
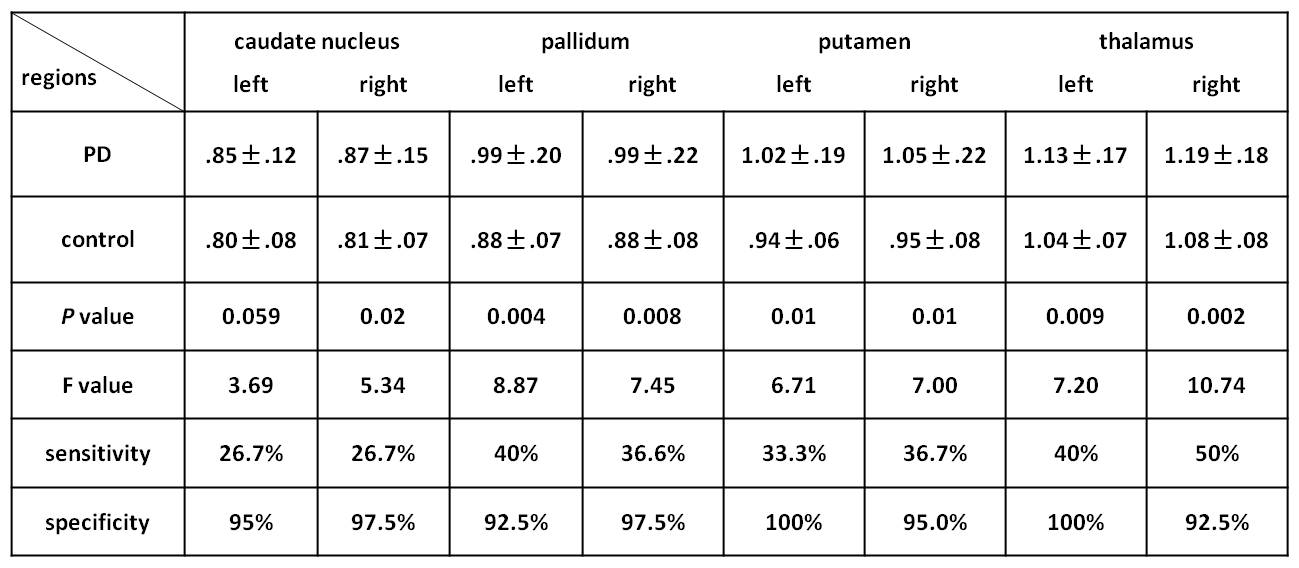
However, rCBF in almost all subcortical ROIs of the patients significantly increased when compared with the control group. For all ROI regions of left and right caudate nucleus, globus pallidum, putamen nucleus and thalamus, the p values were 0.059, 0.02, 0.004, 0.008, 0.01, 0.01, 0.009, 0.002, respectively, and F values 3.69, 5.34, 8.87, 7.45, 6.71, 7.00, 7.20, 10.74, respectively. The details of group mean rCBF, sensitivity, specificity of each ROI were shown in Table 2. It can be noted from Table 2 that the rCBF has high specificity for all of the subcortical ROIs.
Discussion
Our result indicated that the subcortical perfusion in PD patients decreased absolutely, and relatively increased only after normalization with global mean. The so-called PDRP seems to be not true. We could assume that cerebral blood perfusion has been redistributed by the increased subcortical rCBF in patients with PD.Conclusion
The decreased cerebral blood perfusion involved not only subcortical regions, but also the whole brain level in the course of Parkinson’s disease. We conclude that the cerebral blood flow metabolism in patients with PD may have been redistributed, with a relative hyperperfusion in the subcortical brain regions contrast to the whole brain level of patients themselves. The feature of cerebral blood perfusion redistribution could be used to the diagnosis of PD.Acknowledgements
No acknowledgement found.References
1 Matthews DC, Lerman H, Lukic A, et al.FDG PET Parkinson's disease-related pattern as a biomarker for clinical trials in early stage disease. Neuroimage Clin, 2018, 20:572-579.
2 Ma Y, Huang C, Dyke JP, et al. Parkinson's disease spatial covariance pattern: noninvasive quantification with perfusion MRI. J Cereb Blood Flow Metab, 2010, 30(3): 505-509.
3 Borghammer P, Cumming P, et al. Artefactual subcortical hyperperfusion in PET studies normalized to global mean: lessons from Parkinson's disease. Neuroimage, 2009, 45(2): 249-257.
4 Borghammer P. Perfusion and metabolism imaging studies in Parkinson's disease. Dan Med J,. 2012, 59(6): B4466.
Figures