2557
Enhanced perivascular space contrast using T1-T2 fusion and adaptive spatial filtering1Stevens Neuroimaging and Informatics Institute, Keck School of Medicine, University of Southern California, Los Angeles, CA, United States, 2Neuroscience graduate program, University of Southern California, Los Angeles, CA, United States, 3Department of Radiology, University of Southern California, Los Angeles, CA, United States, 4Department of Radiology, Alfred Health, Melbourne, Australia
Synopsis
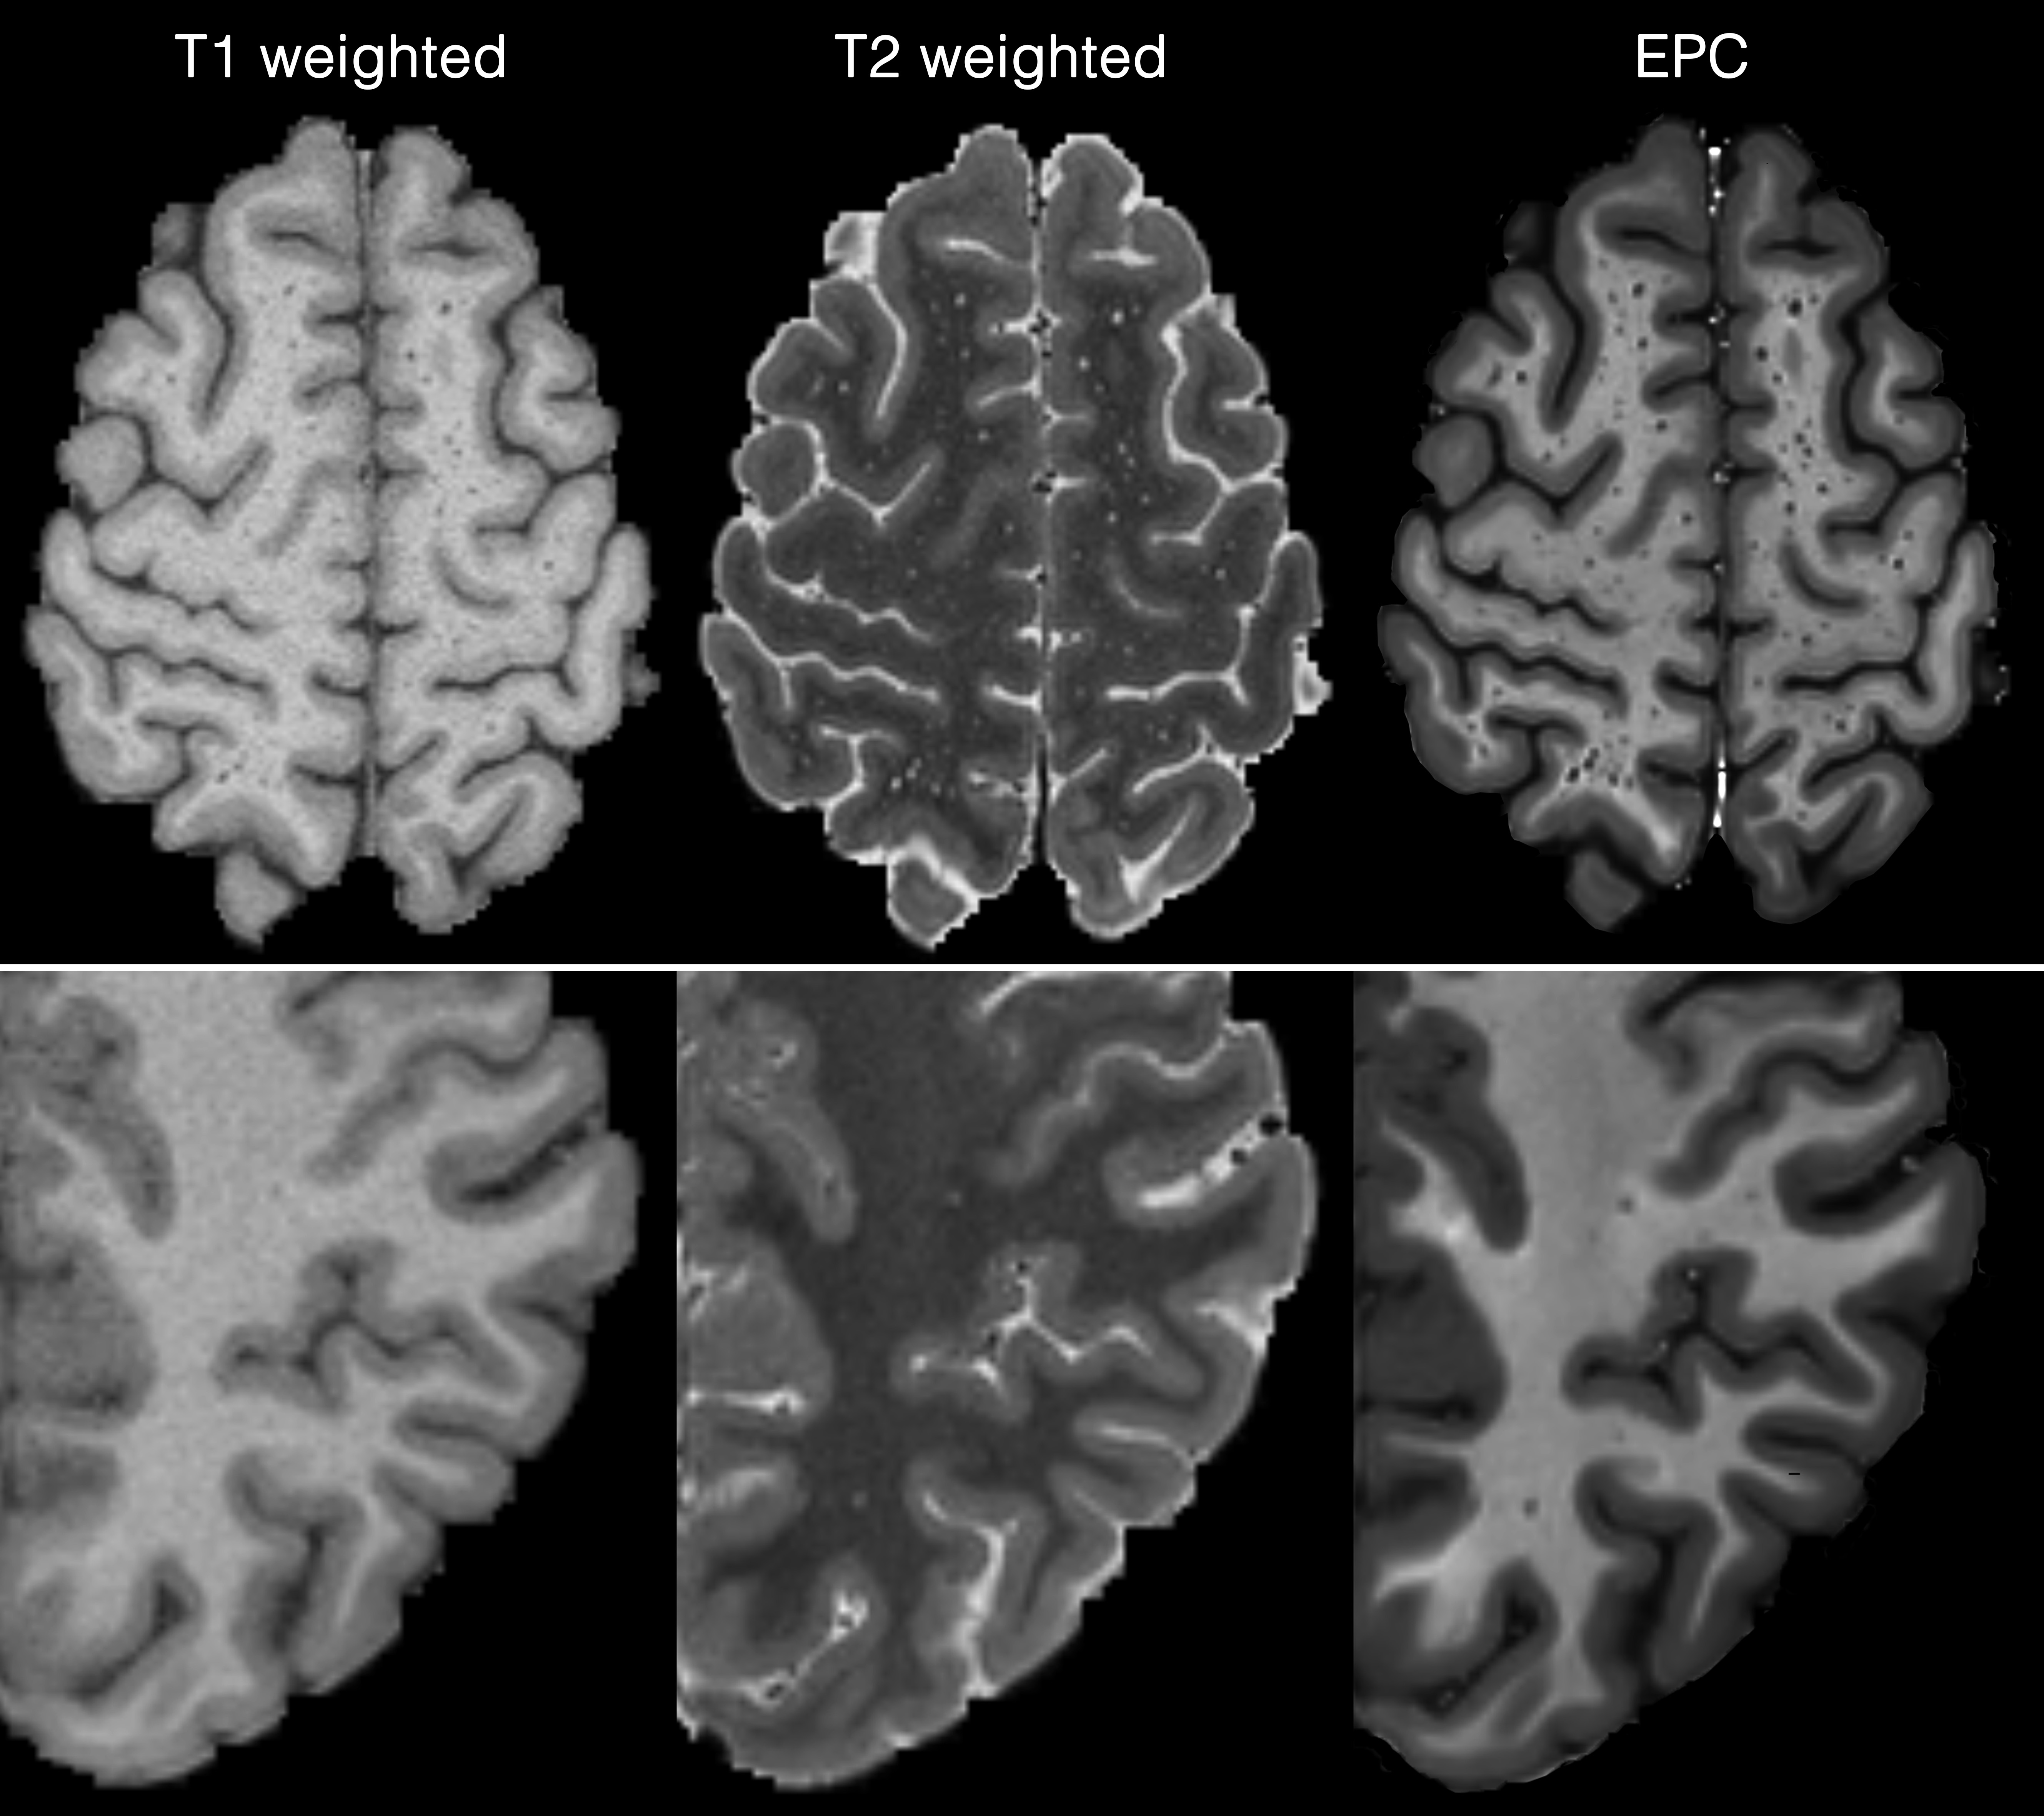
Imaging the perivascular space (PVS), also known as Virchow-Robin space, has shown to be of significant clinical value. Its role in glymphatic system1 and reported pathological changes of the PVS in neurological disorders2–10 highlight the need for methodological development specific to this compartment. Here we propose a fusion framework that enhances PVS contrast, allowing robust clinical rating. The Enhanced PVS Contrast (EPC) was achieved by combining T1- and T2-weighted images that were adaptively filtered to remove non-structural high frequency spatial noise.
Introduction
With increased MRI signal and resolution, more PVS can be detected. However, often detecting PVS from high-frequency spatial noise is challenging. Here we propose a novel post-processing framework that provides an enhanced map of PVS contrast. We used the newly proposed contrast to grade 70 healthy subjects and compared the gradings with those from the conventional grading routine (using T2-weighted images). We found that the number of PVS detected by the expert readers were significantly higher when the Enhanced PVS Contrast (EPC) was used.Method
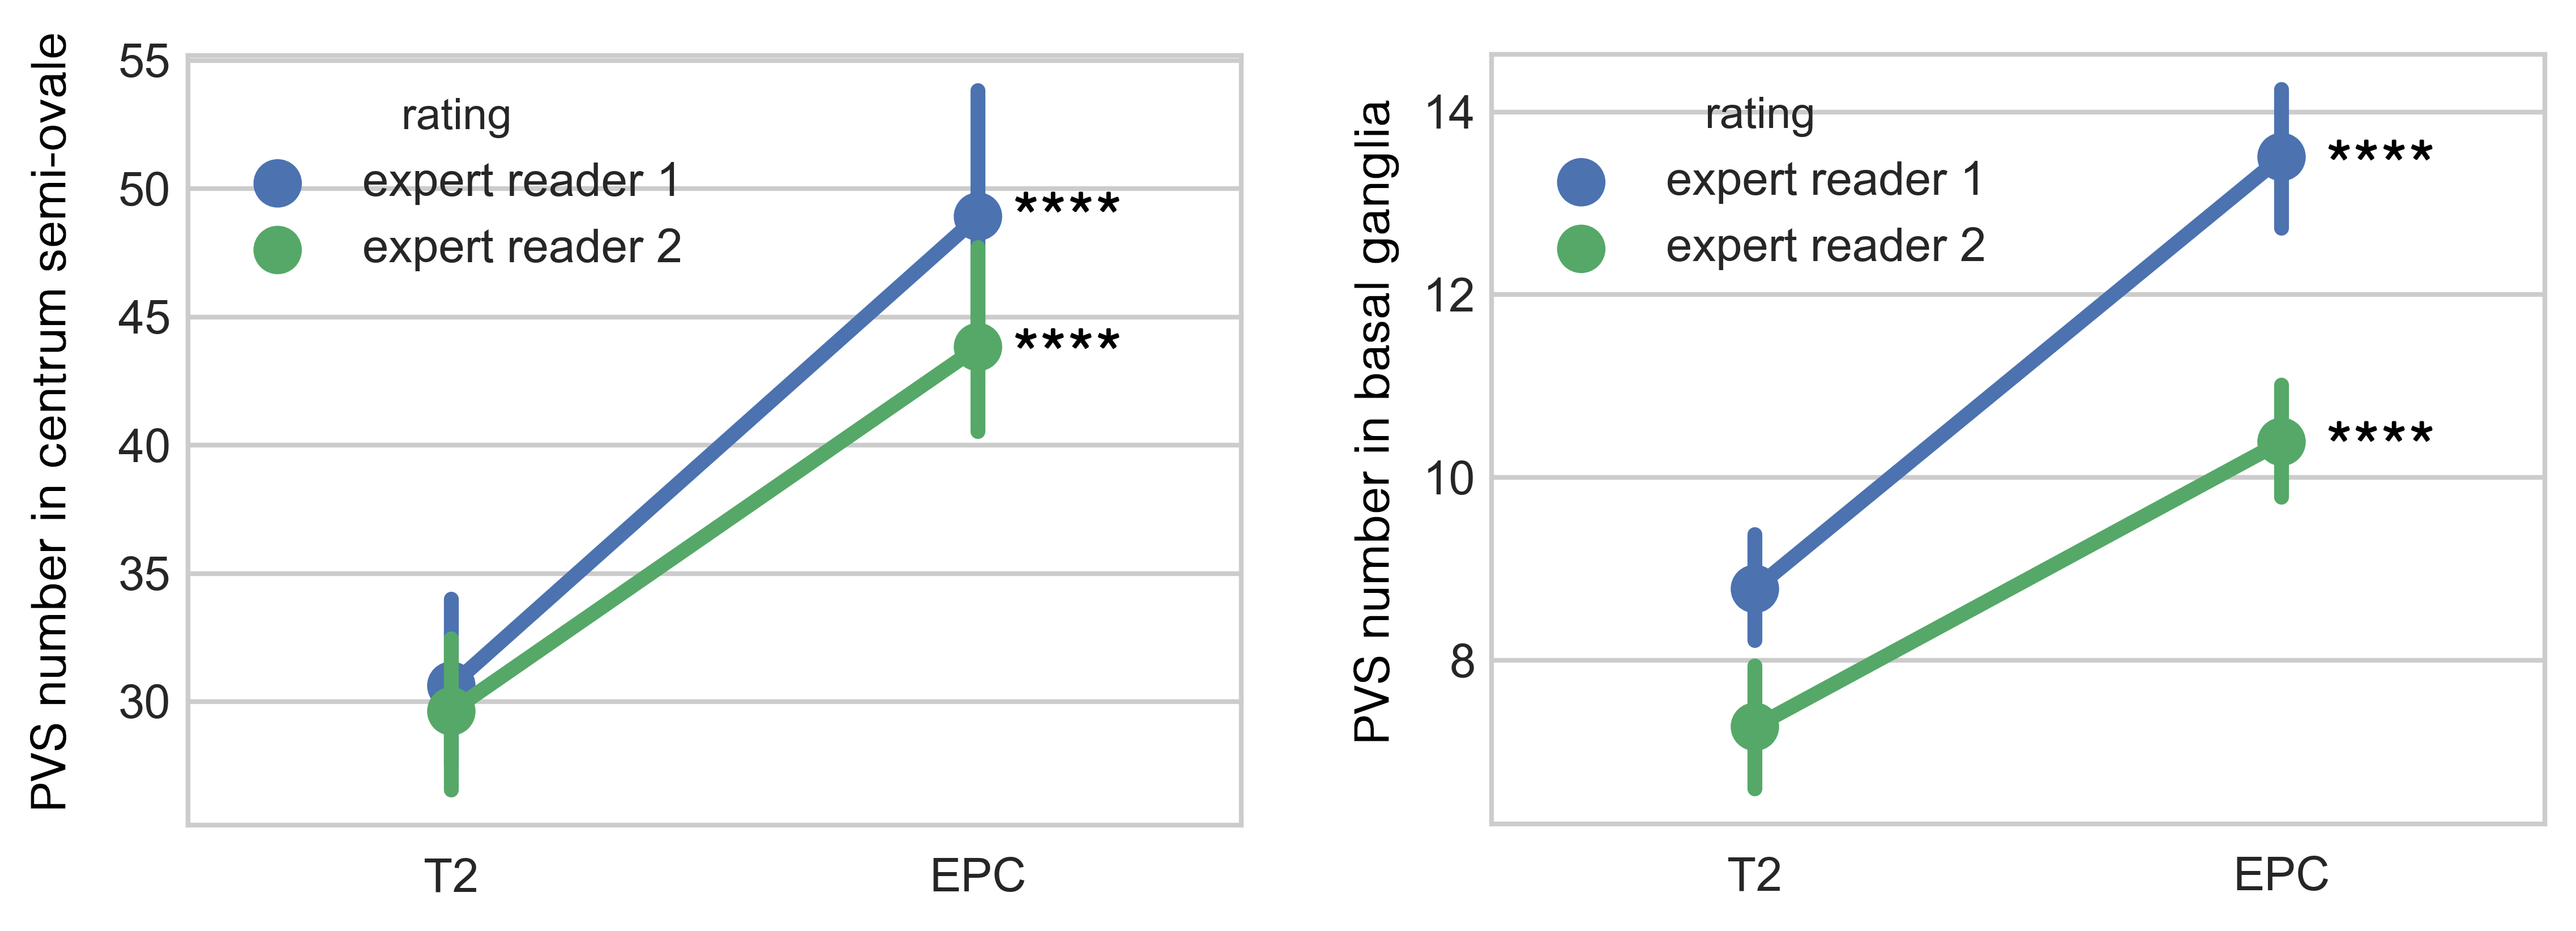
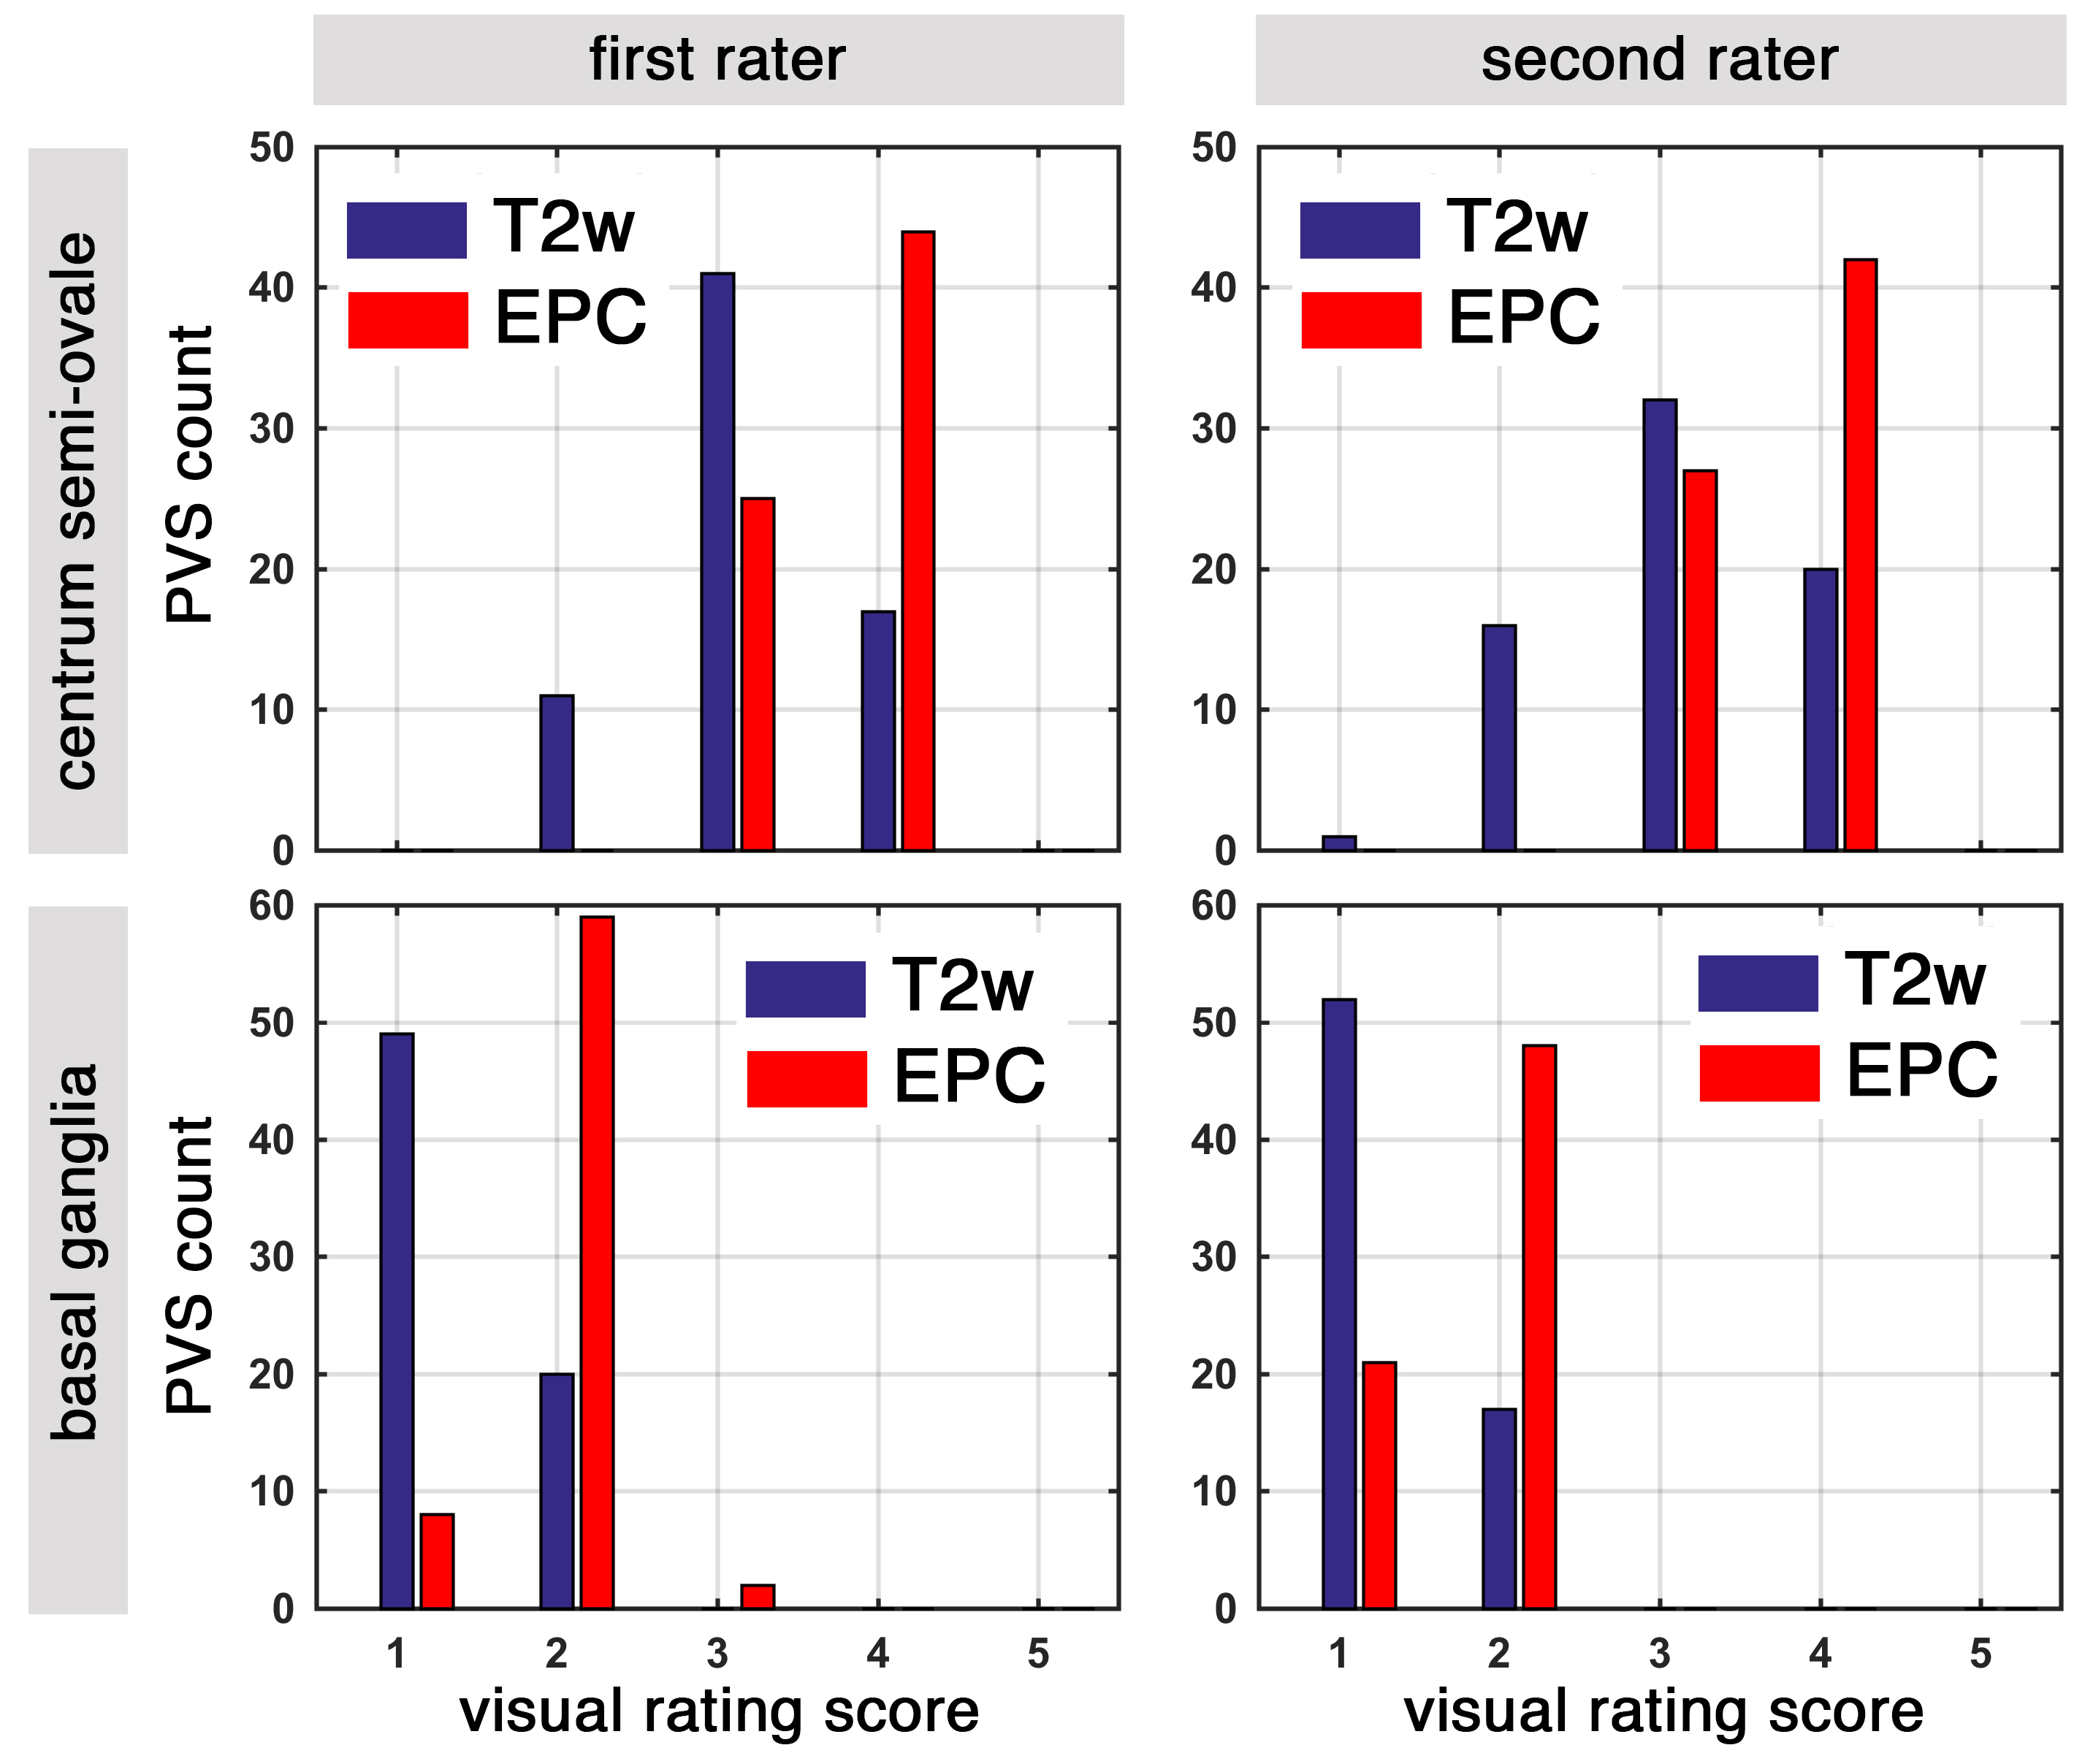
MRI images of seventy young healthy adults (age range: 22-35, average age: 28) from human connectome project11dataset were used. T1- and T2-weighted were acquired using 0.7 mm3resolution using 3T Siemens MRI scanner. To obtain the EPC, first we denoised T1- and T2-weighted images using adaptive non-local mean filtering12, which reduces the image noise, while preserving high-frequency contrast related to PVS (because PVS has spatial tubular structure). Then, we fused both modalities by multiplying the T1-wighted image by the inverse of the T2-weighted image. PVS were independently rated by two expert readers (GB and NSB) on axial T2-weighted and EPC images using a validated 4-point visual rating scale 13 in basal ganglia and centrum semi-ovale (0:no PVS, 1:1-10, 2:11–20, 3:21–40, and 4=>40 PVS). PVS contrast, derived PVS numbers and scales were compared between EPC and T2-weighted images.Result
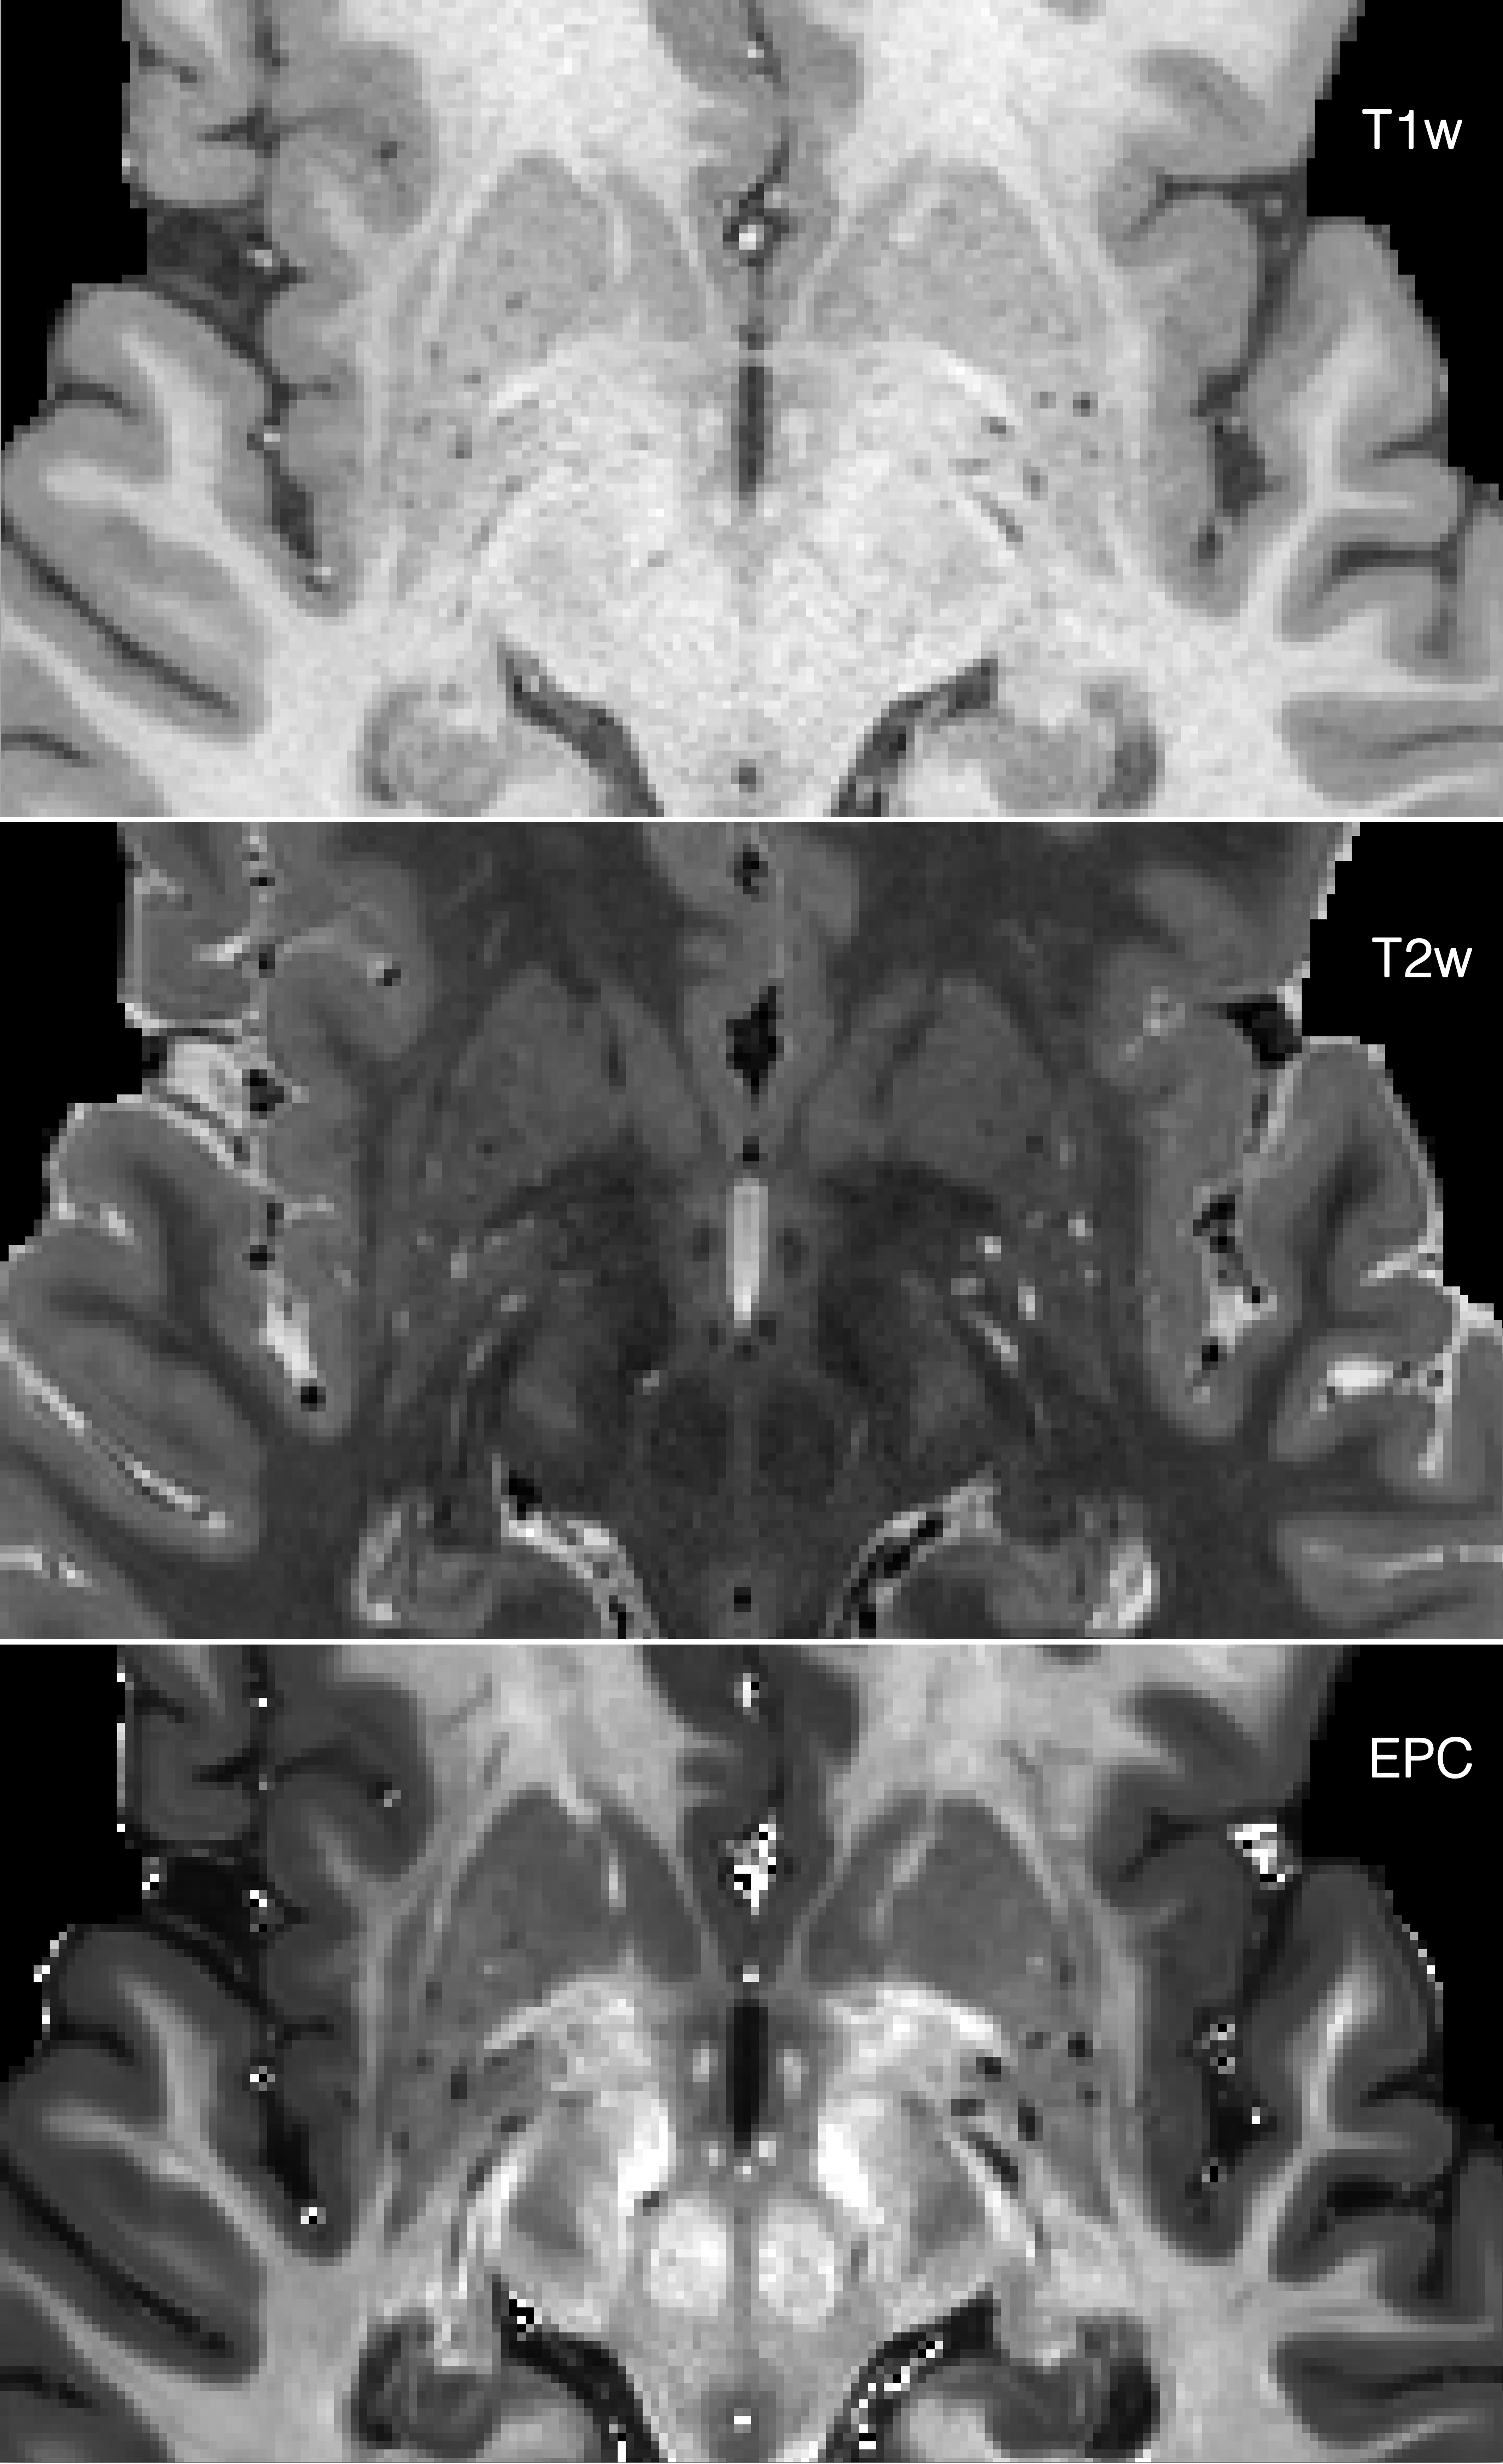
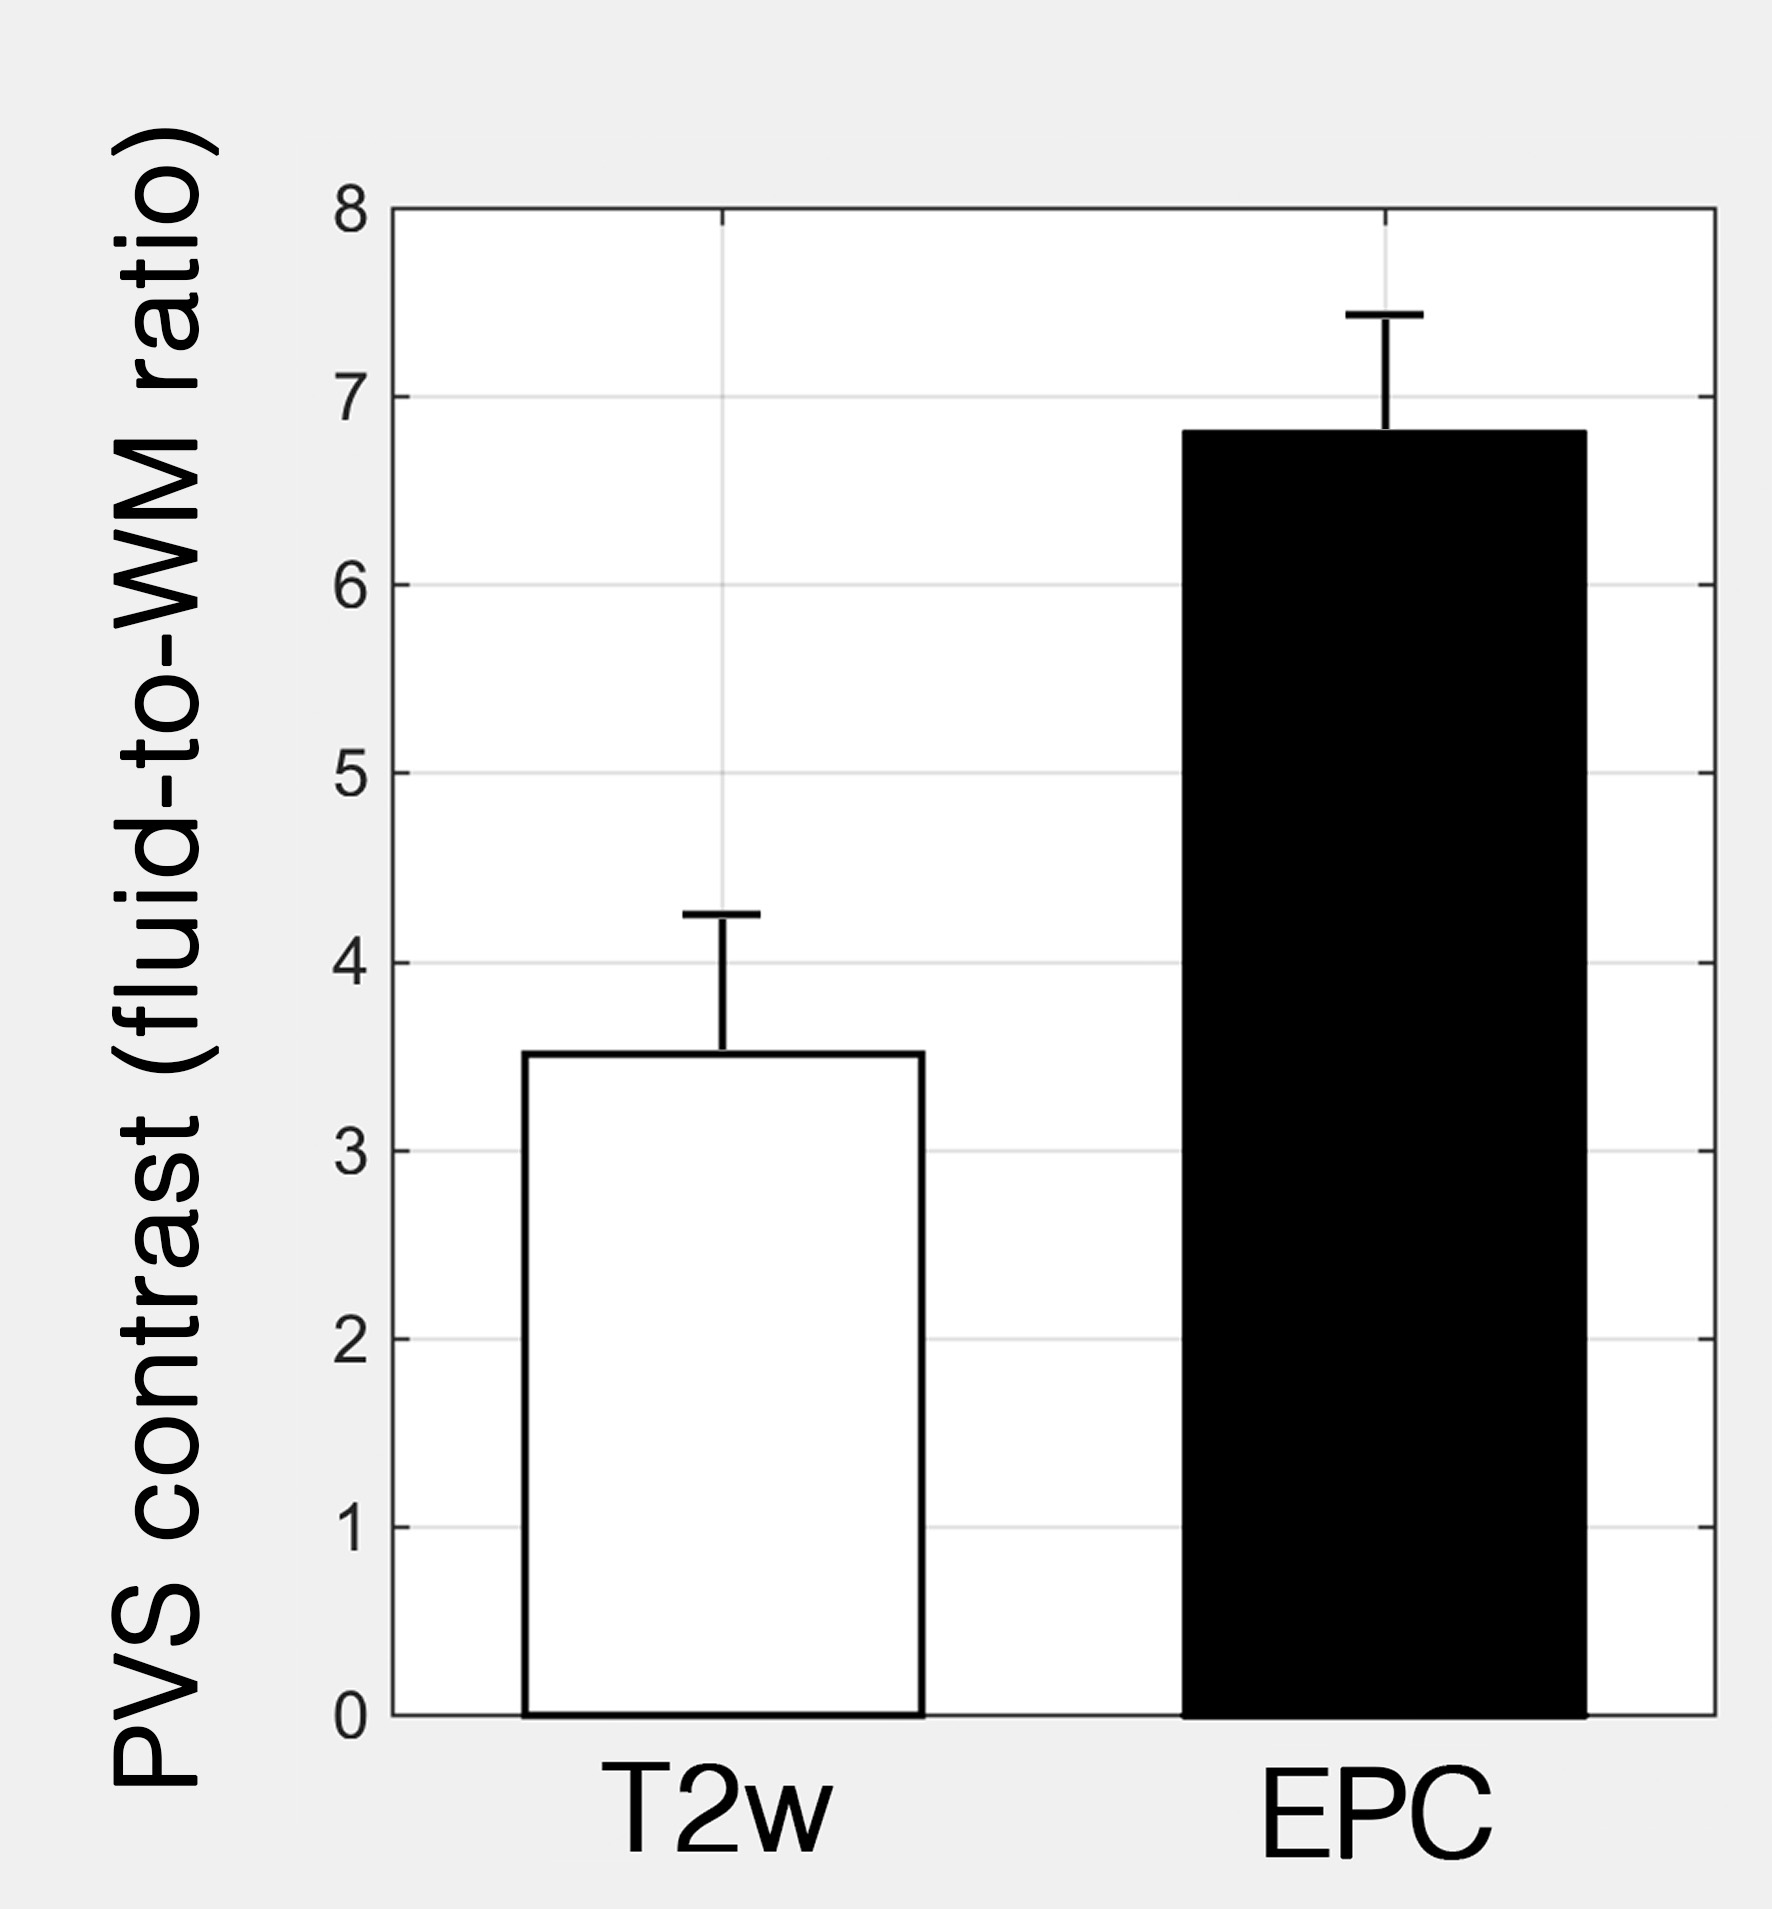
The PVS contrast (PVS-to-white matter voxels contrast) was significantly higher in EPC compared to T1- and T2-weighted images (Figure 1, 2 and 3). EPC preserved PVS even when the contrast was similar to image noise (Figure 1, second row). The adaptive non-local mean filtering removes the noise without over-smoothing the PVS voxels. Significantly higher number of PVSs were detected when EPC was used compared to T2-weighted based rating (Figure 4 and 5).Discussion
EPC provides an enhanced map of the PVS contrast and enables accurate clinical scoring. EPC does not require a new imaging sequence and utilizes the conventional T1- and T2-weighted images, which are commonly included in the clinical and research imaging sequences. The observed jump in subjects’ ratings, when EPC were used (Figure 5), highlights the need for an updated, image quality agnostic, rating standard.Acknowledgements
This work was supported by NIH grants: 2P41EB015922-21, 1P01AG052350-01 and USC ADRC 5P50AG005142.References
1.Iliff, J.J. et al. Sci. Transl. Med.4, 1–11 (2012).
2. Cavallari, M. et al. J. Neuroimaging28, 273–277 (2018).
3. Brown, R. et al. Cardiovasc. Res.cvy113-cvy113 (2018).at <http://dx.doi.org/10.1093/cvr/cvy113>
4. Laveskog, A., Wang, R., Bronge, L., Wahlund, L.-O. & Qiu, C. Am. J. Neuroradiol.39, 70 LP-76 (2018).
5. Park, L. et al. Circ. Res.121, 258–269 (2017).
6. Kalaria, R.N. Neuropharmacology134, 226–239 (2018).
7. Bacyinski, A., Xu, M., Wang, W. & Hu, J. Front. Neuroanat.11, 101 (2017).
8. Feldman, R.E. et al. Seizure54, 11–18 (2018).
9. Banerjee, G. et al. Brain140, 1107–1116 (2017).
10. Krueger, M. & Bechmann, I. Glia58, 1–10 (2010).
11. Essen, D.C. Van et al. Neuroimage80, 62–79 (2013).
12. Manjón, J. V, Coupé, P., Martí‐Bonmatí, L., Collins, D.L. & Robles, M. J. Magn. Reson. Imaging31, 192–203 (2010).
13. Potter, G.M., Chappell, F.M., Morris, Z. & Wardlaw, J.M. Cerebrovasc. Dis.39, 224–31 (2015).
Potter, G.M., Chappell, F.M., Morris, Z. & Wardlaw, J.M. Cerebrovasc. Dis.39, 224–31 (2015).
Figures