2553
Low b-value diffusion weighted imaging to evaluate cerebrospinal fluid dynamics1Radiology, Nagoya University, Nagoya, Japan, 2Siemens Japan K.K., Tokyo, Japan
Synopsis
We evaluated the signal intensity of the CSF on low b-value (b=500 s/mm2) diffusion weighted images (DWI) in cases with ventricular dilatation versus controls by a scoring method. Although low b-value DWI cannot quantify the absolute flow speed, it may be possible to evaluate the distribution of altered CSF dynamics within the cranium in the cases of ventricular dilatation. We also evaluated the characteristic signal void findings adjacent to the septum pellucidum in the cases with ventricular dilatation, which was speculated to be due to a standing wave in a thinned septum pellucidum.
Purpose
In routine clinical practice, diffusion-weighted imaging (DWI) with a b-value of 1000 s/mm2 is preferred. In contrast, usually we do not use the b=500 s/mm2 image for the clinical diagnosis because the interpretation of the signal intensity is complicated by a larger effect of T2 shine through, and incomplete and inhomogeneous signal suppression of cerebrospinal fluid (CSF). We considered that the incomplete and inhomogeneous signal suppression of the CSF might contain information regarding CSF dynamics.
The main purpose for this study is to investigate if an alteration of CSF dynamics can be visualized on the b=500 s/mm2 image. In addition, we found characteristic signal voids adjacent to the septum pellucidum, and also made an evaluation of this finding.
Subjects and Methods
The subjects of this retrospective study consisted of controls (Figure 1: n=50) and patients with ventricular dilatation (Figure 2: n = 50). We acquired DWI by 1.5T clinical scanner (MAGNETOM Avanto) with the following parameters: TR=3500ms, TE=94ms, b-value=0, 500, 1000s/mm2, no flow compensation, bandwidth=1132Hx/Px., FOV=200mm, matrix=192x144.
The signal intensity of the CSF on the b=500 s/mm2 DWI were evaluated qualitatively in the lateral, 3rd and 4th ventricles by the score shown in Figure 3. Signal void in the Sylvian fissure and the fronto-parietal sulci were also evaluated. The scores were compared between the ventricular dilatation group and controls using a Pearson’s chi-square test. Scores for the signal void adjacent to the septum pellucidum were also compared between the ventricular dilatation and control groups for the thickness, the length and the shape of the signal void.
Results
Figure 3 show the results. The CSF signal intensities on the b=500 s/mm2 DWI were significantly lower in the ventricular dilatation group in the anterior horn of the lateral ventricle (p<0.01), the body of the lateral ventricle (p<0.05), the atrium of the lateral ventricle (p<0.01), the temporal horn of the lateral ventricle (p<0.001) and in the 3rd ventricle (p<0.001). However, there was no significant difference in the 4th ventricle. The scores for the signal void in the Sylvian fissure were significantly higher in the ventricular dilatation group (p<0.05), indicating that the signal void occupied a larger area.
For the signal void adjacent to the septum pellucidum on the b=500 s/mm2 DWI between the ventricular dilatation and control groups. The ventricular dilatation group had significantly higher scores compared to controls in the thickness (p<0.001), the length (p<0.001) and the shape of the signal void (p<0.001).
Discussion
The findings of the current study indicate that CSF within the lateral ventricle on the b=500 s/mm2 DWI had a higher signal intensity in the ventricle dilatation group. The signal intensity of a diffusion-weighted image depends mainly on the relaxation time, proton density, intra-voxel diffusion and perfusion. In the CSF, the perfusion fraction may correspond to CSF flow. When the MPG is lower such as b=500 s/mm2, the signal of the CSF is not suppressed completely. Therefore, our finding that the signal intensity of the CSF within the ventricle was higher in the cases with ventricular dilatation means that the motion of the water molecules is slower compared to that of controls (1,2).
The bead-like signal void was more frequently seen in the cases with a greater ventricular dilatation. In addition, in the cases with perforation of the septum pellucidum, the signal void could only be seen in the area where septum present (Figure 4). Thus we speculate that the septum pellucidum becomes thinner with ventricular dilatation and may behave as a drum membrane, where exposure to vibration may cause standing waves (3). A source of the vibration could be arterial pulsation, however, the septum pellucidum does not contain a large artery. We speculated that the vibration of the MR scanner while scanning may be a source, and performed a phantom experiment with a plastic membrane. Figure 5 shows an image of the phantom with the same imaging sequence as applied in the current study. On the image, there is a bead-like signal void along the plastic membrane from which the vibration was only due to the scanning of the DWI.
Conclusion
We evaluated the signal of CSF onb=500 s/mm2 diffusion image and found that the signal intensity may reflect changes in CSF dynamics in the cases of ventricular dilatation. Although low b-value DWI cannot quantify the absolute flow speed of CSF, it may be possible to evaluate the distribution of altered CSF dynamics. In the current study, a characteristic bead-like signal void along the septum pellucidum could be seen in the cases with ventricular dilatation, which was speculated to be due to a standing wave in a thinned septum pellucidum.Acknowledgements
No acknowledgement found.References
1. Le Bihan D, Breton E, Lallemand D, Grenier P, Cabanis E, Laval-Jeantet M. MR imaging of intravoxel incoherent motions: application to diffusion and perfusion in neurologic disorders. Radiology 1986;161(2):401-7.
2. Le Bihan D, Breton E, Lallemand D, Aubin ML, Vignaud J, Laval-Jeantet M. Separation of diffusion and perfusion in intravoxel incoherent motion MR imaging. Radiology 1988;168(2):497-505
3. Sarwar M. The septum pellucidum: normal and abnormal. AJNR Am J Neuroradiol 1989;10(5):989-1005.
Figures
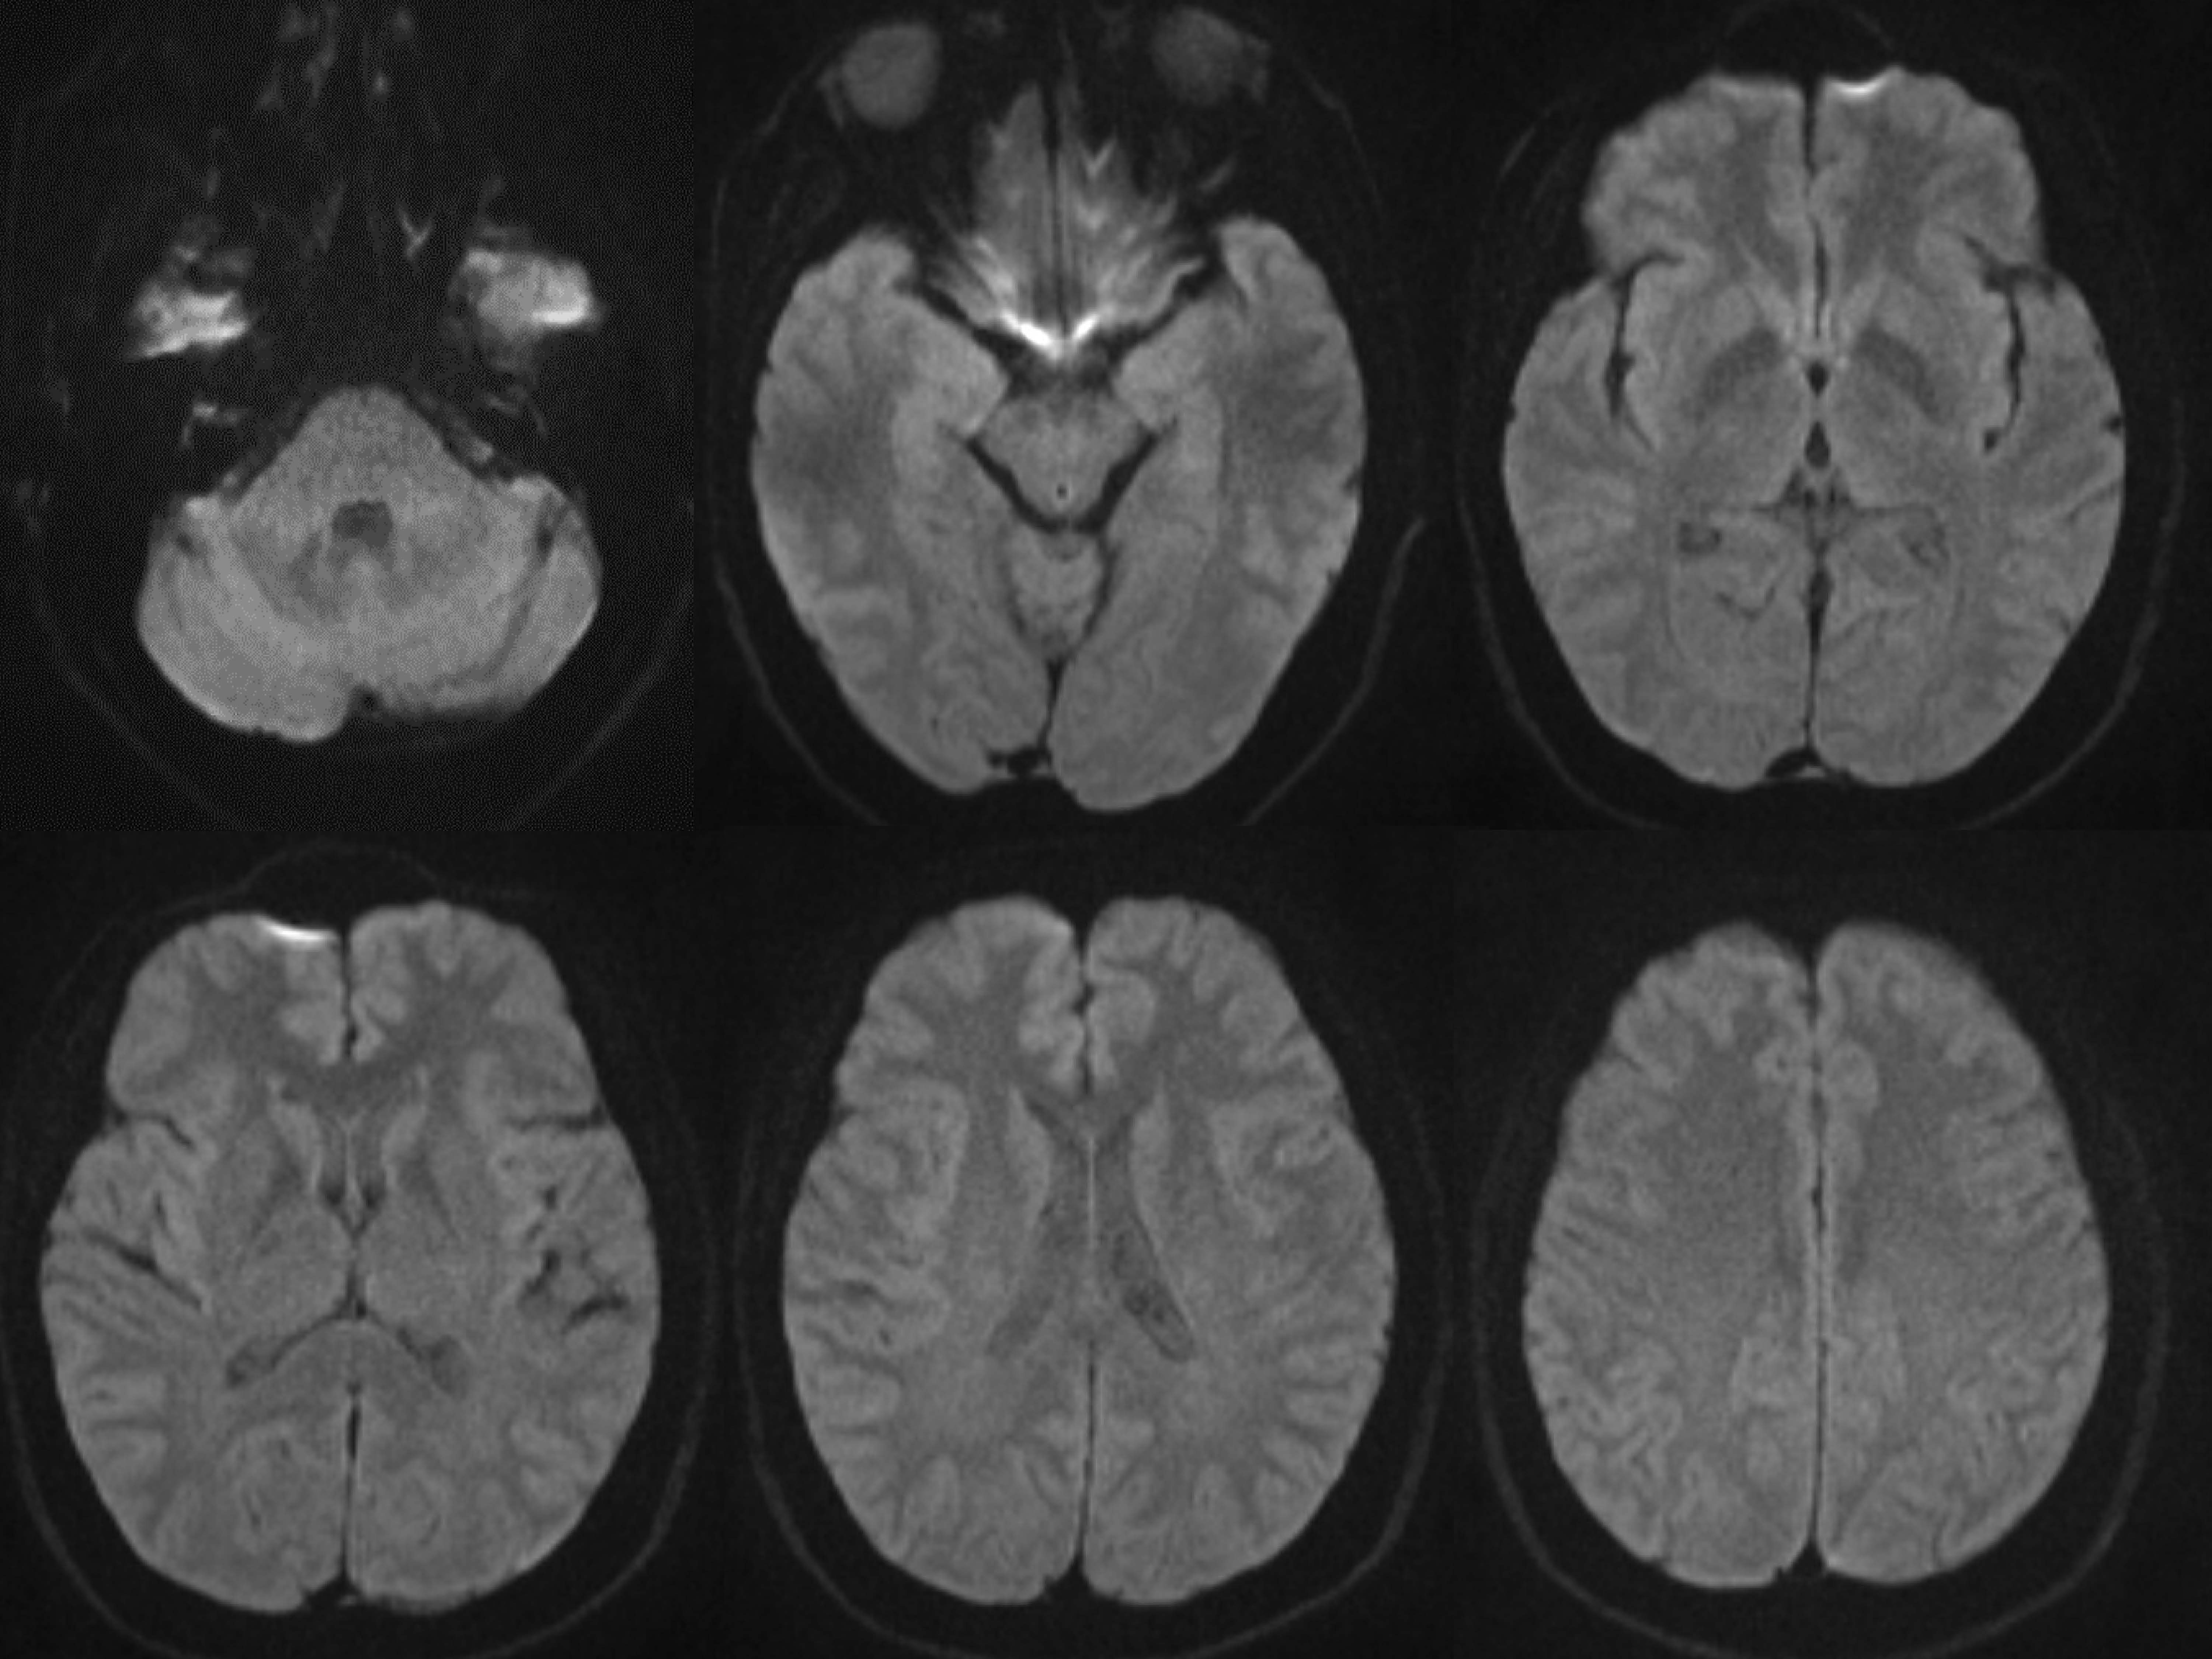
Control case (60y.o. Female) on the b=500 s/mm2 DWI
Generally, the CSF within the ventricle had a higher signal intensity compared to the Sylvian fissure. However, signal void at the foramen of Monroe and aqueduct is prominent. The low signal intensity within the Sylvian fissure is limited to the lower area.
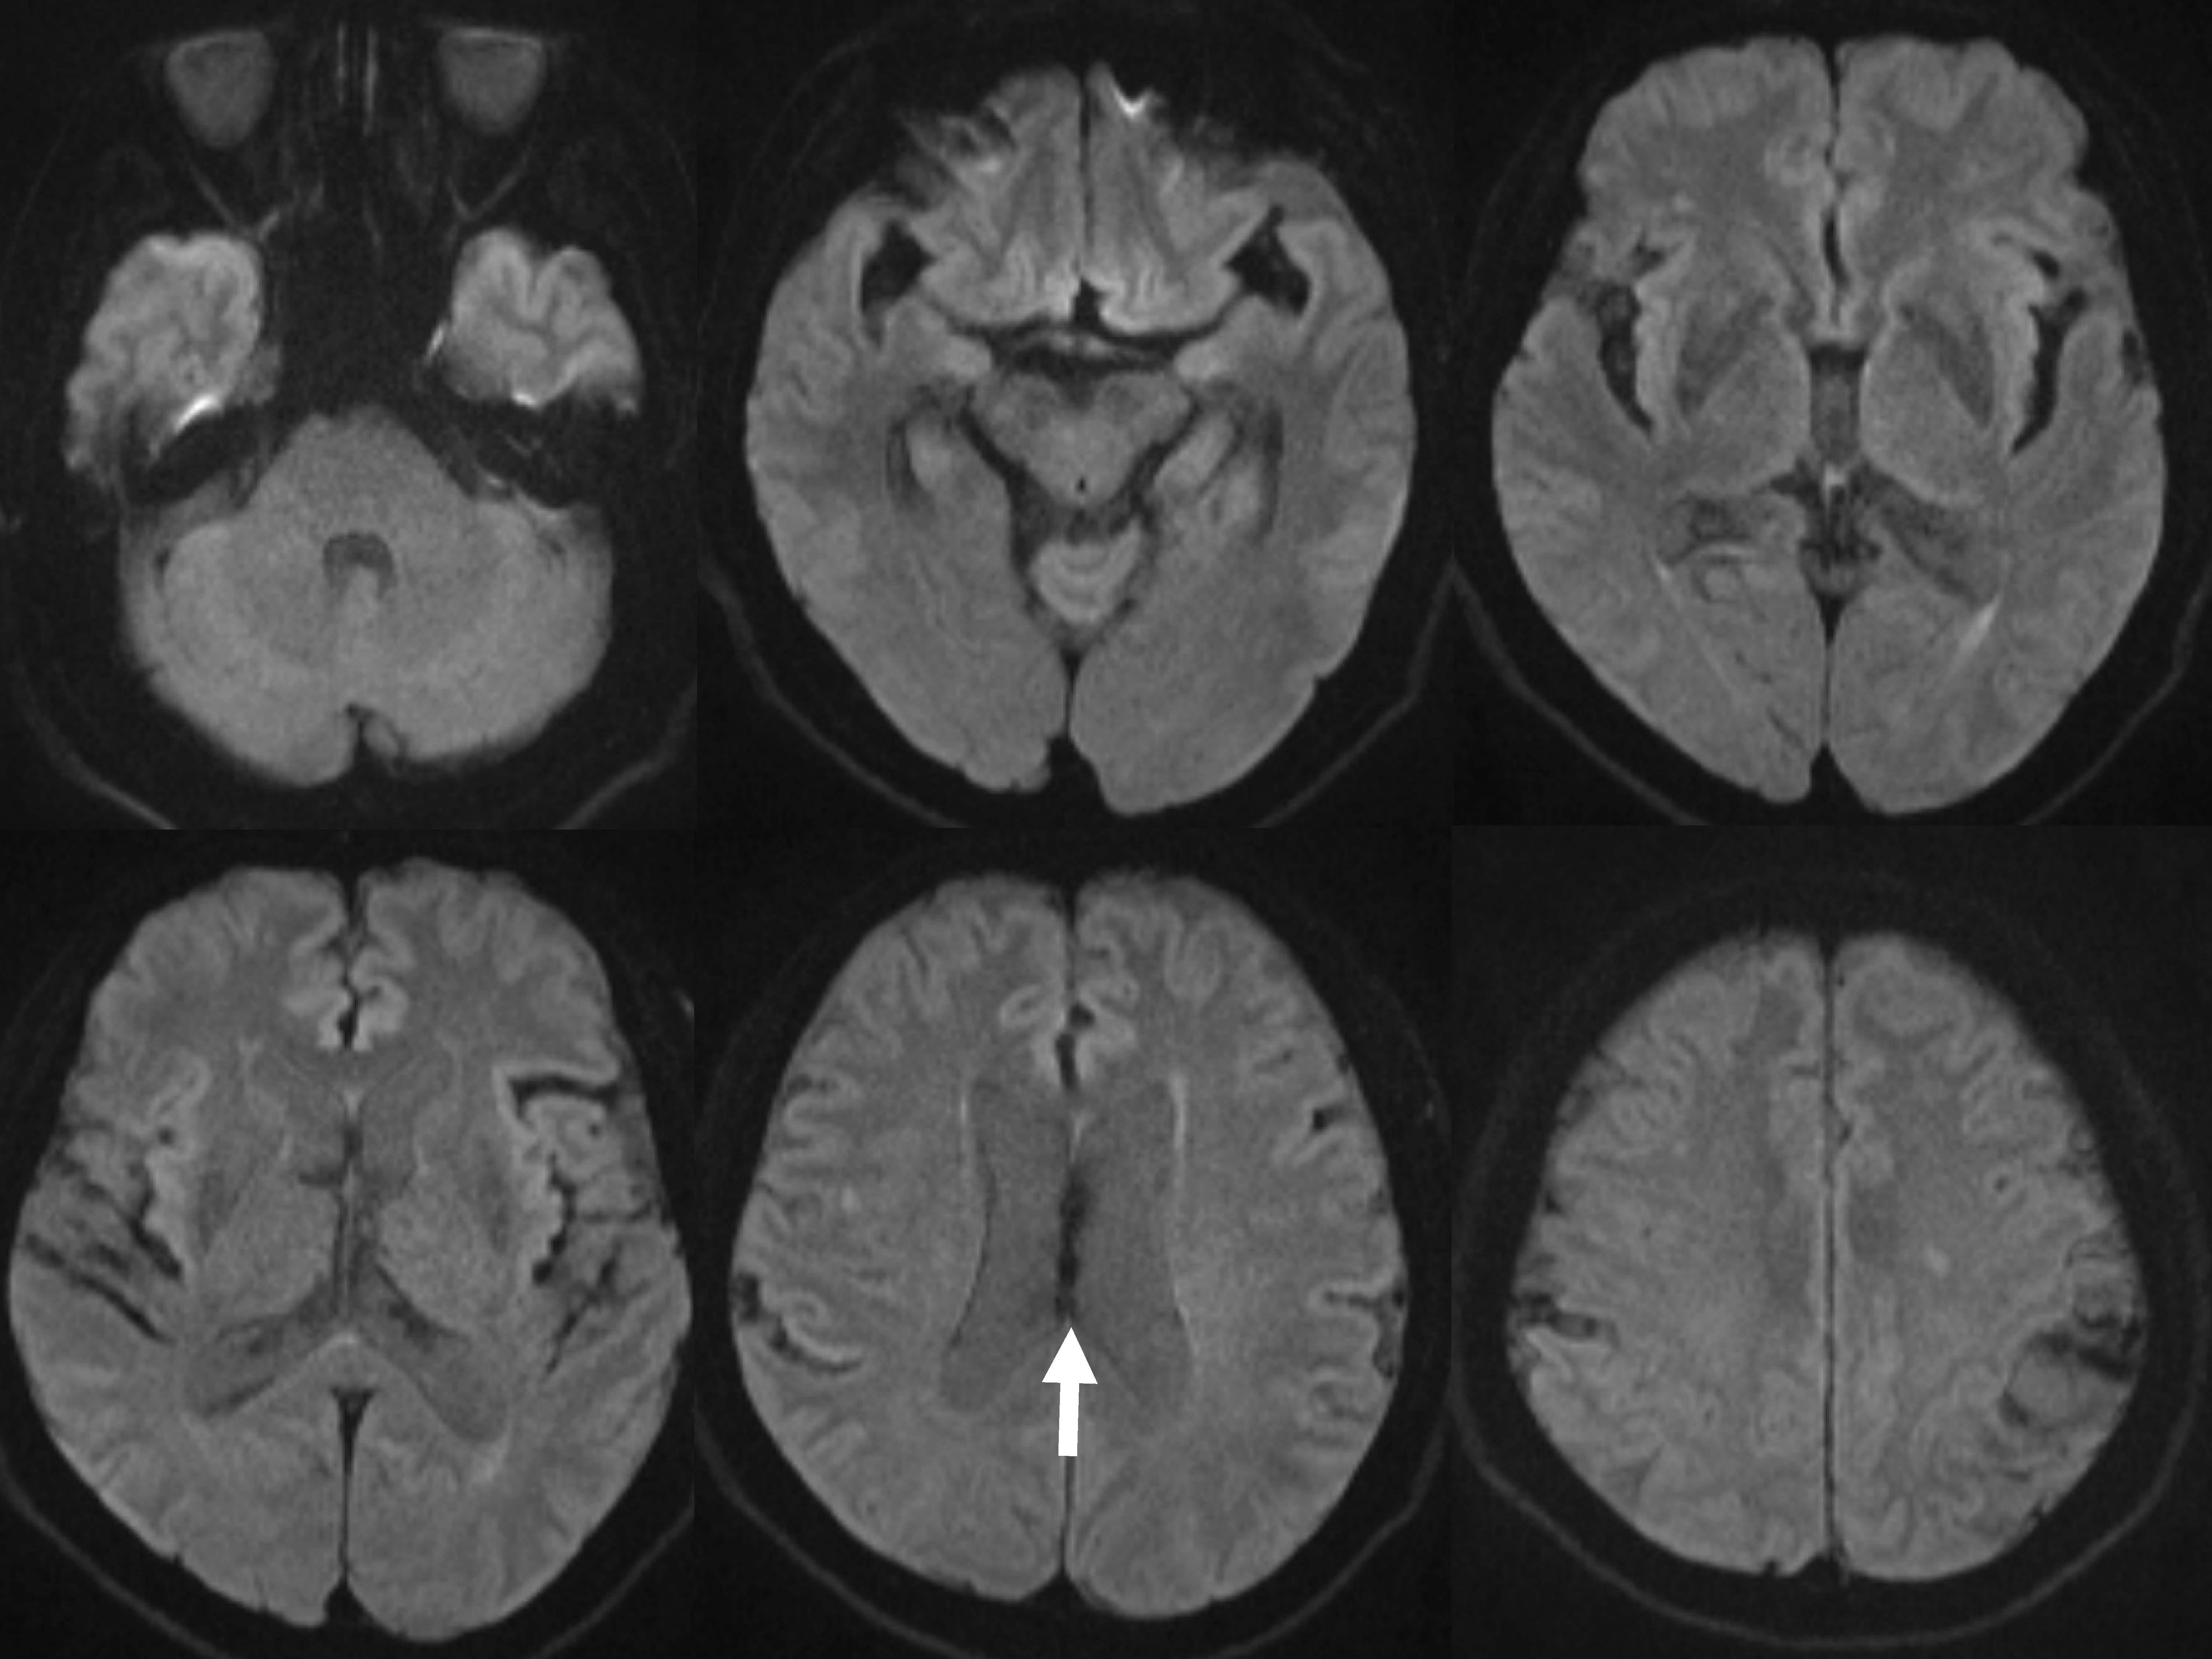
Ventricular dilatation case (76y.o. Male) on the b=500 s/mm2 DWI
The CSF within the ventricle had a higher signal intensity compared to the control (Figure 2). The signal void at the foramen of Monroe and aqueduct is less prominent. The low signal intensity within the Sylvian fissure can be seen in a wide area. The CSF in the cortical sulci in the fronto-parietal area also has a low signal intensity. The characteristic bead-like signal void along the septum pellucidum is indicated (arrow).
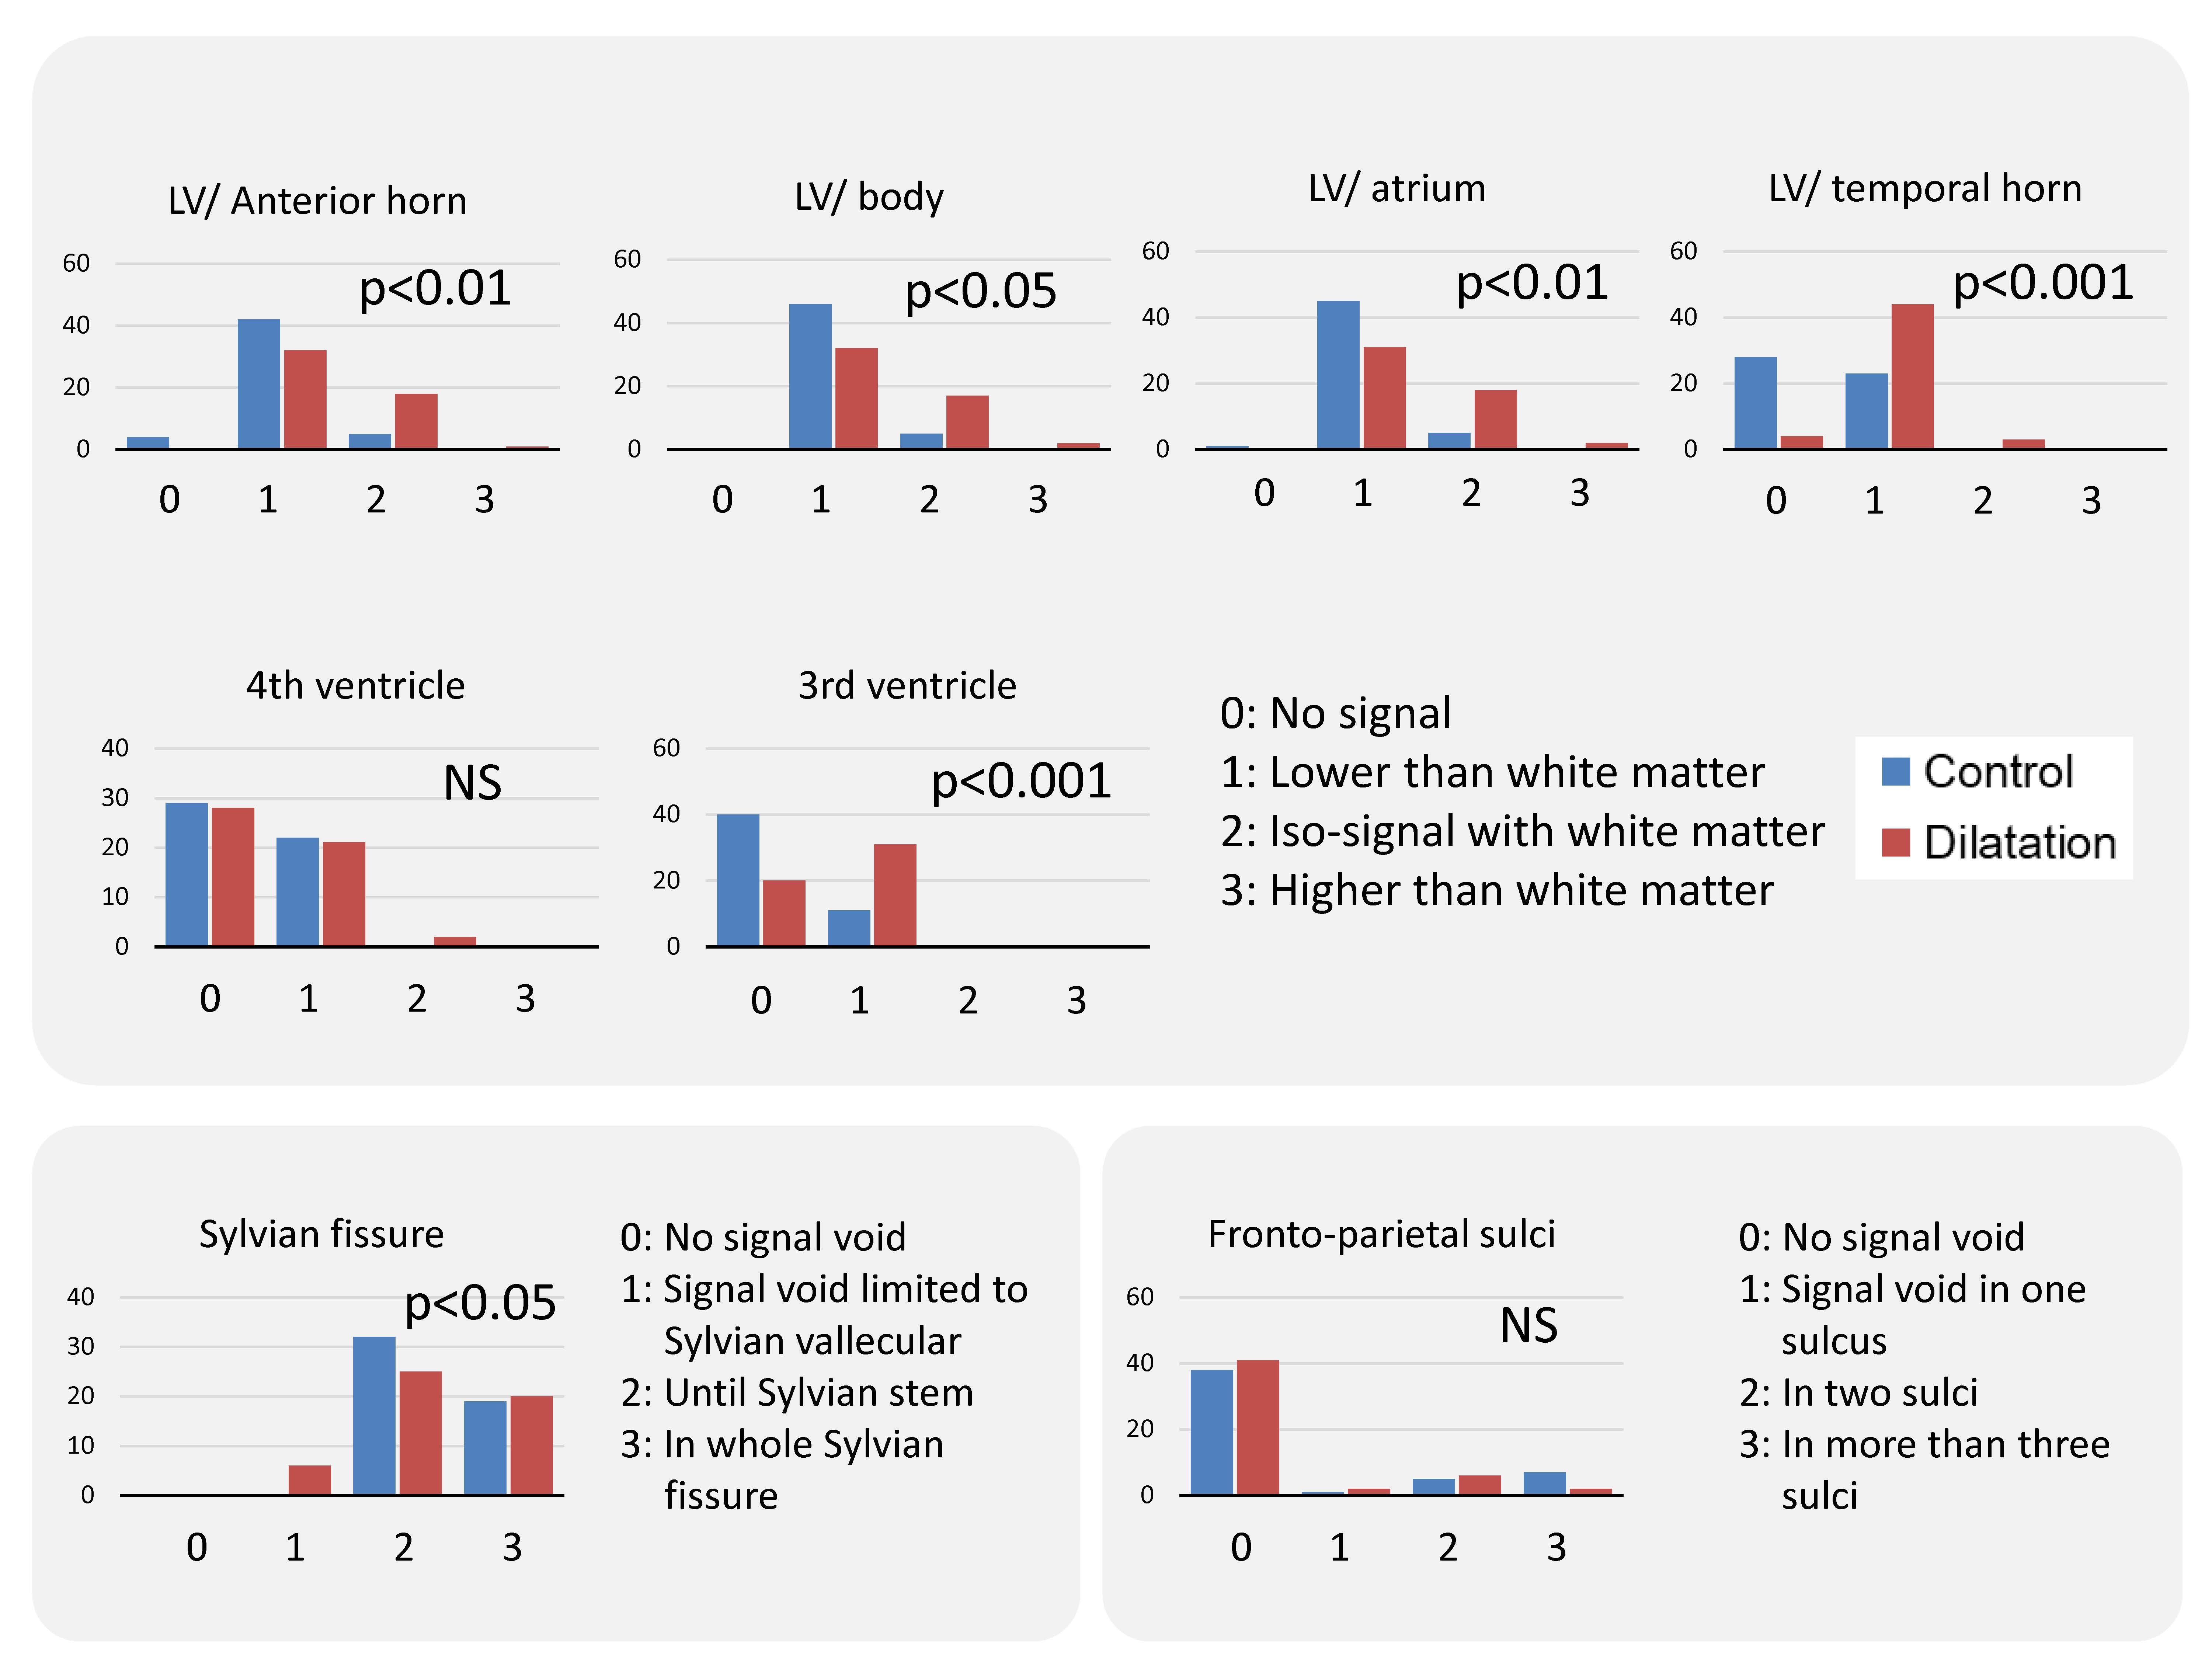
Distribution of the scores
The CSF signal intensity was significantly lower in the ventricular dilatation group in the anterior horn of the lateral ventricle, the body of the lateral ventricle, the atrium of the lateral ventricle, the temporal horn of the lateral ventricle and in the 3rd ventricle. However, there was no significant difference in the 4th ventricle. The scores for the signal void in the Sylvian fissure were significantly higher in the ventricular dilatation group. There were no significant differences for the signal void in the fronto-parietal cerebral sulci.
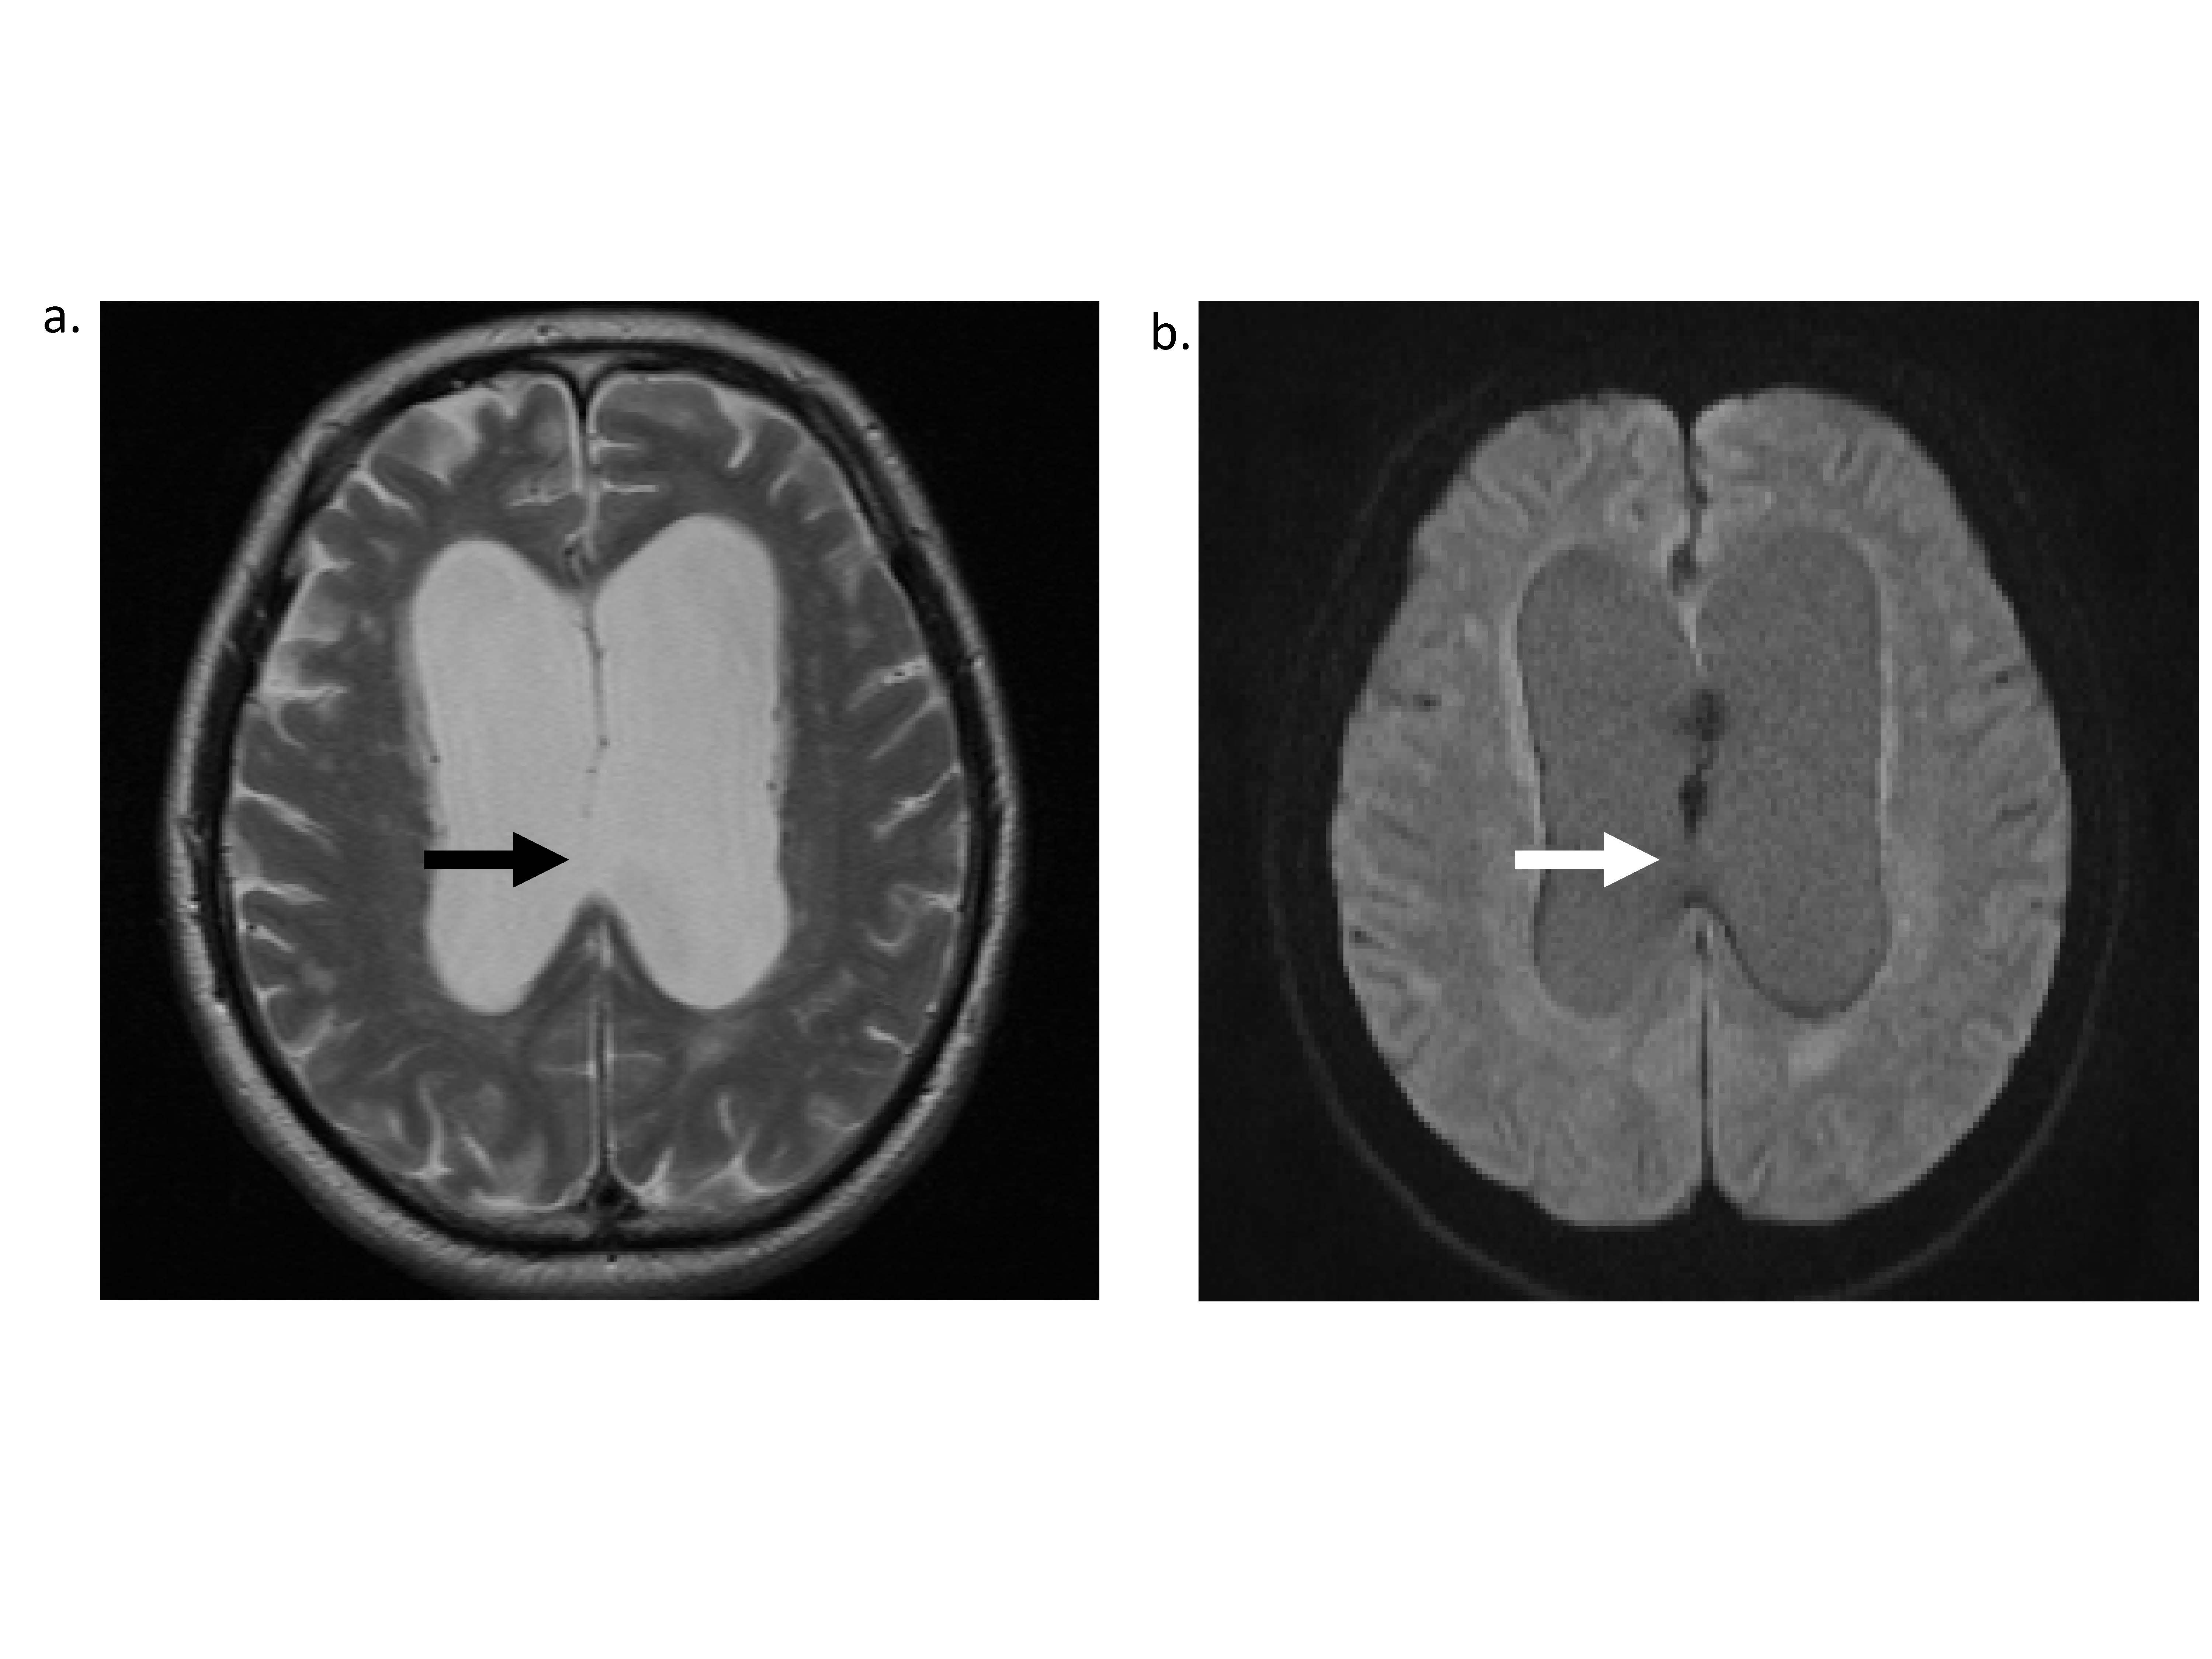
A case with perforation in the septum pellucidum.
A case with ventricular dilatation and perforation in the posterior part of the septum pellucidum (arrow in figure a: T2 weighted image). The bead-like signal void can be seen in the area of the septum. In contrast, the signal void is not seen in the area of the septal defect (arrow in figure b: b=500 s/mm2 DWI)
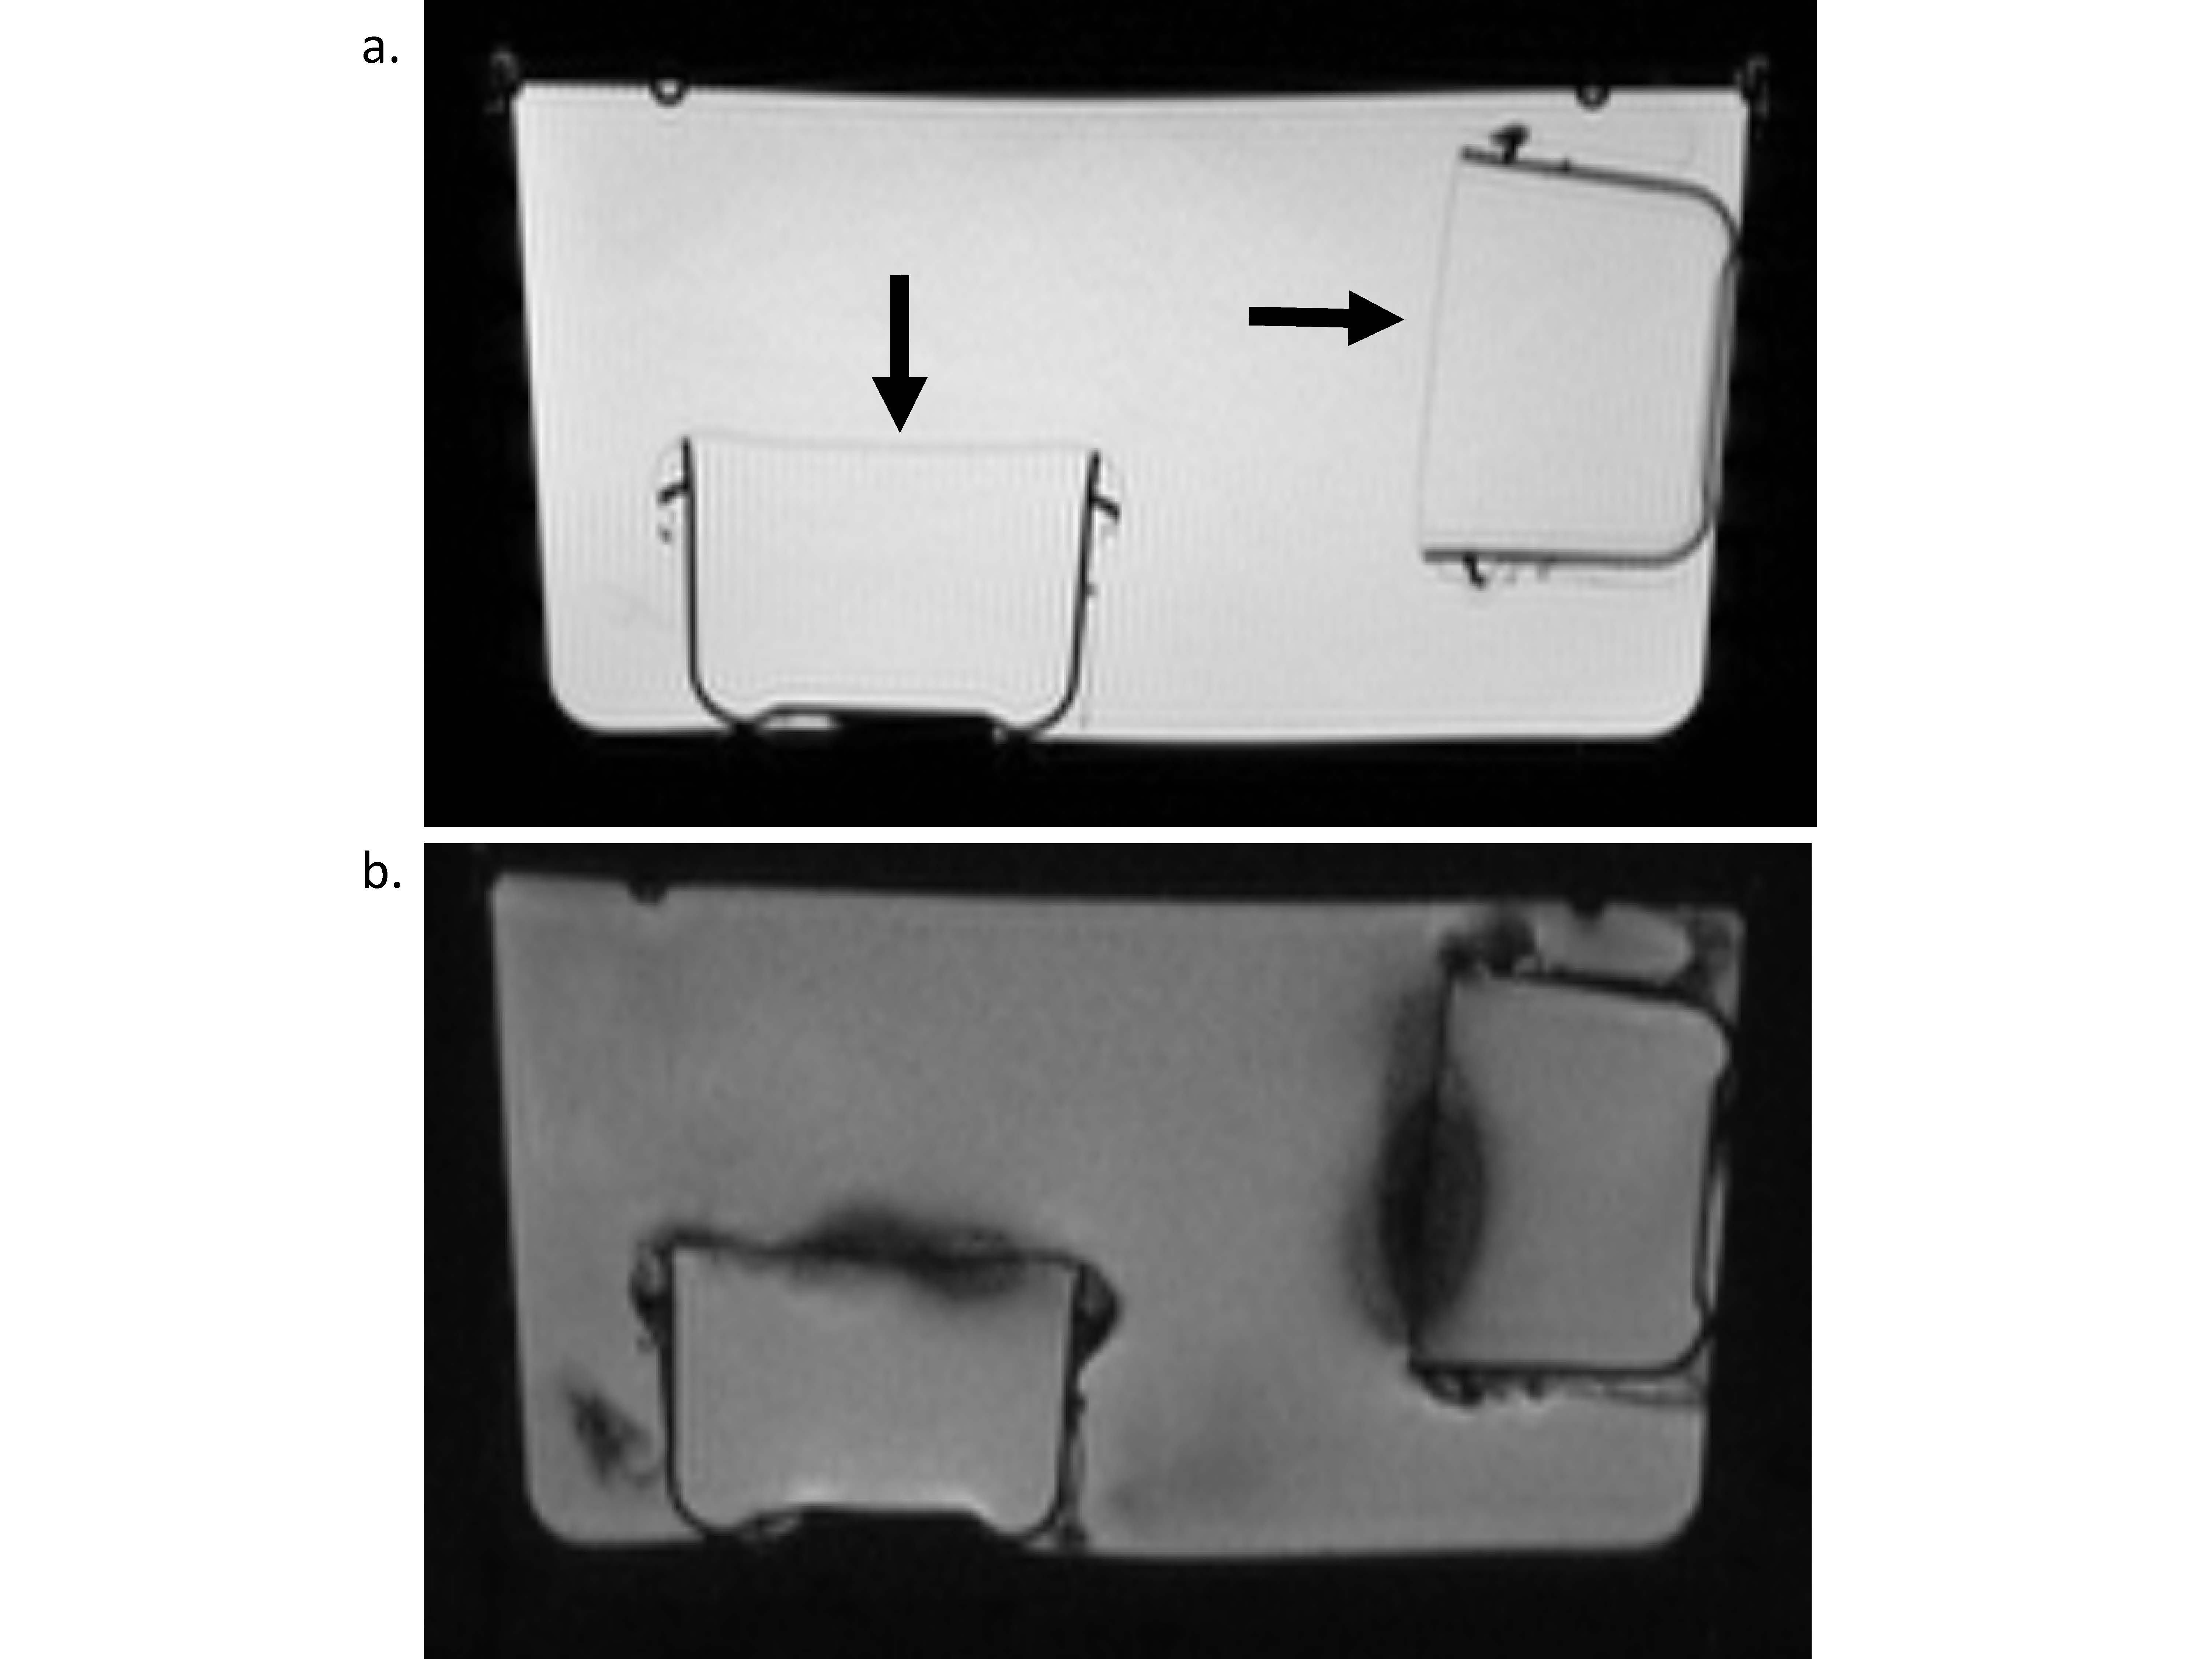
Phantom study
We created a phantom in which plastic membranes (0.08mm thickness) were mounted within water. A HASTE image (a) shows the structure of the phantom with plastic membranes (arrows). A low b-value DWI identical to the clinical scan was applied to this phantom (b), which showed like a signal void along the plastic membrane. Although this phenomenon may not be identical to the signal void along the septum pellucidum, we speculate that the standing wave produced by vibration from the DWI scanning may account for the observed signal void on the low b-value DWI.