2550
Visualization of irregular CSF flow by dynamic iMSDE SSFP using acceleration- selective motion - sensitized gradient (AS-MSG)1Department of Radiology, Tokai University Hospital, Isehara, Japan, 2Division of Diagnostic Image Analysis Graduate School of Medicine, Tohoku University, Sendai, Japan, 3Healthcare, Philips Electronics Japan Ltd., Shinagawa, Japan, 4Department of Radiology, Tokai University School of Medicine, Isehara, Japan, 5Course of Electrical and Electronic Engineering, Graduate School of Engineering, Tokai University, Hiratsuka, Japan, 6Department of Neurosurgery, Tokai University School of Medicine, Isehara, Japan
Synopsis
We
reported a technique to visualize the irregular flow of cerebrospinal fluid
(CSF) by using dynamic improved motion-sensitized driven-equilibrium
steady-state free precession (dynamic iMSDE SSFP).
The
purpose of this study was to investigate the characteristics of intracranial
CSF visualization with dynamic SSFP using acceleration selective motion
sensitized gradient (AS-MSG).
The
dynamic SSFP using AS-MSG distinguished acceleration flow in CSF from constant
flow. This technique is suggested to contribute to the diagnosis of various
diseases in the CSF space.
Introduction
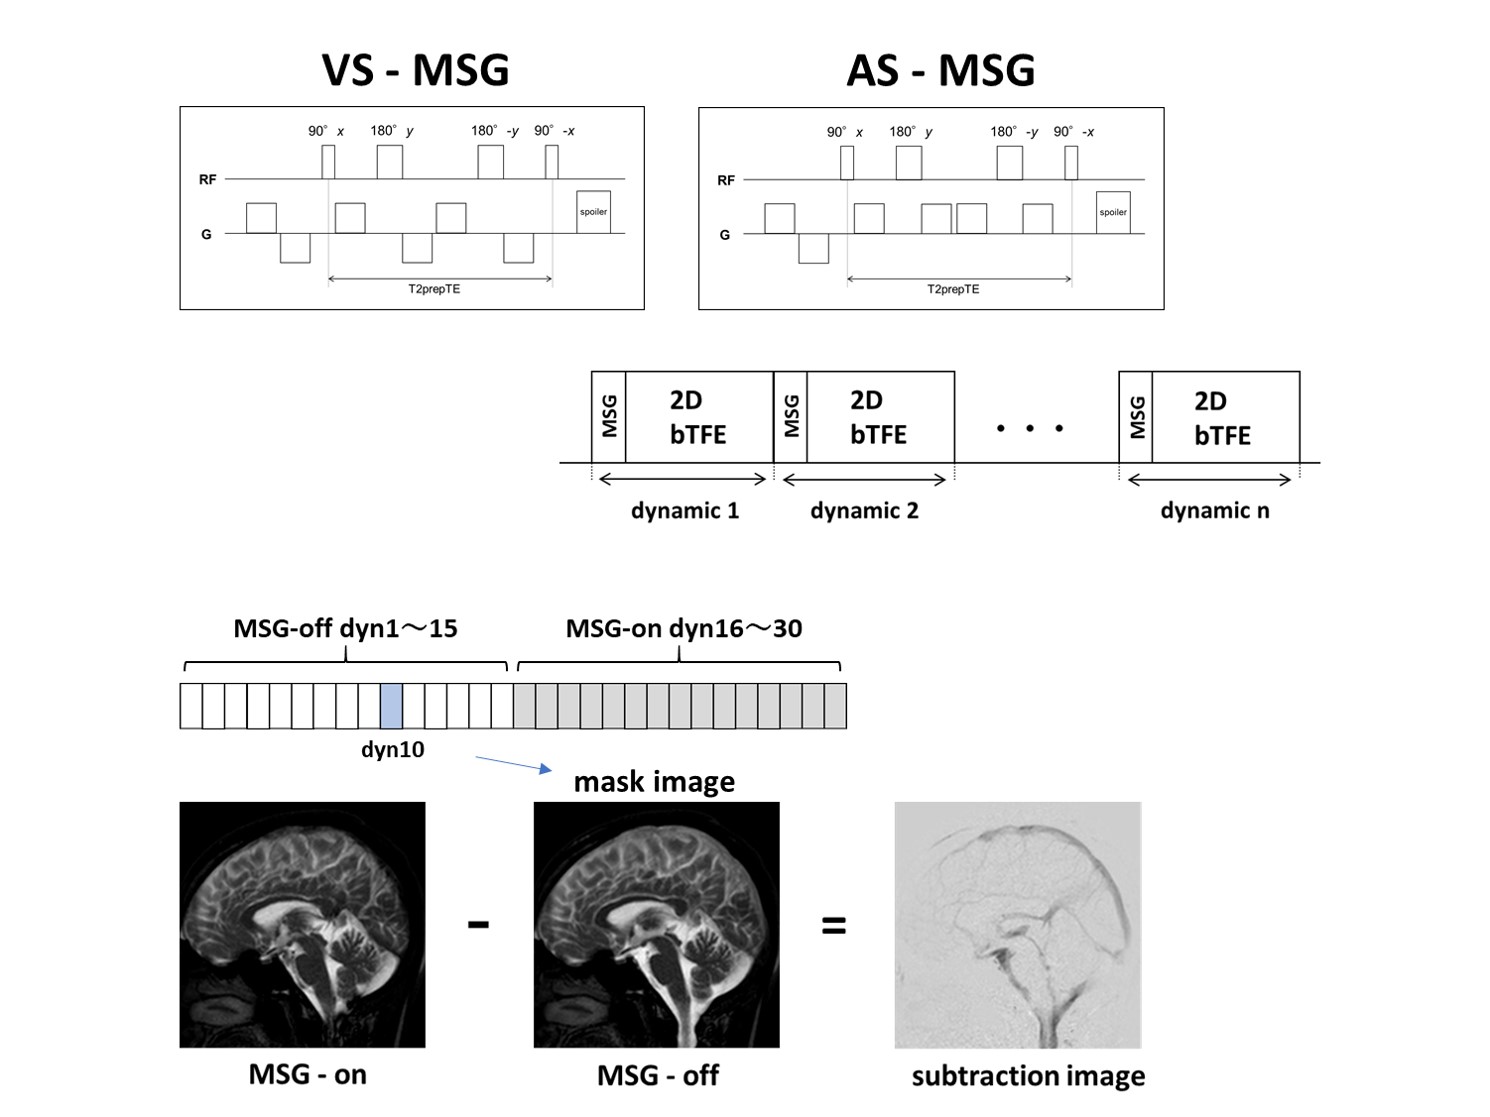
We reported a new technique to visualize the irregular flow of cerebrospinal fluid (CSF) by using dynamic iMSDE SSFP.1 This method used velocity selective motion sensitized gradient (VS-MSG), which modifies the signal from flowing spins by dephasing their macroscopic magnetization. Thus, it can be used for labeling of flowing spins. The flow can be visualized by subtracting images acquired with VS-MSG labeling from the images acquired without VS-MSG labeling. Recently, an acceleration selective MSG (AS-MSG) was proposed for the selective labeling of arteries where the effective gradient wave form is such that the first moment (m1) is zero. This gradient wave form results in rephasing of the signal of spins moving with constant velocity. The signal from spins that are subjected to acceleration will be dephased.2,3 Therefore, the AS-MSG may be able to separate the constant flow and acceleration flow of CSF. The purpose of this study was to investigate the characteristics of intracranial CSF visualization with dynamic SSFP using AS-MSG.Material and Methods
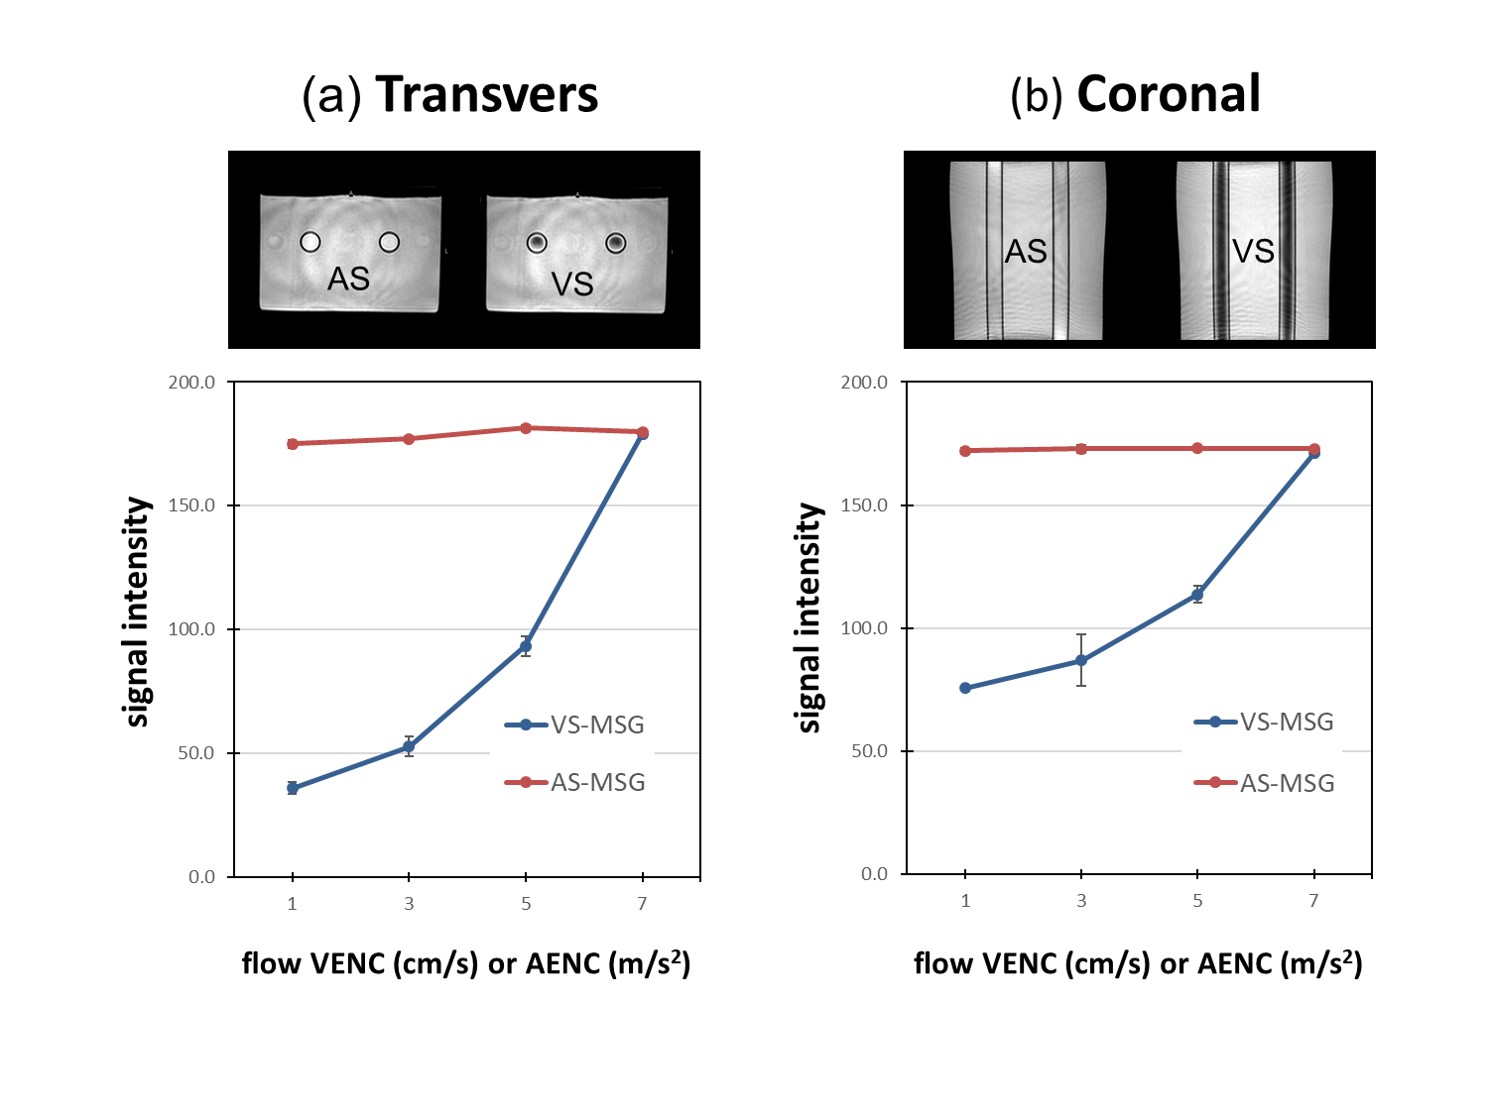
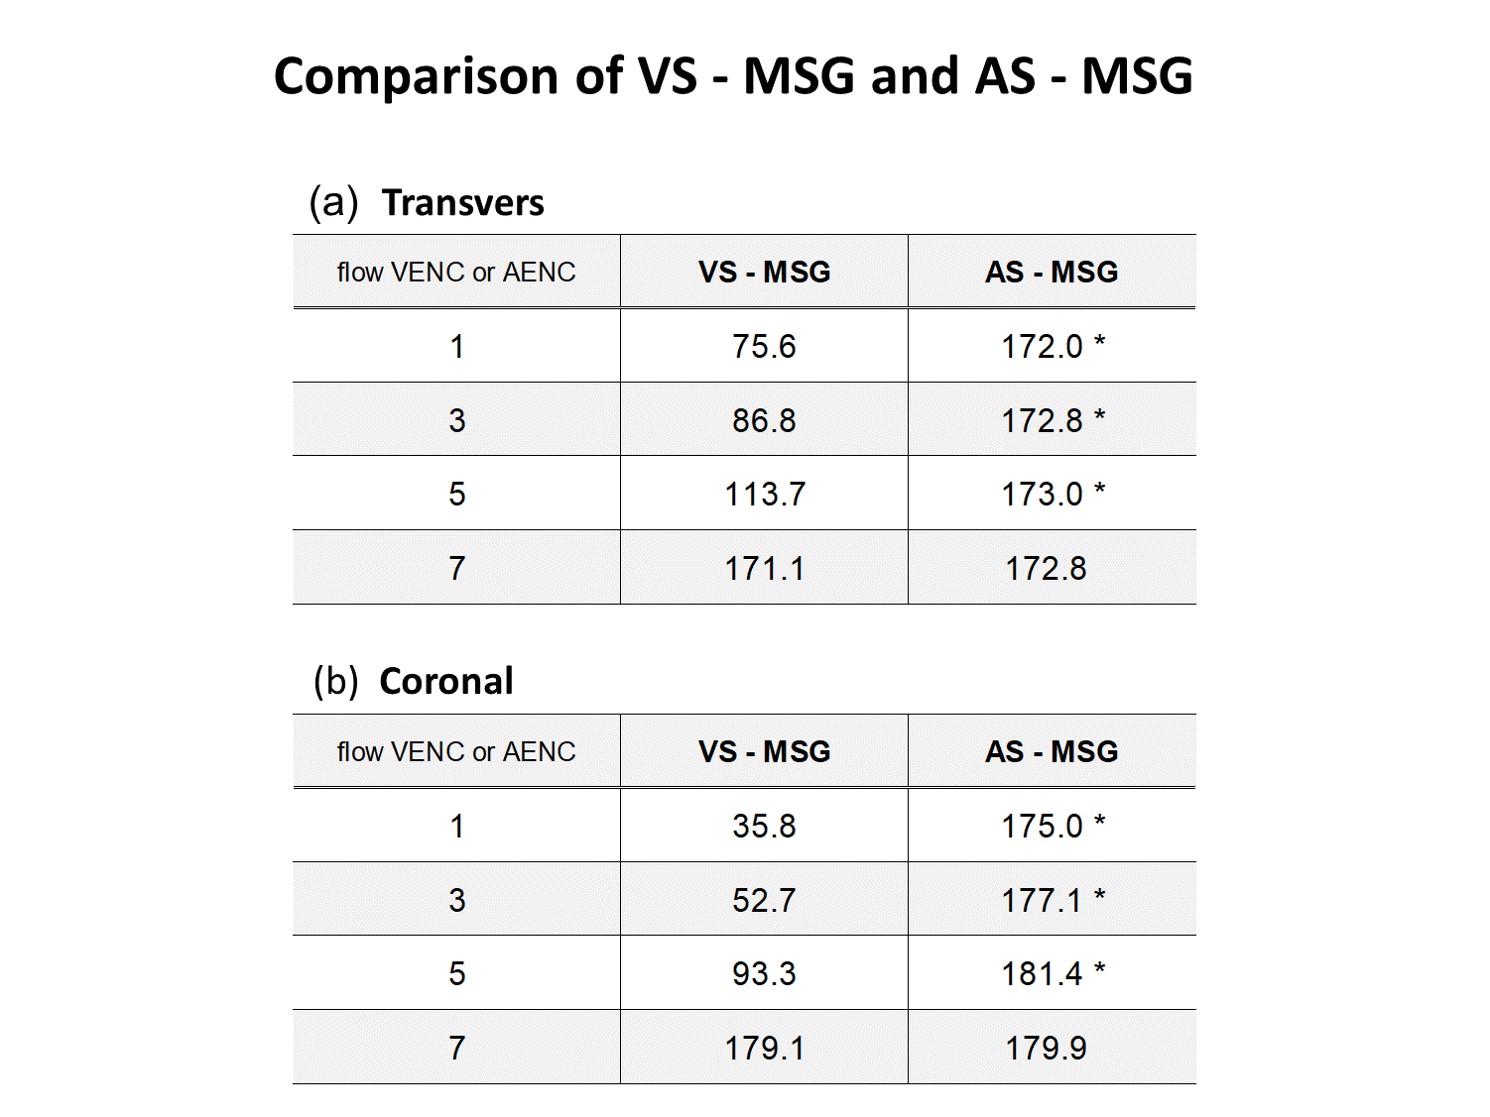
The theory of dynamic iMSDE SSFP by AS-MSG and VS-MSG is shown in Figure 1. The equipment we used was a 1.5T clinical scanner (Ingenia, Philips, Best, the Netherlands) with either a Torso coil or a dS-Head Spine coil. The basic parameters for dynamic iMSDE SSFP were as follows: 2D balanced TFE with iMSDE, FOV of 250×250 mm, matrix of 192×256, TR/TE: 3/1.51 ms, slice thickness of 7 mm, flip angle of 90°, reduction factor: 2, turbo field echo factor: 90, T2prepTE: 27ms, NSA:1, and dynamic scan: 30 (MSG-off: 15, MSG-on: 15). Phantom study: The flow phantom was made with superabsorbent polymer and tubes with constant flow. We investigated signal intensity of AS-MSG and VS-MSG in constant flow. The signal intensity of flowing water in the tube was measured with varying flow VENC (1, 3, 5, and 7 cm/s) and AENC (1, 3, 5, and 7 m/s2) in longitudinal and cross sections. Differences of signal intensity for each parameter were assessed by using paired samples t-test. Volunteer study: Five healthy volunteers (age range, 25–45 years) were included; written informed consent was obtained from all volunteers. We investigated flow detection on AS-MSG and VS-MSG in the mid-sagittal cross-section in the volunteers. Visual assessment of differences between AS-MSG and VS-MSG was performed using a 5-point scale by five radiological technologists. Differences of the scores for each parameter were assessed by using the Friedman’s test and multiple-comparison Holm's test.Results & Discussion
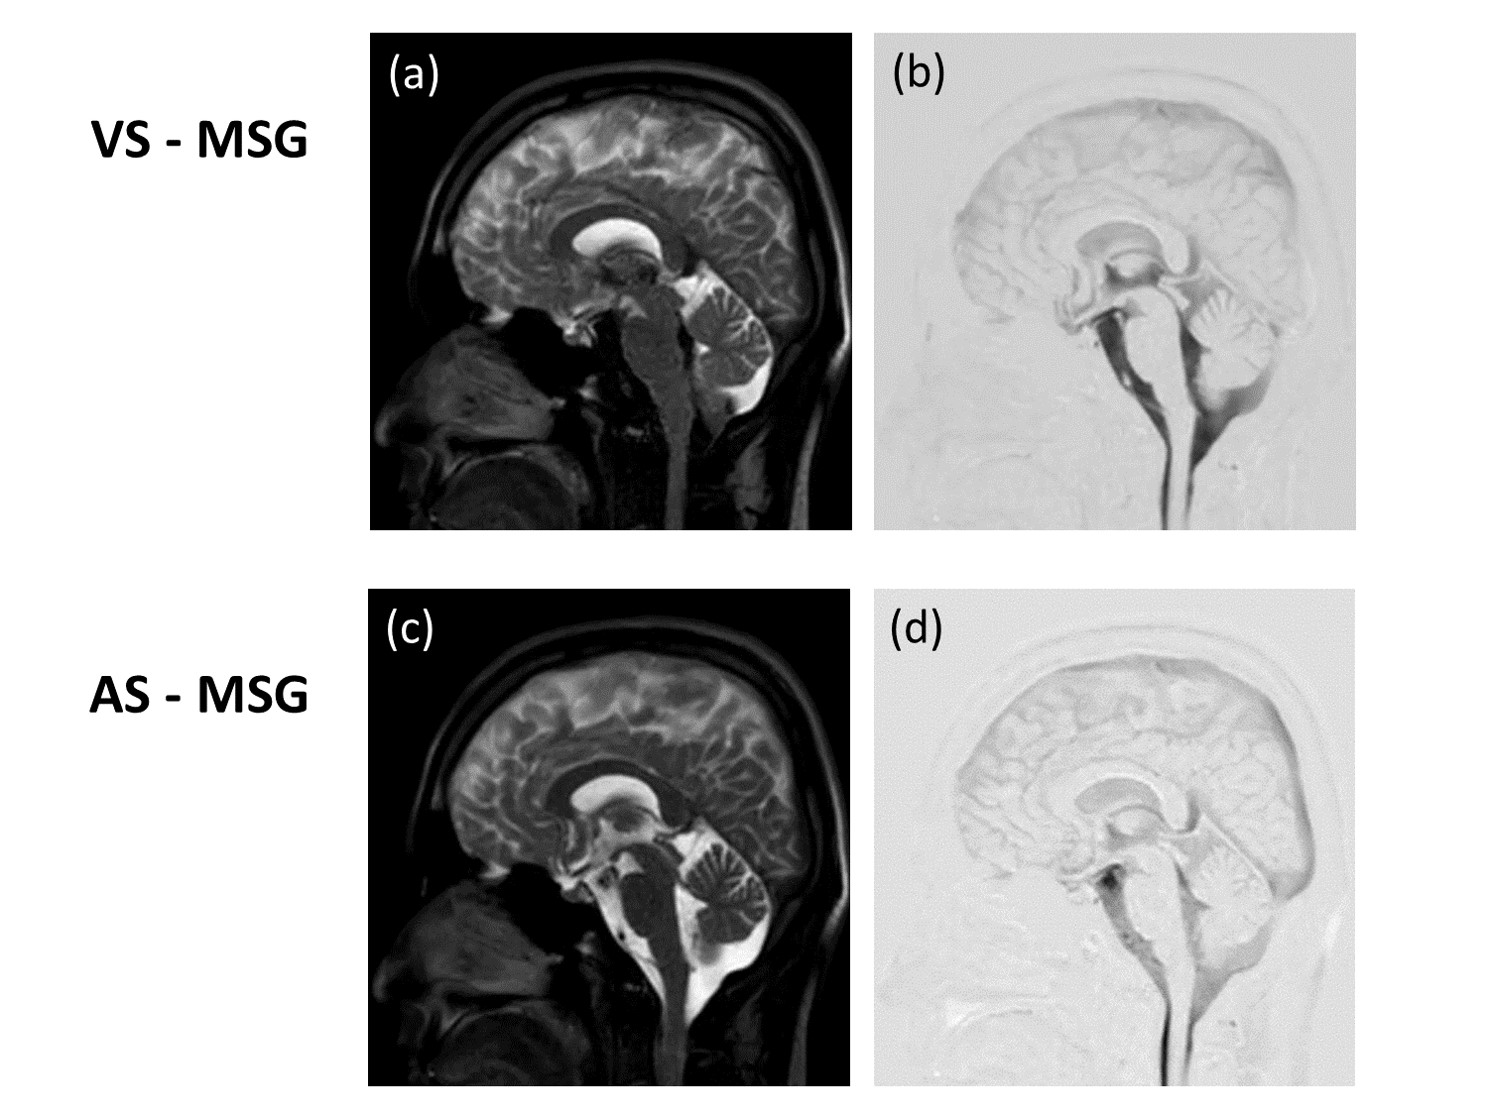
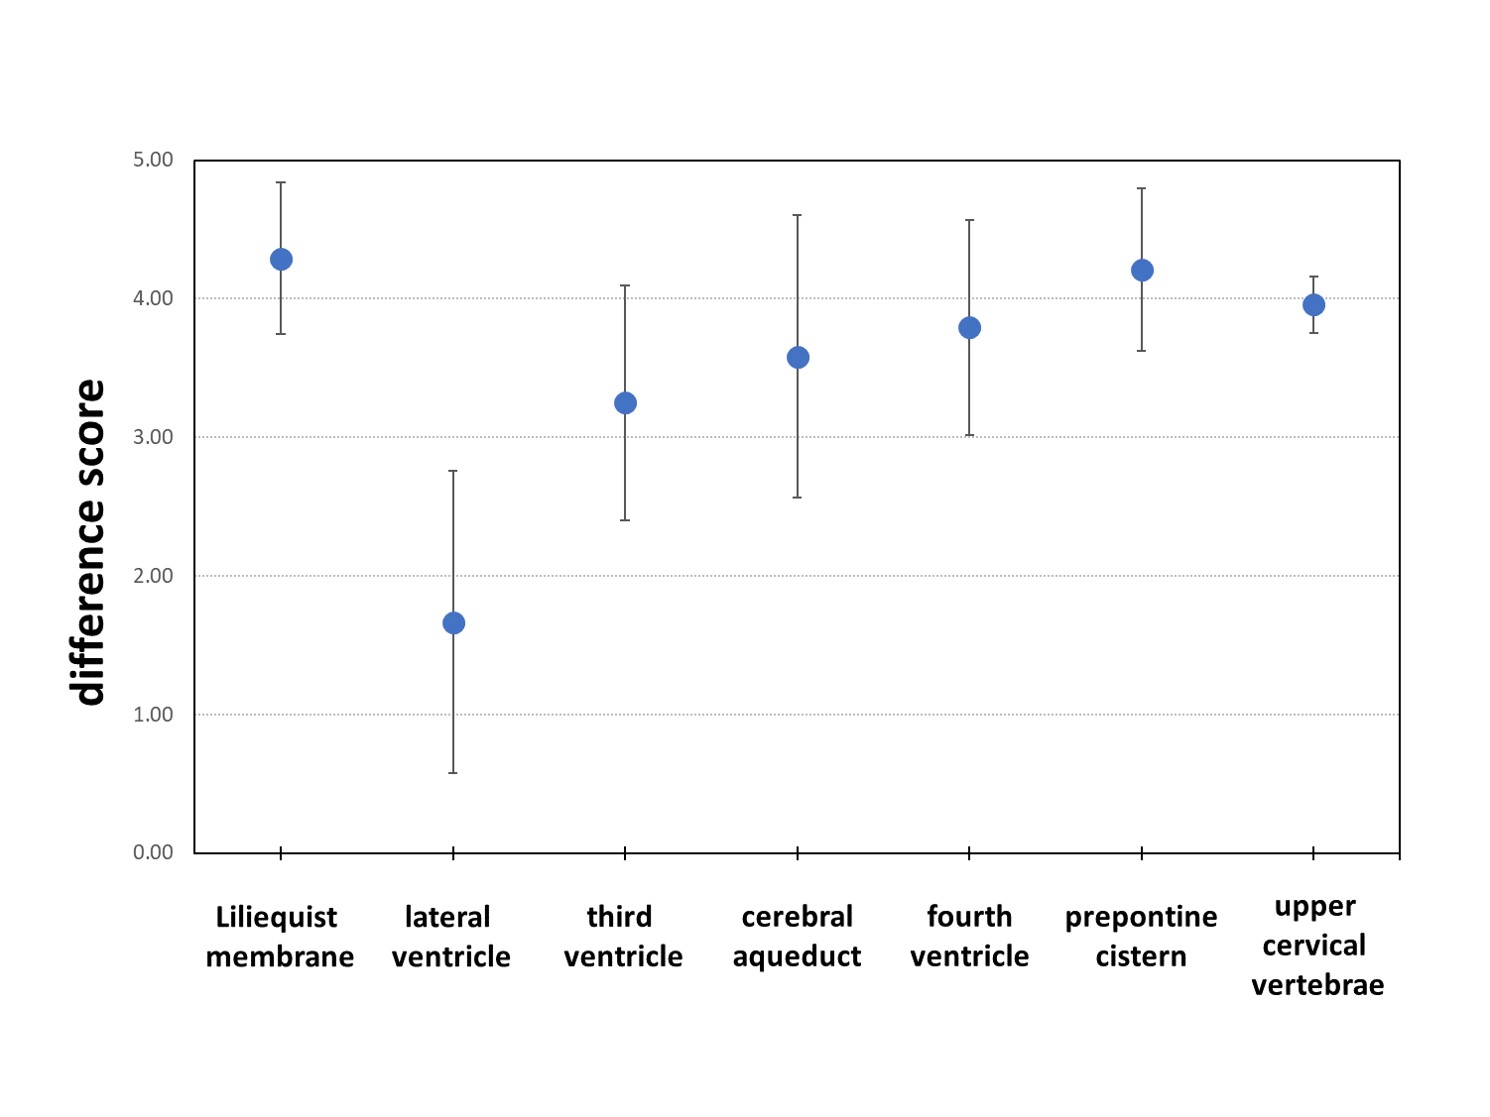
Phantom study: There was no change in signal intensity of AS-MSG. Signal intensity of VS-MSG decreased with a small flow VENC value (Figure 2, Table 1). This result was similar in both longitudinal and transverse sections. These results show rephasing of constant flow spins by AS-MSG. Volunteer study: The images on AS-MSG and on VS-MSG were very different. The signal intensity of CSF on VS-MSG image was decreased in a wide area, but that on AS-MSG image was decreased in the localized region. The signal decrease on AS-MSG image was found at the Liliequist membrane, third ventricle, cerebral aqueduct, fourth ventricle, prepontine cistern and CSF at the level of the upper cervical vertebrae (Figure 3,4). These results were similar to the previous studies using phase contrast technique. Irregular flow was found in those regions.4 Therefore, it is suggested that constant flow CSF and accelerated flow of CSF can be distinguished by AS-MSG.Conclusion
The dynamic SSFP using AS-MSG distinguishes acceleration flow of CSF from constant flow. This technique is suggested to contribute to the diagnosis of various diseases in the CSF space.Acknowledgements
No acknowledgement found.References
1. Horie T, et al. World Neurosurg. 2017; 97(1):523-531.
2. Priest AN, et al. MRM. 2014; 72(3):699-706.
3. Schmid S, et al. MRM. 2014; 71(1):191-199.
4. Matsumae M, et al. J Neurosurg. 2014; 120(1):218-27.
Figures