2549
CSF Flow and Aging: An Early Marker of Pathology?1Center for Advanced Brain Imaging and Neurophysiology, University of Rochester, Rochester, NY, United States, 2Neuroscience, University of Rochester Medical Center, Rochester, NY, United States
Synopsis
Phase Contrast-Magnetic resonance imaging (PC-MRI) provides detailed information on flow of spins, and has been applied to blood and cerebrospinal fluid (CSF) flow. In the field of CSF imaging, PC-MRI is mostly used as a clinical tool to look for frank CSF changes. However, subtle CSF changes are thought to occur in neurovascular pathologies, as well as neurodegenerative disorders such as AD. In addition, it has been shown that CSF flow may change during the aging process. In this abstract, we seek to select the optimal imaging parameters to investigate aging-related CSF changes.
Background
Phase Contrast-Magnetic resonance imaging (PC-MRI) provides a look at the flow of spins. It has long been utilized to quantify blood flow and Cerebrospinal fluid (CSF) flow. The latter is usually in the case of overt changes such as Normal Pressure Hydrocephalus (NPH) and Chiari I malformation.1,2 However, the use of PC-MRI in more subtle CSF pathologies has not been thoroughly investigated. With mounting evidence of CSF flow abnormalities in a variety of diseases, such as Alzheimer’s disease (AD),3 as well as normal aging4 it is vital to implement a protocol best-suited to reliably analyze any CSF changes.
An important parameter in a PC-MRI scan is the encoding velocity (venc), which is a function of the gradient applied. Based on the dynamics of the region being analyzed, venc must be set accordingly. Any velocity larger than venc will be aliased to a lower velocity. However, the amount of noise in the phase signal is linearly related to venc. Therefore, it is vital to choose a venc that is not too large as to add unnecessary noise and not too small as to alias the signal. In our study, with optimized parameters, we attempt to examine whether aging has an effect on CSF flow.
Methods
Imaging studies were performed on a 3T Siemens Prisma whole-body scanner (Siemens Healthineers, Erlangen, Germany) with a 64-channel phased array head coil. T1-MPRAGE images with 1 mm isotropic resolution (TR/TE/TI = 1400/2.34/702 ms) were acquired to calculate cross-sectional area for flow quantification. The PC-MRI sequence was retrospectively-gated and 40 samples were acquired over the cardiac cycle (CC), and was used to acquire a single slice at the level of either the cerebral aqueduct or 4th ventricle (Figure 1); images were acquired with venc= 5,10,15,20,25 cm/s through-plane. Four subjects were used for the acquisition, two younger (age=25), and two older (age=62 for subject 1, age=59 for subject 2) to preliminarily investigate the effects of aging.
Phase images from the acquisition were used to quantify velocity measurements. This analysis was conducted by normalizing the largest signal of the image to the venc, the highest velocity that can be measured. Then, regions-of-interest (ROIs) were drawn in the PC magnitude images, corresponding to the cerebral aqueduct and 4th ventricle. Signal over these ROIs were then averaged over each sample of the CC for each venc. Normalized flow rate (NFR), a value that is proportional to net flow, was calculated by multiplying the average flow rate in each direction by the percentage of CC containing flow in each direction.
Results
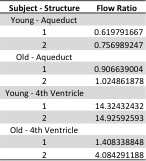
Aliasing artifact is evident in the scan from the older individual at venc = 5 cm/s (Figure 2B, upper graph, orange line). In addition, for both the young and old scans, the velocity profiles seem to be captured well at a venc = 20 cm/s (Figure 2A, B). Since the 4th ventricle had a much lower velocity, it seems that a venc = 10 cm/s captured the signal the best (Figure 2C, D). Both subjects exhibited larger fluctuations in the signal at higher velocities (Figure 2B, left panel, purple line), due to the increasing amount of noise seen with higher venc. In addition, due to the much larger cross-sectional area of the 4th ventricle, the flow in the 4th ventricle compared to the aqueduct is much higher (Table 1). In addition, there is evidence of significant changes in CSF dynamics between the age groups. The ratio of craniocaudal to caudocranial flow gives information about the net clearance (Table 2), we can see that the younger individuals had a much higher ratio of positive to negative flow in the 4th ventricle as compared to the older individuals.Discussion
: We found that utilizing a venc of 20 cm/s in the aqueduct and 10 cm/s in the 4th ventricle produced waveforms devoid of aliasing and large noise (Figure 2B). In addition, we found that with the sequence tuned to these parameters, the analysis done was sensitive to changes in CSF dynamics between separate age groups. The flow ratio, a number that reflects CSF clearance, was much higher in the 4th ventricle of the younger subjects than in older subjects (Table 2). This pattern was not replicated in the cerebral aqueduct.Conclusion
It is vital to insure the correct venc is chosen for the sake of CSF analysis. Study of the net flow of CSF in the 4th ventricle may provide information about brain changes in the aging process, and could be used to quantify differences between healthy imaging and pathology.Acknowledgements
We would like to acknowledge the NIH for the MSTP T32 training grant, as well as the University of Rochester Medical Center.References
1. Battal, B. et al. Cerebrospinal fluid flow imaging by using phase-contrast MR technique. The British Journal of Radiology 84, 758–765 (2014).
2. Alperin, N., Hushek, S., Lee, S., Sivaramakrishnan, A. & Lichtor, T. MRI study of cerebral blood flow and CSF flow dynamics in an upright posture: the effect of posture on the intracranial compliance and pressure. 95, 177–181 (2005).
3. Suzuki, Y. et al. Reduced CSF Water Influx in Alzheimer’s Disease Supporting the β-Amyloid Clearance Hypothesis. PLOS ONE 10, e0123708 (2015).
4. Oner, Z. et al. Quantitative Evaluation of Normal Aqueductal Cerebrospinal Fluid Flow Using Phase‐Contrast Cine MRI According to Age and Sex. Anatomical Rec 300, 549–555 (2017).
Figures