2547
Evidence for increasing hippocampal metabolite concentrations during healthy aging1Physics & Astronomy, University of British Columbia, Vancouver, BC, Canada, 2International Collaboration on Repair Discoveries, Vancouver, BC, Canada, 3Philips Healthcare, Markham, ON, Canada, 4Radiology, University of British Columbia, Vancouver, BC, Canada, 5Mechatronic Systems Engineering, Simon Fraser University, Vancouver, BC, Canada, 6Psychiatry, Non-Invasive Neurostimulation Therapies, University of British Columbia, Vancouver, BC, Canada, 7Psychiatry, McGill University, Montreal, QC, Canada, 8Pathology & Laboratory Medicine, University of British Columbia, Vancouver, BC, Canada
Synopsis
Previous magnetic resonance spectroscopy (MRS) studies have concluded that hippocampal metabolite concentrations remain stable during healthy adult aging. However, these studies used short repetition times (TR ≤ 2s), which leads to heavy T1-weighting. We used a longer TR (4s) to reduce T1-weighting and found hippocampal metabolite concentrations increase with age for N-acetyl-aspartate, creatine, choline and myo-inositol. Our findings illustrate the importance of using sufficiently long TR in MRS to avoid T1-relaxation effects influencing the measurement of metabolite concentrations.
Background
The hippocampus is a key brain structure involved in learning and memory1, and various volume and advanced MRI-related abnormalities have been reported in neurological diseases including Alzheimer’s disease2, depression3, and bipolar disorder4. Proton magnetic resonance spectroscopy (MRS) can provide several biomarkers of brain health including: total N-Acetyl-Aspartate (tNAA, reflecting coupling between neurons/oligodendrocytes5), total creatine (tCr, creatine + phosphocreatine, an energy source6), total choline (tCho, choline-containing compounds, membrane synthesis), glutamate and glutamine (Glu+Gln=Glx, Glu: neurotransmitter, Gln: Glu uptake)7, and myo-inositol (mI, glial marker8). To appropriately interpret MRS findings in neurological conditions, accurate characterization of brain metabolites across the age span in healthy controls is needed. While one study reports tCho increases with age in the hippocampus9, other studies have found that hippocampal tNAA, tCr, and mI did not change with age10,11. However, previous work used short repetition times (TR≤2s), which leads to heavy T1-weighting and possible reductions in metabolite concentration levels due to changes in T1 and not changes in metabolite concentration. Our goal was to assess hippocampal brain metabolite levels in a large cohort of diversely aged healthy volunteers using a long TR of 4s.Methods
Subjects: 38 healthy volunteers (23F/15M, mean age: 41yrs, range: 18-63yrs) were enrolled in our study.
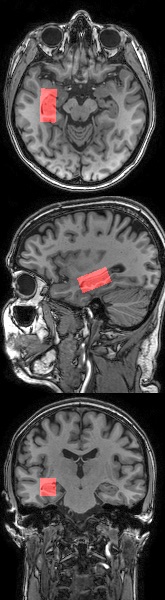
MR Experiments: 1H-MR spectra were collected from a 6.75mL voxel placed around the left hippocampus (Figure 1, PRESS sequence, TE/TR=31/4000ms, 112 water-suppressed and 16 non-water-suppressed acquisitions saved individually, 16 phase-cycle steps) on a 3T Philips Achieva system using an 8-channel phased array head coil. Second order shimming and excitation water suppression were performed. T1-weighted images with 1mm3 isotropic resolution were acquired for tissue segmentation using an MPRAGE sequence (inversion time=1052ms, shot interval=3000ms, TE/TR=3.5/8.1ms, FOV (ap/fh/rl)=256/256/165mm).
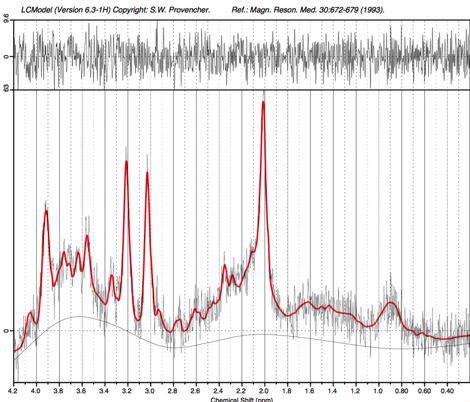
Data Analysis: Water-suppressed and non-water suppressed spectra were preprocessed separately using an in-house MATLAB script performing frequency alignment and eddy current correction12. Preprocessed spectra were fit with LCModel13 version 6.3, yielding metabolite levels relative to water as well as Cramér-Rao Lower Bound (CRLB) error estimates14. For absolute quantification of metabolite concentrations, intra-voxel water content was calculated from cerebrospinal fluid (CSF), grey matter (GM), and white matter (WM)) partial volume maps obtained by FSL FAST15, with corrections for T1 and T2 relaxation16. Spectra were manually checked for ghosting or outer volume signal artifacts.
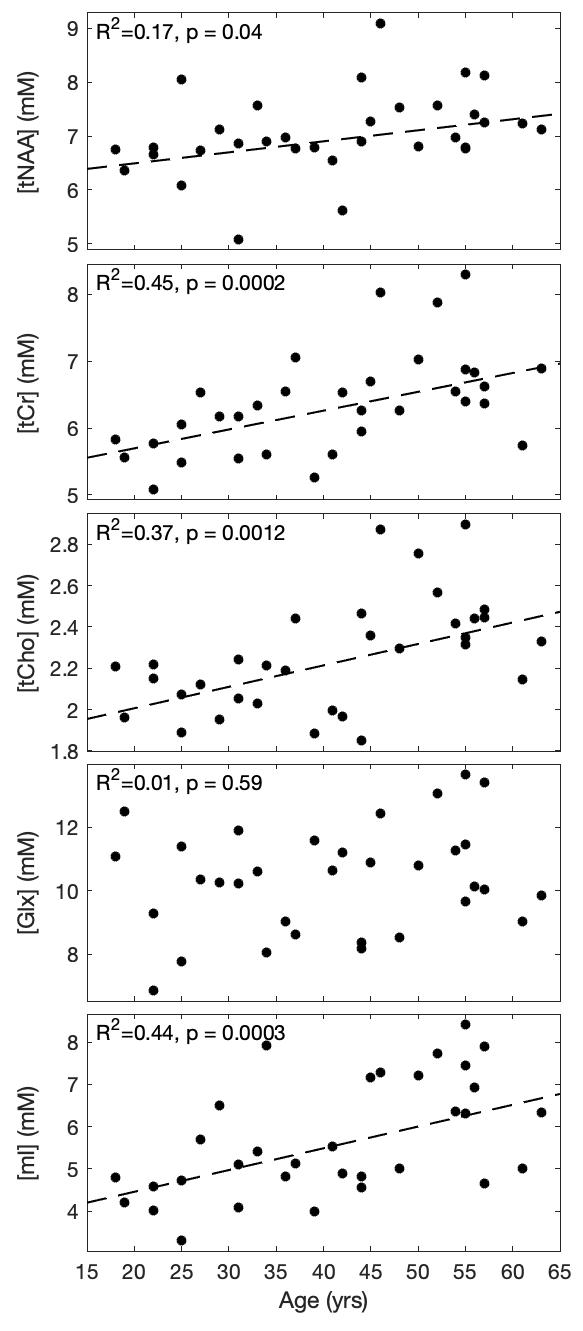
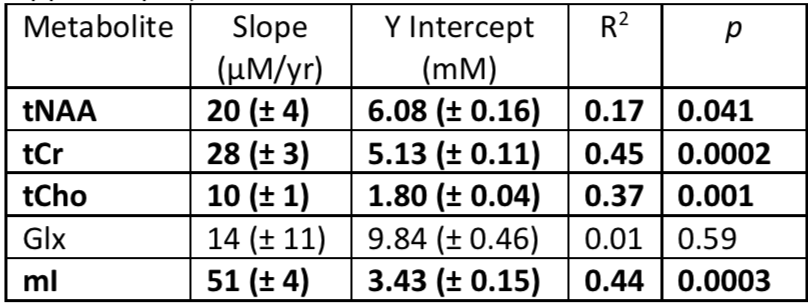
Statistics: Correlations between individual metabolite concentrations and age were assessed using individual partial correlation tests, including demographic information (sex, handedness, years of education) and voxel composition (CSF/WM/GM fractions, total voxel water content, fraction of voxel containing hippocampus) as confounders. Due to the exploratory nature of our study, adjustment for multiple comparisons was not performed. Weighted least-square linear regressions using the LCModel CRLB error estimate were carried out to estimate best fit intercepts and slopes for each metabolite vs age (Table 1).
Results
Five spectra were rejected from analysis due to artifacts. Mean signal to noise (SNR) and linewidth for the remaining 33 scans were 7.4 and 6.8Hz, respectively. An example spectrum (from the subject in Figure 1) is shown in Figure 2. Best fit slopes, intercepts, correlation coefficients, and p-values are presented in Table 1 and plotted in Figure 3. tNAA, tCr, tCho, and mI all increased with age (p<0.05). To ensure that these observations were not confounded by spectral quality, relationships between age and SNR, linewidth, and scan date were also evaluated but did not show any significance (p=0.25,0.14,0.30 respectively).Discussion and Conclusion
We observed increases in hippocampal metabolite concentrations with age, a finding that is in contrast to many other previous studies. The increases with age observed in our study may have been detectable due to our relatively long TR of 4s, compared to the TRs≤2s used in previous studies. Any experiment using short TR introduces some degree of T1-weighting, which has been shown to significantly reduce the measured absolute metabolite levels for TR<4s at 3T17. Combined with the high motion sensitivity and relatively low SNR attainable in the hippocampus due to its small size18, and the linewidth broadening due to its proximity to the lateral ventricles19, the additional confounding factor of T1-weighting may make metabolite changes too challenging to detect using a short TR. In particular, variations in the brain’s microenvironment can drive differences in metabolite T120,21. If the molecular environment of the hippocampus changes during aging such that metabolic T1s increase, then the short TRs usedin previous studies may obscure metabolite concentration changes with age. Our study suggests that MRS studies with sufficiently long TR (≥4s) are needed to accurately assess changes in hippocampal metabolite concentrations with age.Acknowledgements
We gratefully acknowledge support from the UBC MRI Research Centre, volunteers, and MR technologists. This study was funded by the Canadian Institutes of Health Research (CIHR), Brain Canada, and a philanthropic donation. Erin L MacMillan receives salary support from Philips, Canada.References
1. Squire LR, Stark CEL, Clark RE. The medial temporal lobe. Annu Rev Neurosci. 2004;27:279-306. doi:10.1146/annurev.neuro.27.070203.144130.
2. Wang Z, Zhao C, Yu L, Zhou W, Li K. Regional metabolic changes in the hippocampus and posterior cingulate area detected with 3-tesla magnetic resonance spectroscopy in patients with mild cognitive impairment and alzheimer disease. Acta radiol. 2009. doi:10.1080/02841850802709219.
3. Block W, Träber F, Von Widdern O, et al. Proton MR spectroscopy of the hippocampus at 3 T in patients with unipolar major depressive disorder: Correlates and predictors of treatment response. Int J Neuropsychopharmacol. 2009;12(3):415-422. doi:10.1017/S1461145708009516.
4. Colla M, Schubert F, Bubner M, et al. Glutamate as a spectroscopic marker of hippocampal structural plasticity is elevated in long-term euthymic bipolar patients on chronic lithium therapy and correlates inversely with diurnal cortisol. Mol Psychiatry. 2009;14(7):696-704. doi:10.1038/mp.2008.26.
5. Nordengen K, Heuser C, Rinholm JE gge, Matalon R, Gundersen V. Localisation of N-acetylaspartate in oligodendrocytes/myelin. Brain Struct Funct. 2015;220(2):899-917. doi:10.1007/s00429-013-0691-7.
6. Wallimann T, Wyss M, Brdiczka D, Nicolay K, Eppenberger HM. Intracellular compartmentation, structure and function of creatine kinase isoenzymes in tissues with high and fluctuating energy demands: the “phosphocreatine circuit” for cellular energy homeostasis. Biochem J. 1992;281(Pt 1):21-40. doi:10.1042/bj2810021.
7. Erecińska M, Silver IA. Metabolism and role of glutamate in mammalian brain. Prog Neurobiol. 1990;35(4):245-296. doi:10.1016/0301-0082(90)90013-7.
8. Fisher SK, Novak JE, Agranoff BW. Inositol and higher inositol phosphates in neural tissues: Homeostasis, metabolism and functional significance. J Neurochem. 2002;82(4):736-754. doi:10.1046/j.1471-4159.2002.01041.x.
9. Robertson DM, van Amelsvoort T, Daly E, et al. Effects of estrogen replacement therapy on human brain aging: an in vivo 1H MRS study. Neurology. 2001;57(11):2114-2117.
10. Schuff N, Amend DL, Knowlton R, Norman D, Fein G, Weiner MW. Age-related metabolite changes and volume loss in the hippocampus by magnetic resonance spectroscopy and imaging. Neurobiol Aging. 1999;20(3):279-285. doi:10.1016/S0197-4580(99)00022-6.
11. Haga KK, Khor YP, Farrall A, Wardlaw JM. A systematic review of brain metabolite changes, measured with 1H magnetic resonance spectroscopy, in healthy aging. Neurobiol Aging. 2009;30(3):353-363. doi:10.1016/j.neurobiolaging.2007.07.005.
12. Klose U. In vivo proton spectroscopy in presence of eddy currents. Magn Reson Med. 1990;14(1):26-30. doi:10.1002/mrm.1910140104.
13. Provencher SW. Estimation of metabolite concentrations from localized in vivo proton NMR spectra. Magn Reson Med. 1993;30(6):672-679. doi:10.1002/mrm.1910300604.
14. Provencher S. LCModel & LCMgui User’s Manual. 2018.
15. Zhang Y, Brady M, Smith S. Segmentation of brain MR images through a hidden Markov random field model and the expectation-maximization algorithm. IEEE Trans Med Imaging. 2001;20(1):45-57. doi:10.1109/42.906424.
16. MacMillan EL, Tam R, Zhao Y, et al. Progressive multiple sclerosis exhibits decreasing glutamate and glutamine over two years. Mult Scler J. 2016;22(1):112-116. doi:10.1177/1352458515586086.
17. Knight-Scott J, Brennan P, Palasis S, Zhong X. Effect of repetition time on metabolite quantification in the human brain in 1 H MR spectroscopy at 3 tesla. J Magn Reson Imaging. 2017;45(3):710-721. doi:10.1002/jmri.25403.
18. Choi CG, Frahm J. Localized proton MRS of the human hippocampus: Metabolite concentrations and relaxation times. Magn Reson Med. 1999;41(1):204-207. doi:10.1002/(SICI)1522-2594(199901)41:1<204::AID-MRM29>3.0.CO;2-7.
19. Bednařík P, Moheet A, Deelchand DK, et al. Feasibility and reproducibility of neurochemical profile quantification in the human hippocampus at 3T. NMR Biomed. 2015;28(6):685-693. doi:10.1002/nbm.3309.
20. Brief EE, Whittall KP, Li DKB, MacKay A. Proton T1 relaxation times of cerebral metabolites differ within and between regions of normal human brain. NMR Biomed. 2003;16(8):503-509. doi:10.1002/nbm.857.
21. Ethofer T, Mader I, Seeger U, et al. Comparison of Longitudinal Metabolite Relaxation Times in Different Regions of the Human Brain at 1.5 and 3 Tesla. Magn Reson Med. 2003;50(6):1296-1301. doi:10.1002/mrm.10640.
Figures