2544
7T 1H-MRS of the anterior cingulate in patients with psychosis spectrum and mood symptoms1Psychiatry, University of Pennsylvania, Philadelphia, PA, United States, 2Radiology, University of Pennsylvania, Philadelphia, PA, United States
Synopsis
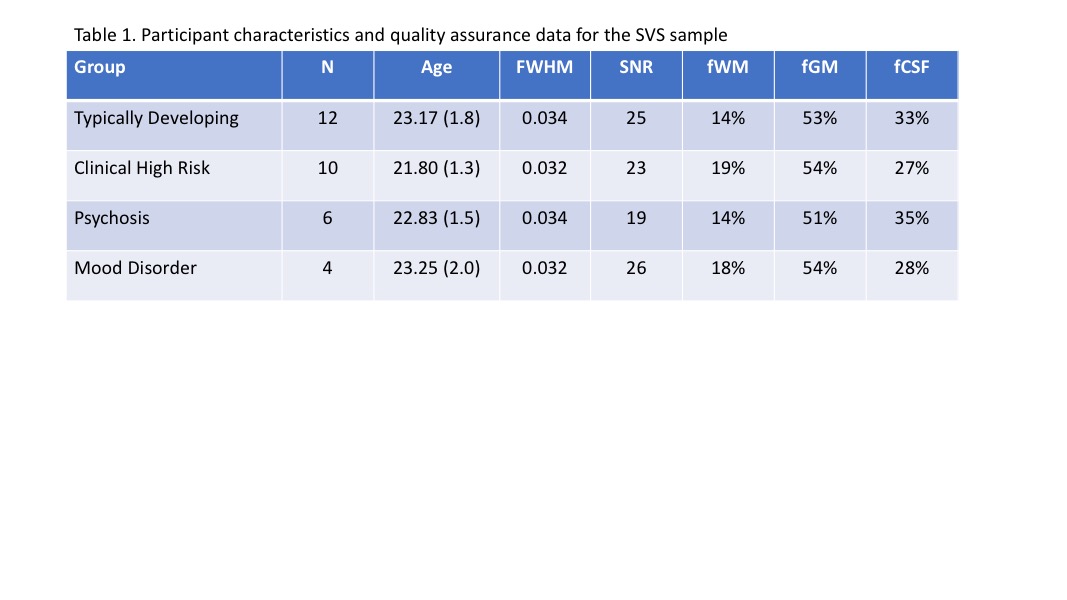
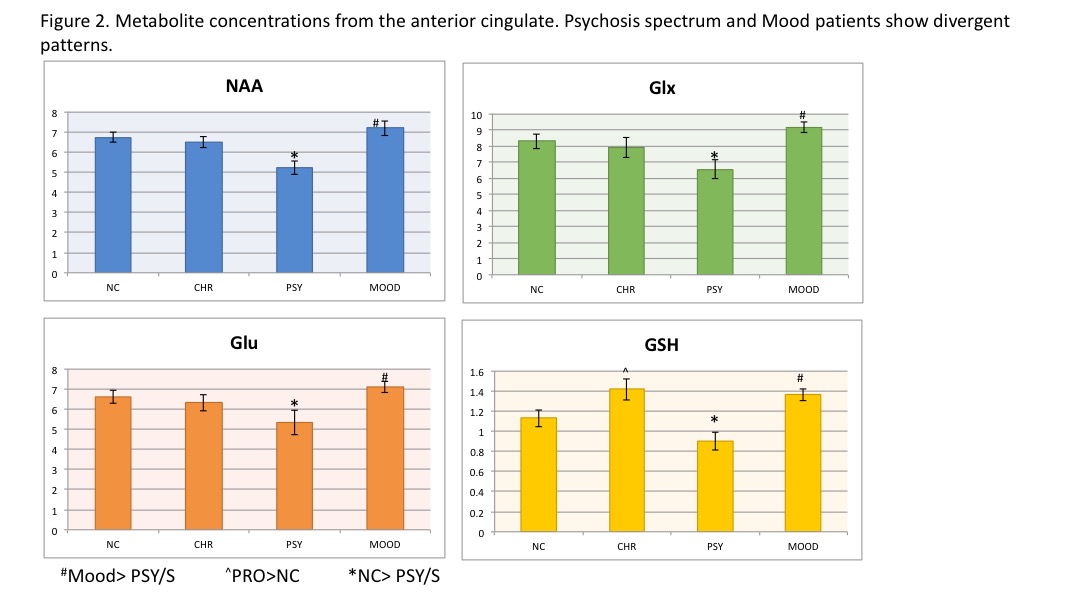
Data from 12 typically developing (TD), 10 clinical high risk for psychosis (CHR), 6 psychosis (PSY) and 4 mood disorder (MD) participants who underwent 1HMRS at 7T. Short TE single voxel spectra (SVS) were obtained using a custom-modified PRESS sequence from the anterior cingulate gyrus. Data quality was high and tissue contribution within the acquisition voxel was similar across diagnostic groups. NAA, Creatine, Choline, GSH and Glu were significantly lower in PSY as compared to TD. CHR showed an intermediate pattern for all brain neurometabolites, except GSH, which was elevated as compared to TD. MD patients, in general, showed higher concentrations of NAA, Cho, GSH and Glu as compared to TD.
Introduction
Precise etiological mechanisms for neurodevelopmental disorders such as psychosis and depression are yet to be established, but structural and functional magnetic resonance imaging document significant disruption of several neuronal processes.1 Here, we use 1HMRS, the primary method for measurement of in vivo neurometabolites, at 7T in a diverse clinical sample to better understand alterations in brain neurochemistry that may underline previously reported structural and functional dysfunction. Alterations in brain glutamate (Glu) are of particular interest given its ubiquity and involvement in high-order functions and neuronal metabolism. Changes in brain Glu appear related to the course of psychosis2 and depression.3 The presence and magnitude of Glu dysfunction depends on patient subgroup (chronic SZ, high risk individuals or first episode patients), brain region (cingulate vs. hippocampus) and medication status (never treated vs. chronically treated). 1HMRS findings in clinical high risk (CHR) are even less consistent.2,4 Meta-analytic results indicate that CHR individuals show elevated Glx only within the medial frontal cortex,2 whereas individual studies indicate lower,5-9 higher,8-14 and no difference15-17 in Glu (or Glu/Gln) in several brain regions. Thus, the role and time course of Glu changes, particularly early in the course, remain unclear. We aimed to compare patterns of brain metabolites in TD, CHR, PSY and MD using ultra-high field (7Tesla) 1HMRS.Methods
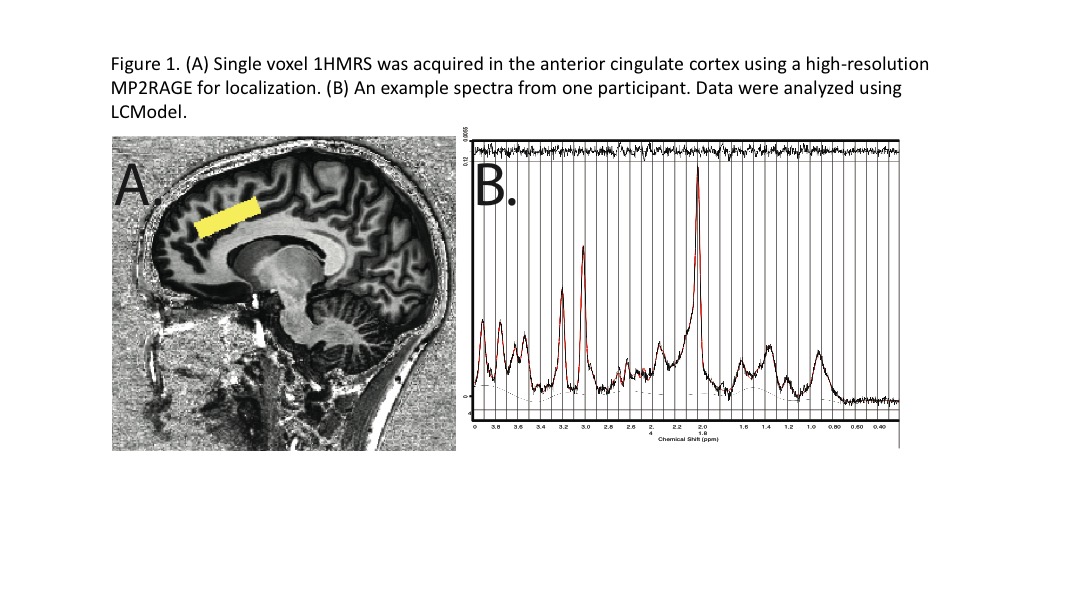
7T Acquisition: Short TE single voxel spectra (SVS) were obtained using a previously employed18 custom-modified Point-RESolved Spectroscopy (PRESS) sequence19,20 with the following acquisition parameters: averages = 8 (water reference)/128 (water suppressed), TE = 23ms and TR = 3000ms. The SVS acquisition voxel was centered over the anterior cingulate gyrus. Acquisition time was 36 seconds for water reference spectrum and 6 min 48s for water suppressed spectrum. Water suppression is achieved with variable power RF pulses with optimized relaxation delays (VAPOR21) prior to SVS acquisition. Chemical shift artifacts for Glu and NAA are minimized by setting water acquisition spectrum excitation and refocusing pulses in resonance with the water peak at 4.7ppm, and for water suppressed spectrum, the excitation and refocusing pulses are set in resonance with the Glu peak at 2.35ppm. Pulse amplitudes are calibrated before measurement to reduce B1 inhomogeneity by acquiring six localized STimulated Echo Acquisition Mode (STEAM) water spectra at fixed reference voltage and varying flip angle from 0º to 180º with a step size of 30º. The sin3 dependence of the amplitudes is then used to estimate the reference voltage of the transmitter.22 Cramer Rao lower bounds and spectral analysis were performed using LC Model.Results
Data quality was high and tissue contribution within the acquisition voxel was similar across diagnostic groups. NAA, Creatine, Choline, GSH and Glu were significantly lower in PSY compared to TD (ps < 0.05). CHR showed intermediate levels between PSY and TD for all brain neurometabolites, except GSH, which was elevated compared to TD. MD patients, in general, showed significantly higher concentrations of NAA, Creatine, Choline GSH, Glx and Glu as compared to PSY; these levels were nominally higher than TD and CHR .Discussion
The current 1HMRS findings coupled with our recent results in glutamate chemical exchange saturation transfer (GluCEST)23 at 7T MRI, provide convergent evidence that brain Glu is lower in PSY as compared to TD and the CHR show an intermediate pattern. Moreover, the dissociation between PSY (lower) and MD (higher) in brain Glu provides insight into specific alterations that are likely related to the clinical course of each disorder. These data suggest that disruption of brain Glu, and other neurometabolites, may be valid markers of incipient and early stage dysfunction of psychopathology.Acknowledgements
This project was supported by the National Institute of Mental Health MH089983, MH089924, MH087626, K01MH102609; NARSAD Young Investigator Grant from the Brain & Behavior Research Foundation, the Dowshen Program for Neuroscience at the University of Pennsylvania; and the Life Span Brain Institute (LiBI)—a collaboration between the University of Pennsylvania School of Medicine and Children’s Hospital of Philadelphia.References
1 Gysin, R. et al. Impaired glutathione synthesis in schizophrenia: convergent genetic and functional evidence. Proceedings of the National Academy of Sciences 104, 16621-16626 (2007).
2 Merritt, K., Egerton, A., Kempton, M. J., Taylor, M. J. & McGuire, P. K. Nature of Glutamate Alterations in Schizophrenia: A Meta-analysis of Proton Magnetic Resonance Spectroscopy Studies. JAMA psychiatry 73, 665-674 (2016).
3 Auer, D. P. et al. Reduced glutamate in the anterior cingulate cortex in depression: an in vivo proton magnetic resonance spectroscopy study. Biol. Psychiatry 47, 305-313 (2000).
4 Treen, D. et al. Are there glutamate abnormalities in subjects at high risk mental state for psychosis? A review of the evidence. Schizophr. Res. (2016).
5 Egerton, A. et al. Relationship between brain glutamate levels and clinical outcome in individuals at ultra high risk of psychosis. Neuropsychopharmacology (2014).
6 Allen, P. et al. Functional outcome in people at high risk for psychosis predicted by thalamic glutamate levels and prefronto-striatal activation. Schizophr. Bull. 41, 429-439 (2015).
7 Uhl, I. et al. 1H-MR spectroscopy in ultra-high risk and first episode stages of schizophrenia. J. Psychiatr. Res. 45, 1135-1139 (2011).
8 Stone, J. M. et al. Glutamate dysfunction in people with prodromal symptoms of psychosis: relationship to gray matter volume. Biol. Psychiatry 66, 533-539 (2009).
9 Keshavan, M. S. et al. Striatal metabolic alterations in non-psychotic adolescent offspring at risk for schizophrenia: a 1 H spectroscopy study. Schizophr. Res. 115, 88-93 (2009).
10 Tibbo, P., Hanstock, C., Valiakalayil, A. & Allen, P. 3-T proton MRS investigation of glutamate and glutamine in adolescents at high genetic risk for schizophrenia. Am. J. Psychiatry 161, 1116-1118 (2004).
11 Fusar-Poli, P. et al. Thalamic glutamate levels as a predictor of cortical response during executive functioning in subjects at high risk for psychosis. Arch. Gen. Psychiatry 68, 881 (2011).
12 de la Fuente-Sandoval, C. et al. Striatal glutamate and the conversion to psychosis: a prospective 1 H-MRS imaging study. The International Journal of Neuropsychopharmacology 16, 471-475 (2013).
13 de la Fuente-Sandoval, C. et al. Higher levels of glutamate in the associative-striatum of subjects with prodromal symptoms of schizophrenia and patients with first-episode psychosis. Neuropsychopharmacology 36, 1781-1791 (2011).
14 Tandon, N. et al. Brain metabolite alterations in young adults at familial high risk for schizophrenia using proton magnetic resonance spectroscopy. Schizophr. Res. (2013).
15 Yoo, S. Y. et al. Proton magnetic resonance spectroscopy in subjects with high genetic risk of schizophrenia: investigation of anterior cingulate, dorsolateral prefrontal cortex and thalamus. Schizophr. Res. 111, 86-93 (2009).
16 Purdon, S. E., Valiakalayil, A., Hanstock, C. C., Seres, P. & Tibbo, P. Elevated 3T proton MRS glutamate levels associated with poor Continuous Performance Test (CPT-0X) scores and genetic risk for schizophrenia. Schizophr. Res. 99, 218-224, doi:S0920-9964(07)00529-4 [pii]
17 Natsubori, T. et al. Reduced frontal glutamate+ glutamine and N-acetylaspartate levels in patients with chronic schizophrenia but not in those at clinical high risk for psychosis or with first-episode schizophrenia. Schizophr. Bull. 40, 1128-1139 (2014).
18 Cai, K. et al. Magnetic resonance imaging of glutamate. Nat. Med. 18, 302-306 (2012).
19 Hoshino, Y. et al. Reproducibility of short echo time proton magnetic resonance spectroscopy using point-resolved spatially localized spectroscopy sequence in normal human brains. Radiat. Med. 17, 115-120 (1999).
20 van der Graaf, M., Jager, G. J. & Heerschap, A. Removal of the outer lines of the citrate multiplet in proton magnetic resonance spectra of the prostatic gland by accurate timing of a point-resolved spectroscopy pulse sequence. Magnetic Resonance Materials in Physics, Biology and Medicine 5, 65-69 (1997).
21 Tkac, I., Starcuk, Z., Choi, I. Y. & Gruetter, R. In vivo 1H NMR spectroscopy of rat brain at 1 ms echo time. Magn. Reson. Med. 41, 649-656, doi:10.1002/(SICI)1522-2594(199904)41:4<649::AID-MRM2>3.0.CO;2-G [pii] (1999).
22 Helms, G. A precise and user-independent quantification technique for regional comparison of single volume proton MR spectroscopy of the human brain. NMR Biomed. 13, 398-406 (2000).
23 Roalf, D. et al. Glutamate imaging (GluCEST) reveals lower brain GluCEST contrast in patients on the psychosis spectrum. Mol. Psychiatry (2017).
Figures