2543
Mapping of Regional Distributions of Brain Metabolites in Healthy Young Adults using Three-dimensional Echoplanar Spectroscopic Imaging1Psychiatry, Perelman School of Medicine at the University of Pennsylvania, Philadelphia, PA, United States, 2Radiology, Perelman School of Medicine at the University of Pennsylvania, Philadelphia, PA, United States, 3Radiology, University of Miami, Miami, FL, United States
Synopsis
To determine the regional distributions of metabolites from different lobar regions of brain in a cohort of healthy individuals in late adolescence and early adulthood, a total of 19 subjects (mean age=22) underwent 3D-echoplanar spectroscopic imaging. The parametric maps of N-acetylaspartate (NAA), creatine (tCr), choline (tCho), myoinositol (mI) and glutamate/glutamine (Glx) were generated using sophisticated post-processing steps. These maps were normalized to MNI atlas. Significant spatial variations in metabolite ratios of NAA/tCr, tCho/tCr, mI/tCr and Glx/tCr were observed across different lobar regions of brain. These findings will undergird future efforts to understand metabolite distributions in neurodevelopmental disorders.
Introduction
Proton MR spectroscopy (1H MRS) provides valuable information about brain metabolism.1-3 Using 1H MRS, several studies4,5 have shown regional variations in metabolite levels across the brain in healthy adults. In contrast to single voxel or single slice multi-voxel 1H MRS, 3D-echoplanar spectroscopic imaging (3D-EPSI) provides whole brain metabolite maps with a better spatial resolution.6,7 These maps can be spatially co-registered to anatomical images to facilitate mapping of metabolite alterations from different regions of brain with less probability of partial volume averaging.8-10 Moreover, the reproducibility of serial measurements of metabolite levels using 3D-EPSI in healthy samples has been tested previously.11 In this study, we mapped the regional distributions of metabolites from different lobar regions of brain in a sample of healthy individuals in late adolescence and early adulthood. Normative data from these individuals will be used to compare brain metabolites in patients with psychosis.Methods
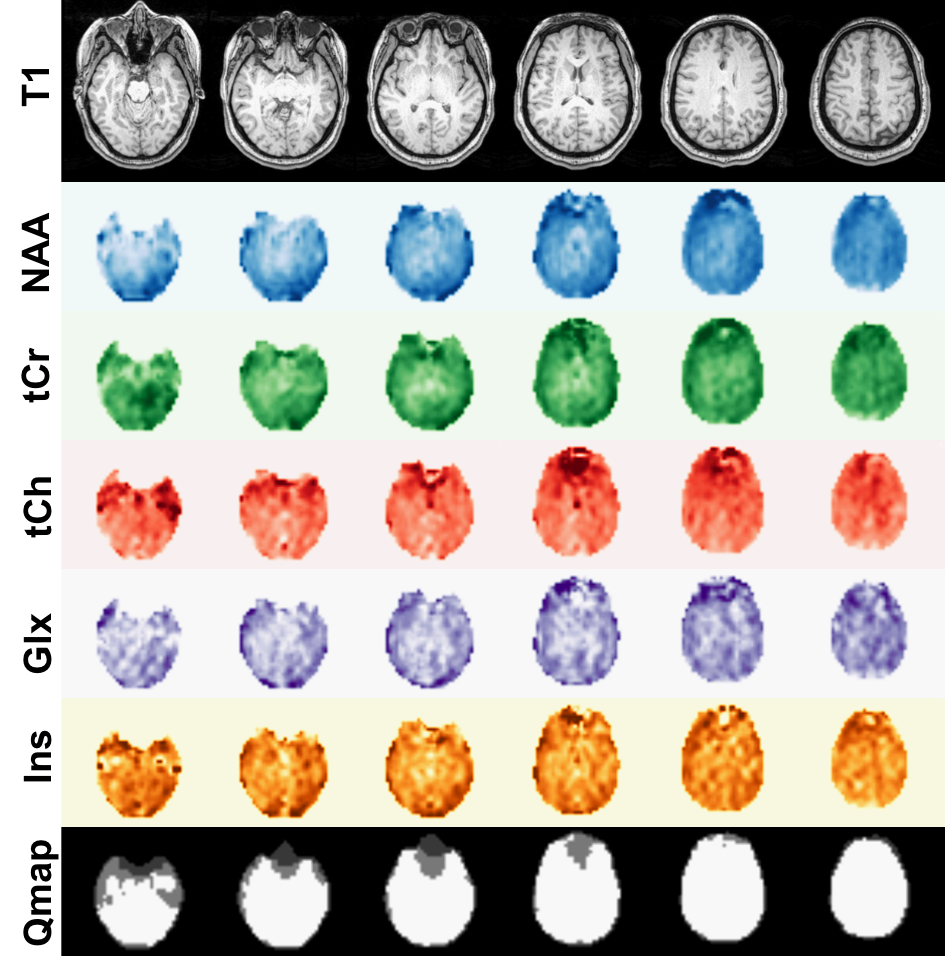
A cohort of 19 young, healthy neurotypical subjects (mean age=22) and three age-matched patients with psychosis underwent anatomical imaging, and 3D-EPSI on a 3T MR system. 3D-EPSI was acquired with a spin-echo sequence with parallel imaging that included interleaved water reference scannig.12 Acquisition parameters were: TR/TE=1550/17.6ms, voxel size=5.6×5.6×10mm3, bandwidth=625Hz. To reduce lipid signal contamination from skull and scalp, an inversion recovery prepared lipid nulling pulse sequence was used in addition to employing an outer volume saturation band covering the skull base. 3D-EPSI data were post-processed using MIDAS software developed by Maudsley et al.7 The raw data were first corrected for B0 field inhomogeneity and eddy current induced distortions. Additional processing steps included re-gridding, followed by spatial and spectral Fourier transformation. Next, brain masks were generated to define the brain region and limit the voxels selected for spectral analysis. Additionally, lipid masks generated from subcutaneous lipid signals were used for lipid k-space extrapolation to reduce ringing artifacts. In each case, quality assurance was conducted by considering the following metrics: Cramer-Rao lower bounds, line shapes, CSF partial volume contribution, and degree of residual water and lipid signals. Finally, parametric maps of N-acetylaspartate (NAA), creatine (tCr), choline (tCho), myoinositol (Ins) and glutamate/glutamine (Glx) were reconstructed. These metabolite maps were normalized to the Montreal Neurological Institute (MNI) atlas. The metabolite ratios of NAA/tCr, tCho/tCr, Ins/tCr and Glx/tCr were computed from bilateral frontal, parietal, occipital and temporal lobes. These metabolite ratios were compared across different regions of brain using one-way analysis of variance (ANOVA) applying Tukey post-hoc test accounting for multiple comparisons. A probabilistic (p) value of less than 0.05 was considered significant.Results and Discussion
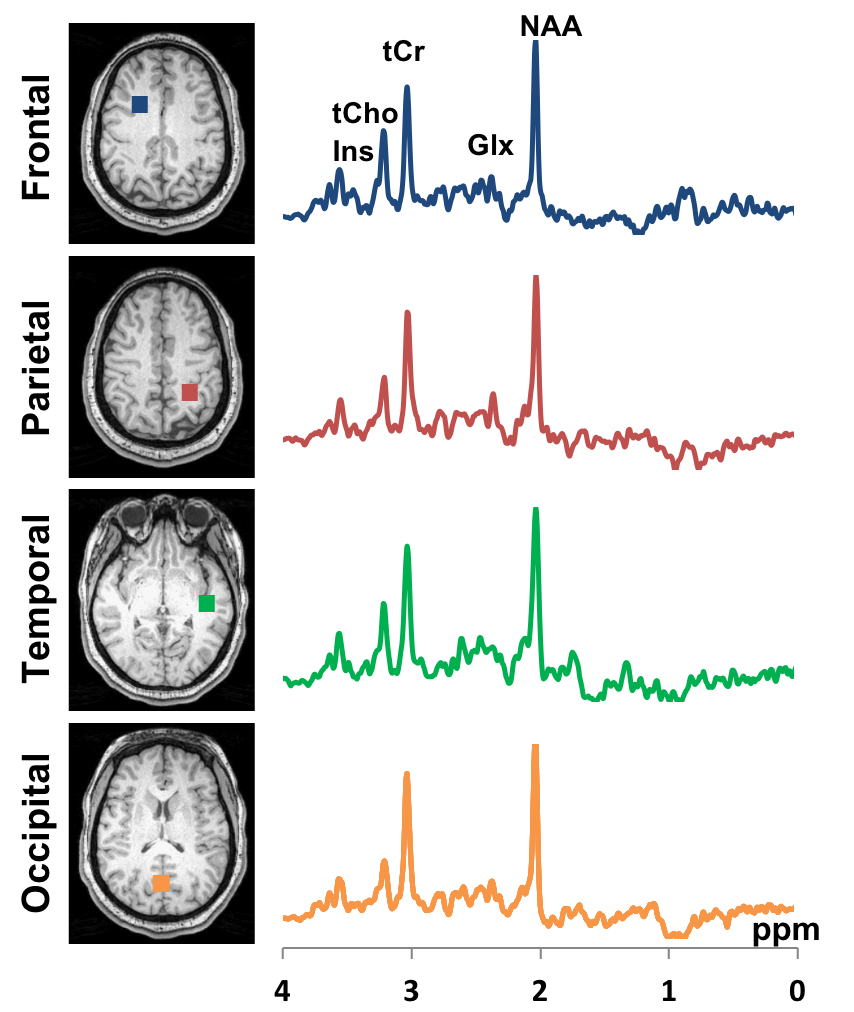
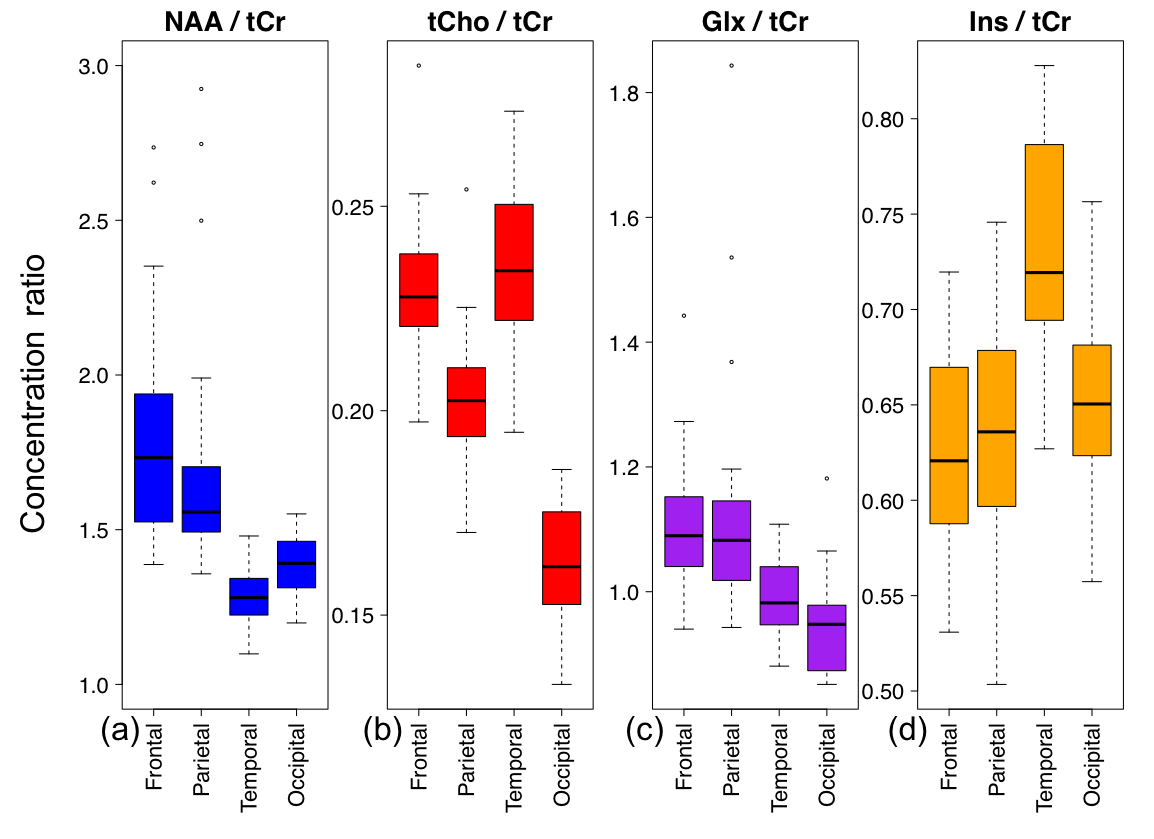
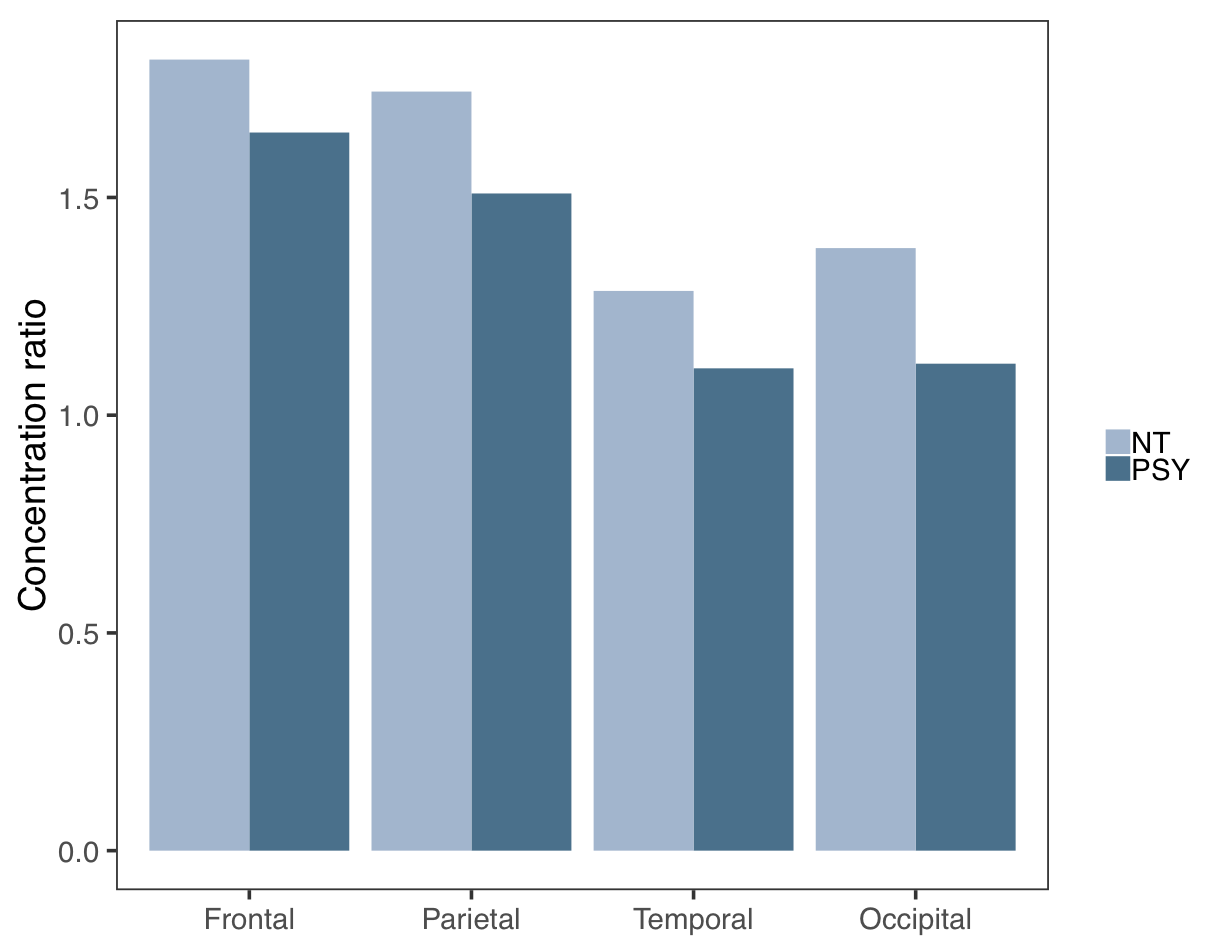
Quality map analysis across all subjects revealed that the majority of voxels were of good spectral quality (mean=65.7 ± 5.8%). Figure 1 shows a representative example of metabolite and quality maps from a healthy subject. Representative summed spectra (16 voxels) from different lobes of the brain are shown in Figure 2. Lobar measurements demonstrated significant (p<0.05) spatial variations for different metabolite ratios across several brain regions (See box-whisker plots in Figure 3). In a previous study, Maudsley et al.13 have also reported differences in metabolite levels between different tissue types and different brain regions from a cohort of healthy subjects with a wide age range (18-59 years). In the present study with young healthy subjects (age:18-30 years), average values of NAA/tCr were lower within the temporal lobes compared to the frontal lobes, yet average values of tCho/tCr were significantly higher in frontal and temporal lobes compared to parietal and occipital lobes. The average values of Glx/tCr were higher in frontal and parietal lobes than occipital and temporal lobes. The mean values of Ins/tCr were significantly higher in temporal lobe compared to other brain regions. We believe that this data from a young normative sample will help compare regional variations in metabolite rations in future studies of young patients with psychosis. In the present study, lower NAA/tCr values were also observed in psychosis patients (n=3), compared to healthy subjects (n=19) in brain regions (preliminary results presented in Figure 4).Conclusion
Considerable variations in metabolite ratios were observed from different regions of brain in a young healthy sample. These maps will be used to compare neurometabolite profiles in neurodevelopmental disorders.Acknowledgements
This project was supported by the National Institute of Mental Health MH089983, MH089924, MH087626, K01MH102609; NARSAD Young Investigator Grant from the Brain & Behavior Research Foundation, the Dowshen Program for Neuroscience at the University of Pennsylvania; and the Life Span Brain Institute (LiBI)—a collaboration between the University of Pennsylvania School of Medicine and Children’s Hospital of Philadelphia.References
1. McKay J, Tkáč I. Quantitative in vivo neurochemical profiling in humans: where are we now? Int J Epidemiol. 2016;45(5):1339-1350.
2. Chawla S, Wang S, Wolf R, et al. Arterial spin-labeling and MR spectroscopy in the differentiation of gliomas. Am J Neuroradiol 2007;28:1683-1689.
3. Chawla S, Krejza J, Vossough A, et al. Differentiation between oligodendroglioma genotypes using dynamic susceptibility contrast perfusion-weighted imaging and proton MR spectroscopy. Am J Neuroradiol 2013;34:1542-1549.
4. Wiedermann D, Schuff N, Matson GB, et al. Short echo time multislice proton magnetic resonance spectroscopic imaging in human brain: metabolite distributions and reliability. Magn Reson Imaging. 2001;19(8):1073-1080.
5. Degaonkar MN, Pomper MG, Barker PB, Quantative proton magnetic resonance spectroscopic imaging: regional variations in the corpus callosum and cortical gray matter. J Magn Reson Imaging. 2005;22(2):175-179.
6. Ebel A, Soher BJ, Maudsley AA. Assessment of 3D proton MR echo‐planar spectroscopic imaging using automated spectral analysis. Magn Reson Med 2001;46:1072-1078.
7. Maudsley AA, Darkazanli A, Alger JR, et al. Comprehensive processing, display and analysis for in vivo MR spectroscopic imaging. NMR Biomed 2006;19:492-503.
8. Chawla S, Wang S, Kim S, et al. Radiation Injury to the Normal Brain Measured by 3D-Echo-Planar Spectroscopic Imaging and Diffusion Tensor Imaging: Initial Experience. J Neuroimaging 2015;25:97-104.
9. Shim H, Holder CA, Olson JJ. Magnetic resonance spectroscopic imaging in the era of pseudoprogression and pseudoresponse in glioblastoma patient management. CNS Oncol 2013;2:393-396.
10. Lin D, Lin Y, Link K, et al. Echoplanar Magnetic Resonance Spectroscopic Imaging Before and Following Radiation Therapy in Patients With High-Grade Glioma. Int J Radiat Oncol Biol Phys 2016;96(2S):E133-E134.
11. Ding XQ, Maudsley AA, Sabati M, et al. Reproducibility and reliability of short-TE whole-brain MR spectroscopic imaging of human brain at 3T. Magn Reson Med. 2015;73(3):921-928.
12. Sabati M, Zhan J, Govind V, et al. Impact of reduced k‐space acquisition on pathologic detectability for volumetric MR spectroscopic imaging. J Magn Reson Imaging 2014;39:224-234.
13. Maudsley AA, Domenig C, Govind V, et al. Mapping of brain metabolite distributions by volumetric proton MR spectroscopic imaging (MRSI). Magn Reson Med. 2009;61(3):548-559.
Figures