2542
The Potential Impact of Multiparametric MRS in the Early Detection of Neurodegeneration in Multiple Sclerosis1Chemical and Biological Physics, Weizmann Institute of Science, Rehovot, Israel, 2Radiology, New York University, New York, NY, United States
Synopsis
Clinical proton MRS conventionally measures metabolites' concentrations, but neglects to acquire their relaxation constants, despite the fact that these are known to vary in many pathologies. Using computer simulations and literature values for n-acetyl-aspartate, we show that incorporating this additional information can greatly facilitate the detection of neurodegeneration in early stage multiple sclerosis (MS), increasing the area under the corresponding receiver operating characteristic curves from 0.68 to 0.91. These results strongly motivate the need for developing robust sequences for clinical multiparametric magnetic resonance spectroscopy .
Introduction
Proton Magnetic Resonance Spectroscopy (1H-MRS) can detect biochemical imbalances in brain tissue before structural abnormalities are observed on conventional MRI. In Multiple Sclerosis (MS), neurodegeneration precedes symptoms and determines patient outcome, and therefore there is high interest in using concentrations of the neuronal marker n-acetyl-aspartate (NAA) to follow treatment effects and disease progression in recently-diagnosed patients. Imaging protocols, however, usually do not acquire metabolites' and water’s relaxation constants (T1, T2), due to lack of time and an appropriate protocol/sequence. Our groups and others, however, have shown that these values in MS are not only different from controls’, but also exhibit regional and inter-subject variations [1-6]. This indicates that using average population values – as opposed to subject-specific values – results in substantial bias to the estimated concentrations. The results also suggest that relaxation times have the potential to provide independent markers of pathophysiology. Given recent interest in multiparametric MRS techniques [7,8], we sought to quantify the sensitivity and specificity gains that might be had by measuring these values for NAA in early stage MS. This is done using receiver operating characteristic (ROC) curves and areas underneath them (AUC). The AUC ranks the performance of a classifier and ranges from 0.5 (useless) to 1.0 (perfect).
Methods
A literature search was conducted on values of metabolite concentrations and relaxation times in MS. The following criteria were used:
- Only data from cerebrum was used.
- Where unavailable, a conservative ±10% population standard deviation was assumed.
- Concentrations: Only values from statistically significant results (p<0.05) obtained by absolute quantification.
- Only work in normal appearing white matter (NAWM) of early relapsing remitting MS was considered.
- For relaxation times, only works at 3T were considered.
We estimated the ROC and AUC using NAA’s T1 [2], T2 [2,6] and concentration changes [1-6], averaged across publications: Controls: NAA=9.2±0.7 mM, T1=1860±200 ms, T2=312±32 ms; Early MS: NAA=8.4±0.6 mM, T1=1680±100 ms, T2=273±44 ms. Reference water values were adopted from [2, 9,10]. Three cases were considered for distinguishing between patients and controls:
- Using NAA/water concentrations alone, corrected using population average values for NAA's and water's T1 and T2.
- Using NAA/water concentrations alone, corrected using each subject’s specific NAA's and water's T1 and T2 values.
- Using a multiparametric optimal linear-combination estimator [11], designed to maximize the AUC, comprised of NAA’s (true, unweighted) concentrations, T1 and T2 values (no reference to water values was used).
For all cases, the water reference signal was left uncorrected (we note The ROCs for each case were calculated using Monte Carlo simulations as follows: NAA and water concentrations, T1 and T2 values were randomly generated for 10,000 controls and 10,000 patients assuming normal distributions and using literature values. Weighted NAA/water ratios were generated assuming a simple spin-echo pulse sequence (with TR/TE=1500/40 ms, FA=90 degrees) and a perfectly homogeneous radiofrequency transmitter, via:
$$C_{NAA}^{Weighted}=(1-e^{-TR/T_{1,NAA}})e^{-TE/T_{2,NAA}} C_{NAA}$$
$$C_{Water}^{Weighted}=(1-e^{-TR/T_{1,Water}})e^{-TE/T_{2,Water}} C_{Water}$$
For cases (1-3), the weighted NAA and water values were corrected by dividing them by a correction factor of the form:
$$f=(1-e^{-TR/T_{1,c}})e^{-TE/T_{2,c}}$$
For case (1), population means were substituted for T1,c, T2,c, while for cases (2) and (3), subject-specific values were used. The NAA concentrations were estimated via:
$$C_{NAA}^{Est.} = \frac{C_{NAA}^{Weighted}}{C_{Water}^{Weighted}} \frac{f_{Water}}{f_{NAA}} \bar{C}_{Water}$$
with $$$\bar{C}_{Water}$$$ being the population mean value of the water concentration (i.e. as done in absolute quantification in MRS).
For case (3), the linear classifier $$$CLASS=a_1 C_{NAA} + a_2 T_{1,NAA} + a_3 T_{2, NAA}$$$ was formed for each subject, with a1=1.0, a2=0.0038 mM/ms, a3=0.0093 mM/ms (as described in [11]). Using NAA (cases 1 & 2) or CLASS (case 3), the ROC was generated numerically by varying the classification threshold from -infinity to +infinity. The AUC was estimated via numerical integration of the ROC.
Results
Fig. 1 shows the distributions of corrected NAA/water concentration ratios (cases 1, 2) and CLASS (case 3) for healthy controls and MS patients, alongside their respective AUCs: 0.68, 0.81 and 0.91. The significant increase from case (1) (AUC=0.68) to case (2) (AUC=0.81) demonstrates the importance of using subject‑specific relaxation coefficients when correcting metabolite (and water reference) concentrations. The significant increase from case (2) (AUC=0.81) to case (3) (AUC=0.91) demonstrates that T1 and T2 themselves can act as potentially powerful biomarkers and could have significant impact on the clinical applicability of multiparametric MRS.Discussion & Conclusions
Our results demonstrate substantial gains to the sensitivity and specificity of clinical (single‑voxel) MRS, which can be had by incorporating subject-specific knowledge of metabolites’ relaxation constants[. This strongly motivates the focus on new, advanced, multiparametric MRS protocols, which can provide metabolite concentrations and relaxation times within clinical timescales and voxel sizes.Acknowledgements
Assaf Tal acknowledges the support of the Monroy‐Marks Career Development Fund, the Carolito Stiftung Fund, the Leona M. and Harry B.Helmsley Charitable Trust and the historic generosity of the Harold Perlman Family. Ivan Kirov acknowledges the support of National Institutes of Health (NIH) funding grants R01 NS097494 and P41 EB017183.
References
1. Hattingen E, Magerkurth J, Pilatus U, Hubers A, Wahl M, Ziemann U. Combined (1)H and (31)P spectroscopy provides new insights into the pathobiochemistry of brain damage in multiple sclerosis. NMR in biomedicine. 2011;24(5):536-546.
2. Srinivasan R, Sailasuta N, Hurd R, Nelson S, Pelletier D. Evidence of elevated glutamate in multiple sclerosis using magnetic resonance spectroscopy at 3 T. Brain. 2005;128(Pt 5):1016-1025.
3. Kapeller P, McLean MA, Griffin CM, Chard D, Parker GJ, Barker GJ, . . . Miller DH. Preliminary evidence for neuronal damage in cortical grey matter and normal appearing white matter in short duration relapsing-remitting multiple sclerosis: a quantitative MR spectroscopic imaging study. J Neurol. 2001;248(2):131-138.
4. Chard DT, Griffin CM, McLean MA, Kapeller P, Kapoor R, Thompson AJ, Miller DH. Brain metabolite changes in cortical grey and normal-appearing white matter in clinically early relapsing-remitting multiple sclerosis. Brain. 2002;125(Pt 10):2342-2352.
5. Tiberio M, Chard DT, Altmann DR, Davies G, Griffin CM, McLean MA, . . . Miller DH. Metabolite changes in early relapsing-remitting multiple sclerosis. A two year follow-up study. J Neurol. 2006;253(2):224-230.
6. Kirov, II, Liu S, Fleysher R, Fleysher L, Babb JS, Herbert J, Gonen O. Brain metabolite proton T2 mapping at 3.0 T in relapsing-remitting multiple sclerosis. Radiology. 2010;254(3):858-866.
7. Kulpanovich A, Tal A. The application of magnetic resonance fingerprinting to single voxel proton spectroscopy. NMR in biomedicine. 2018;31(11):e4001.
8. An L, Li S, Shen J. Simultaneous determination of metabolite concentrations, T1 and T2 relaxation times. Magnetic resonance in medicine. 2017;78(6):2072-2081.
9. Shepherd TM, Kirov II, Charlson E, et al. New rapid, accurate T2 quantification detects pathology in normal-appearing brain regions of relapsing-remitting MS patients. Neuroimage Clin. 2017;14:363-370.
10. Vrenken H, Geurts JJ, Knol DL, et al. Whole-brain T1 mapping in multiple sclerosis: global changes of normal-appearing gray and white matter. Radiology. 2006;240(3):811-820.
11. Kang L, Liu A, Tian L. Linear combination methods to improve diagnostic/prognostic accuracy on future observations. Stat Methods Med Res. 2016;25(4):1359-1380.
Figures
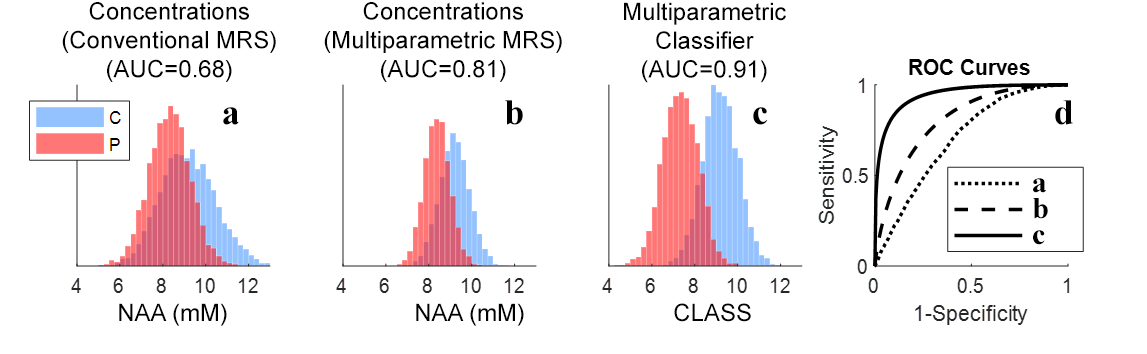
Patients and controls in early stage multiple sclerosis: (a) NAA concentrations quantified using population-averaged T1 and T2 values (AUC=0.68). (b) NAA concentrations quantified using subject-specific T1 and T2 values (AUC=81). (c) Combined optimal linear classifier (CLASS), as described in the text, comprised of a weighted average of concentrations and T1 and T2 values of NAA (AUC=0.91). (d) Respective ROC curves for each of the three cases.