2540
Metabolic abnormalities in cingulate gyrus in HIV infection by 3D rosette spectroscopic imaging1University of Pittsburgh, Pittsburgh, PA, United States, 2University of California, Los Angeles, Los Angeles, CA, United States, 3Johns Hopkins University, Baltimore, MD, United States, 4Northwestern University, Chicago, IL, United States
Synopsis
The purpose of this study was to assess metabolic abnormalities in HIV infection by MRSI covering brain cortex and parts of striatum. Sixteen HIV-seropositive subjects (younger and older than 60) and age-matched 30 seronegative controls were evaluated using a fast rosette 3D MRSI sequence at 3T, segmentation and parcellation into 13 brain regions, and fGM regression statistics to evaluate abnormalities. MI/NAA, Cr/NAA, Ch/NAA and Ch/Cr increase in anterior and posterior cingulate as a function of HIV serostatus and age. Fast MRSI enables the detection of subtle metabolic abnormalities in HIV infection at clinically acceptable scan times (<10 min) at 3T.
Introduction
A recent quest for novel biomarkers for progression and treatment of HIV-associated neurocognitive disorder highlighted the potential of MRI/MRS. Decreases in N-acetylaspartate (NAA) and increases in choline-containing compounds (Ch) have been consistently observed in vivoin the brains of HIV-infected individuals1-3. Recently, we validated fast 3D MRSI using rosette trajectories at 3 T using 48-mm slabs with regression analyses against the tissue GM fraction for the identification of neocortical abnormalities 4. The purpose of this study was to assess metabolic abnormalities in HIV infection by MRSI covering brain cortex and parts of striatum.Methods
A group of 16 HIV-seropositive subjects (in two age groups, <60 (n=8) and >60 (n=7) years old) and age-matched 30 seronegative controls (in two age groups, <60 (n=18) and >60 (n=12) years old) were evaluated using a Siemens 3 T Prisma scanner. The data were acquired using a fast rosette 3D MRSI sequence (9.6 min), as reported previously 4, using an FOV of 20×20×4.8 cm with in-plane rosette encoding and conventional phase encoding in the slab direction, in total, 20×20×12 encodes across the FOV, and the spectral bandwidth of 1250 Hz. The whole slab sequence was acquired using a 40-mm slab-selective excitation, a non-selective adiabatic inversion pulse for lipid suppression and a numerically optimized semi-selective frequency-refocusing pulse for water suppression with TE/TIR/TR = 20/240/2000 ms. The 1-mm isotropic MPRAGE was segmented and parcellated using FreeSurfer, and co-registered to the RSI scan with SPM. The gray, white and CSF content of each RSI voxel was calculated by convolving the high-resolution segmented maps with the point spread function of RSI and profile of the slab-selective excitation pulse. The spectral data were automatically fitted with LCModel 5using 12 GAMMA-simulated metabolite functions. The Cr/NAA, Ch/NAA, MI/Ch, MI/NAA, Ch/Cr and Glu/NAA peak ratios were evaluated for each of the MRSI voxels. Statistically significant changes in metabolite peak ratios in the patient brains were identified based on the regression statistics from the pooled seronegative controls in the age group corresponding to that of the patient. Linear regression analyses against a gray matter fraction (fGM) were performed separately for each of 13 individual brain regions.Results
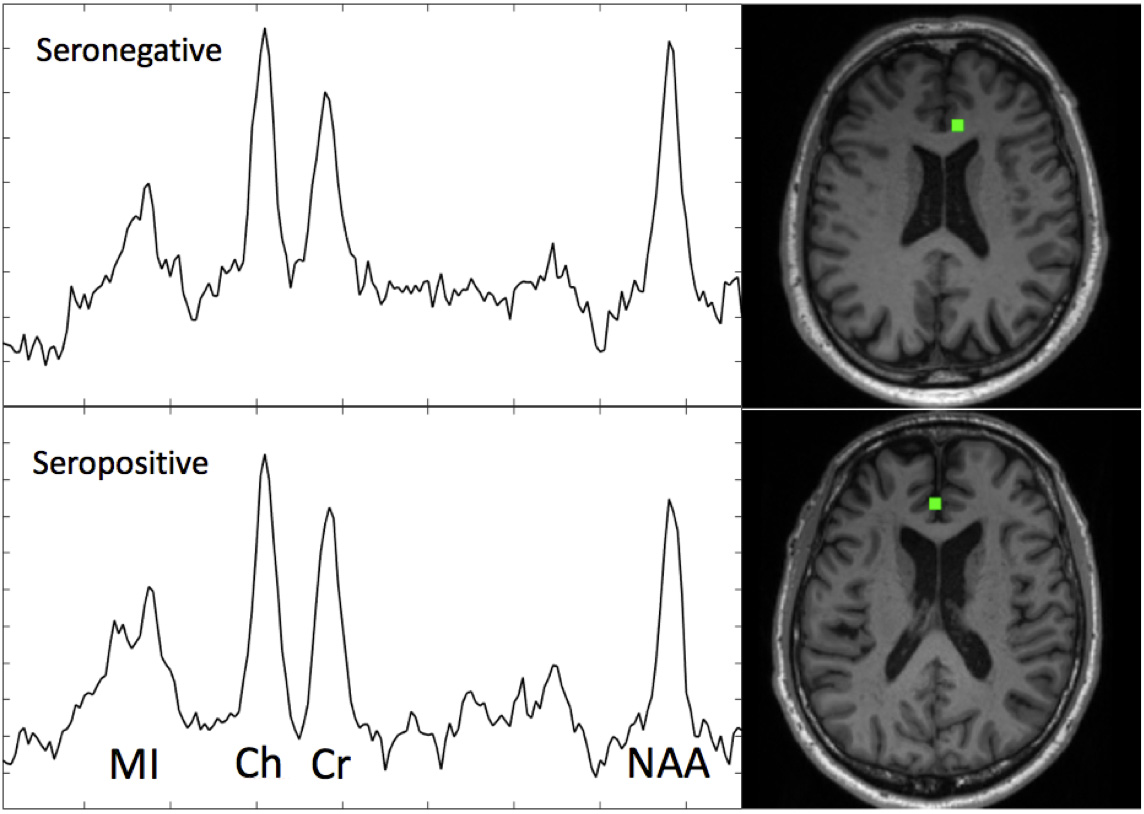
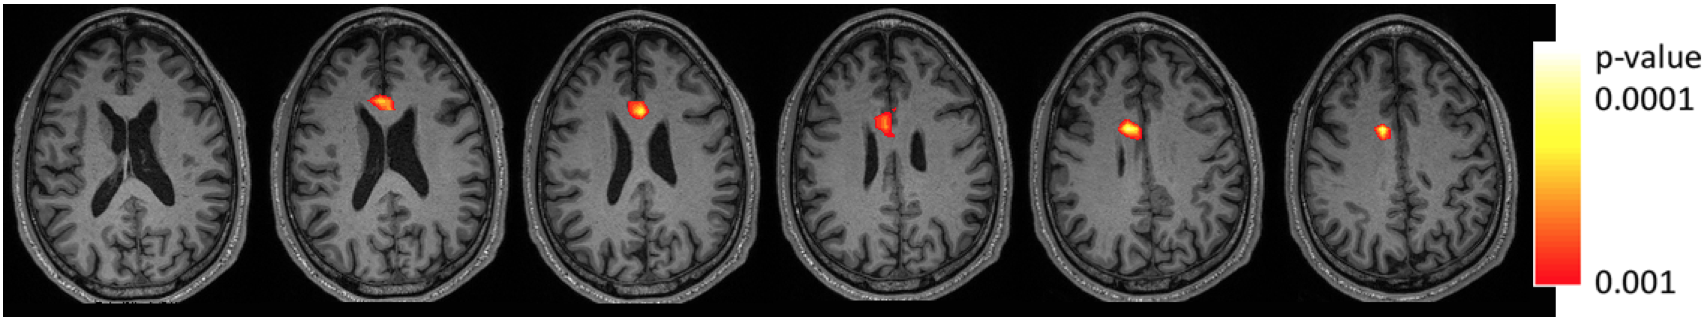
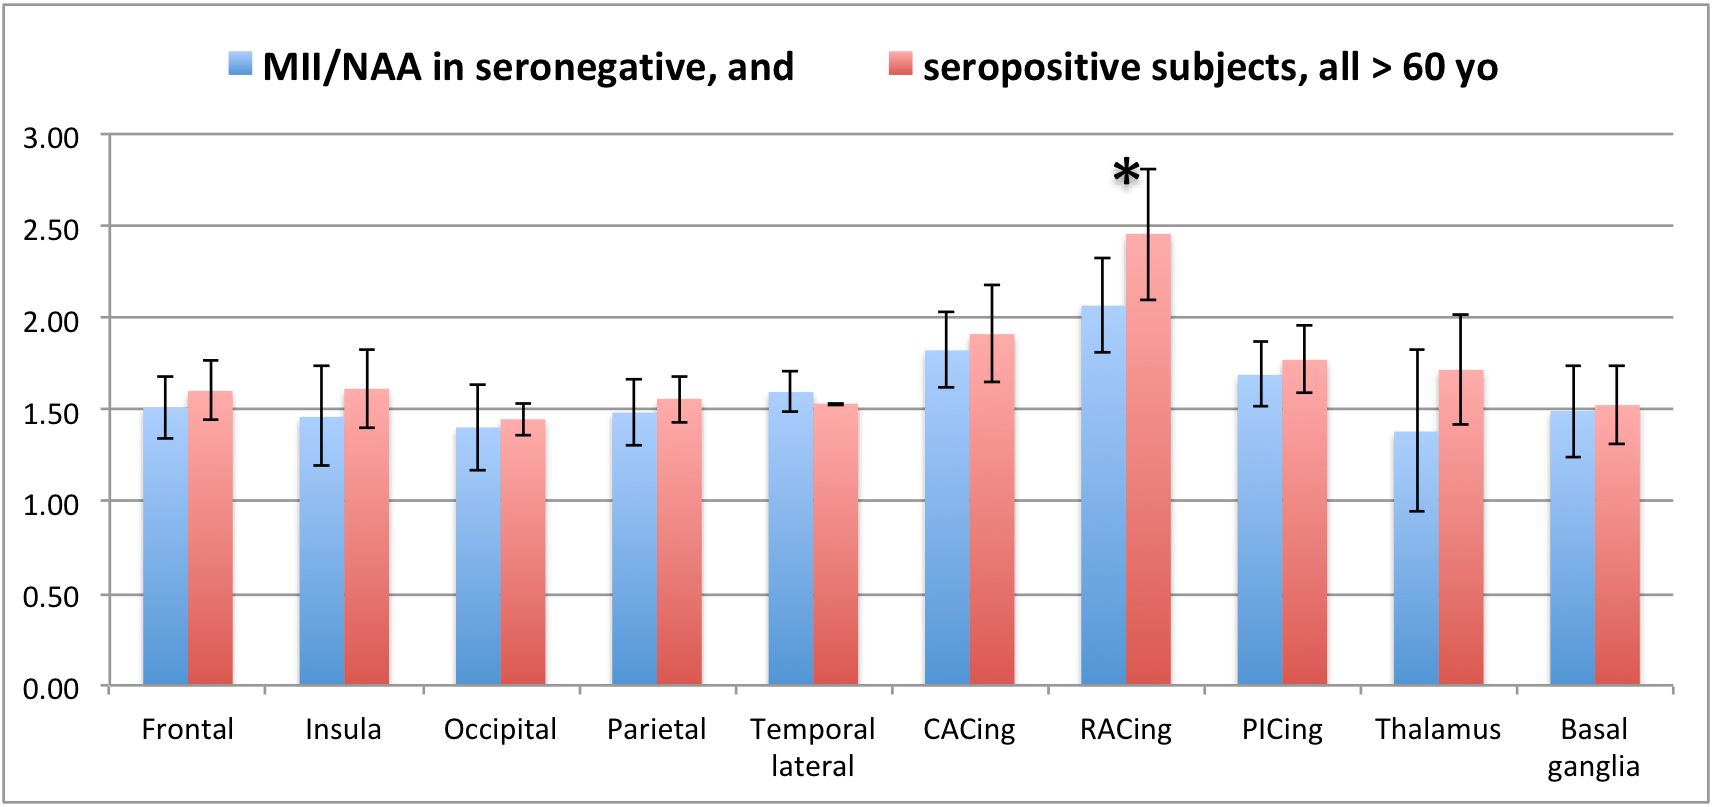
Typical rostral anterior cingulate cortex (RACing) spectra (from the voxels labeled in green) are shown in Fig. 1; CRLB of the fits for peaks of interest were 4-9%. Detection of abnormality in RACing using a {Cr/NAA; fGM} regression is demonstrated in Fig 2. A statistically significant increase in the MI/NAA ratio occurred in older seropositive subjects in comparison to their age-matched controls (Cohen’s d = 1.24), as shown in Fig. 3. The MI/NAA increase was accompanied by an increase in Cr/NAA (d = 0.94), which, however, did not reach statistical significance. The Ch/NAA and Ch/Cr ratios showed more disseminated increases in younger seropositive subjects in comparison to their age matched control group (d between 0.8-1.3 in regions with significant differences).
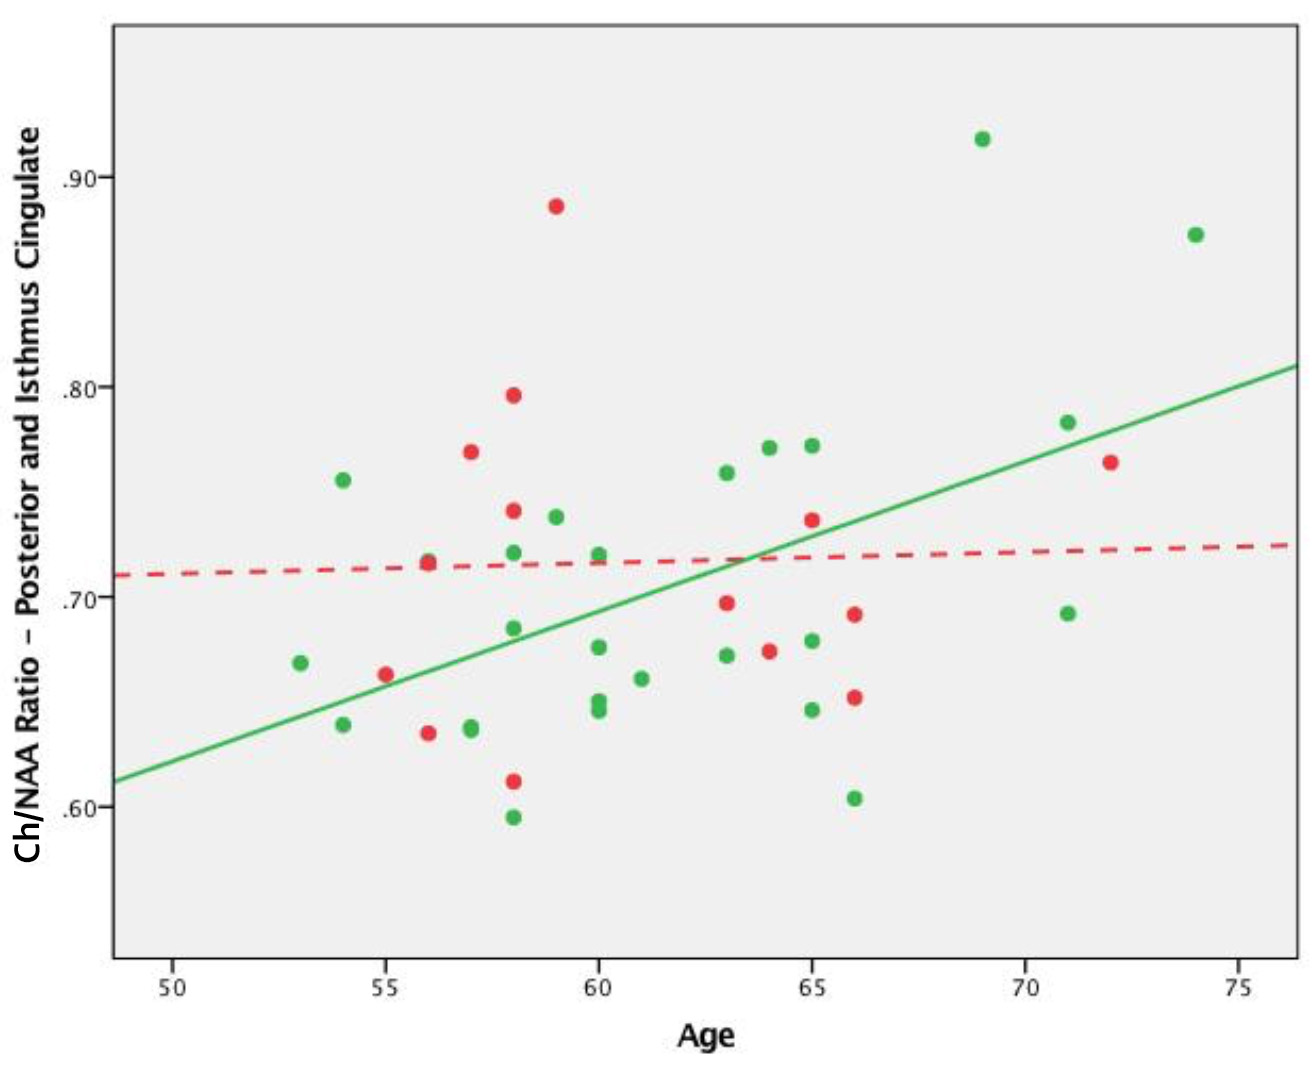
Cr/NAA increased with age in the posterior+isthmus cingulate cortex (PICing), but not as a function of serostatus, whereas Ch/Cr increased slightly as a function of serostatus, but not age. We found consistent increases in the Ch/NAA ratios in cortical regions including the occipital (r=0.48), parietal (r=0.24) and lateral temporal cortices (r=0.48) with age. In the PICing, there was a significant association of Ch/NAA with age among the HIV- (r=0.51) but not the HIV+ subjects (r=0.03) as shown in Fig. 4; a similar pattern was found in the lateral temporal lobe (r=0.60 and 0.08, respectively).
Discussion
The differences in the Ch/NAA ratios likely reflect differences in both Ch and NAA levels. The increase in MI and Ch and corresponding decrease in NAA may indicate neuroinflammation and neuronal injury occurring across the brain, in particular, in parts of its limbic system associated with cognitive function and memory (cingulate cortex). Systematic increases in Cr/NAA and Ch/NAA are consistent with an age-related reduction in NAA. These factors, when combined, may explain the interaction between HIV infection and age in the metabolic profile found in the PICing, a brain region critical for normal cognitive function. The absence of association of Ch/NAA with age in HIV+ but not in HIV- subjects may be caused by breakdown or acceleration of normal age-related metabolic regulation.Conclusion
Fast MRSI enables the detection of subtle metabolic abnormalities in HIV infection at clinically acceptable scan times (<10 min) at 3 T. It may be a useful complementary tool in monitoring disease progression and response to therapy.Acknowledgements
NIH grants R01 AG034852, NS090417.References
1. Masters MC, Ances BM. Role of neuroimaging in HIV-associated neurocognitive disorders. Semin. Neurol. 2014; 34(1): 89–102.
2. Price RW, Epstein LG, Becker JT, et al. Biomarkers of HIV-1 CNS infection and injury. Neurology 2007; 69: 1781-1788.
3. Mohamed M, Barker PB, Skolasky RL, Sacktor N. 7T Brain MRS in HIV Infection: Correlation with Cognitive Impairment and Performance on Neuropsychological Tests. ANJR Am. J. Neuroradiol. 2018; 39: 704-712.
4. Schirda CV, Zhao T, Yushmanov VE, et al. Fast 3D rosette spectroscopic imaging of neocortical abnormalities at 3 T: Assessment of spectral quality. Magn. Reson. Med. 2017; 79: 2470-2480.
5. Provencher SW. Automatic quantitation of localized in vivo 1H spectra with LCModel. NMR Biomed. 2001; 14(4): 260-264.
Figures