2539
Accelerated Five-Dimensional Echo-Planar Correlated Spectroscopic Imaging to assess Lipids and Metabolite differences between Type-2 Diabetic and Healthy Calf Muscle1Radiological Sciences, University of California, Los Angeles, Los Angeles, CA, United States, 2Medicine, University of California, Los Angeles, Los Angeles, CA, United States, 3Institute for Applied Life Sciences, University of Massachusetts at Amherst, Amherst, MA, United States
Synopsis
Obesity-related diseases such as Type 2 Diabetes have become increasingly widespread. This condition can be characterized in part by changes in the fat composition of muscle, specifically in the relative concentrations of extra-myocellular (EMCL) and intra-myocellular (IMCL) lipids. Although 1D MRS techniques have been applied to assess skeletal muscle metabolite composition, they are hindered by lipid contamination from EMCL and spectral overlap which can complicate quantitation and differentiation from IMCL. 2D MRS improves spectral dispersion, allowing clear separation of both EMCL and IMCL and determination of the unsaturation index of muscle lipids. In this study, we apply a 5D (3D spatial + 2 spectral) echo-planer correlated spectroscopic imaging (EP-COSI) technique to assess the lipid and metabolic differences within the calf muscle among three groups of subjects – diabetic, age-matched healthy, and young healthy controls.
Introduction
Obesity-related diseases such as Type 2 Diabetes have become increasingly widespread 1-2. This condition can be characterized in part by changes in the fat composition of muscle, specifically in the relative concentrations of extra-myocellular (EMCL) and intra-myocellular (IMCL) lipids3-4. Previous findings from 1D MRS, for example, have shown a negative correlation of IMCL with insulin sensitivity5-6. There are also differences in the amount of type I and type II muscle fibers between diabetic and non-diabetic populations, which can be reflected in the metabolic properties measureable with MRS7. Although 1D MRS techniques have been applied to assess skeletal muscle metabolite composition, they are hindered by lipid contamination from EMCL and spectral overlap which can complicate quantitation and differentiation from IMCL. 2D MRS improves spectral dispersion, allowing clear separation of both EMCL and IMCL and determination of the unsaturation index of muscle lipids. In this study, we validate a 5D (3D spatial + 2 spectral) echo-planar correlated spectroscopic imaging (EP-COSI) technique8 to assess the lipid and metabolic differences within the calf muscle among three groups of subjects – diabetic, age-matched healthy, and young healthy controls.Methods
In
an IRB-approved study, 12 diabetic patients, 10 healthy age-matched and 9 young
healthy controls were recruited to record 5D EP-COSI data in calf, using a 3T
scanner with the following parameters: TR = 1.5 s, TE = 35 ms, voxel size = 1.5
× 1.5 × 1.5 cm3, matrix size = 16 × 16 × 8, spectral width SW2
= 1190 Hz, SW1 = 1250 Hz, 512 t2 points, 64 t1
increments. Both a water and non-water-suppressed scan were acquired for eddy
current and phase corrections. The data was non-uniformly undersampled in the ky-kz
space and t1 dimension for an acceleration factor of 8, resulting in
a total scan time of 28.8 minutes, and the 5D EP-COSI data was reconstructed using a Group
Sparsity-based compressed sensing algorithm.The ratios with respect to Cre3.0
(creatine at 3 ppm) were quantified using peak integral values for the
following metabolites: FAT (lipids at 1.4 ppm), Cre3.0, Cho (3.2 ppm), Cre3.9, UFD
(olefinic fat at 5.4 ppm), carnosine (8 ppm), EMCL1 & EMCL2, IMCL1 &
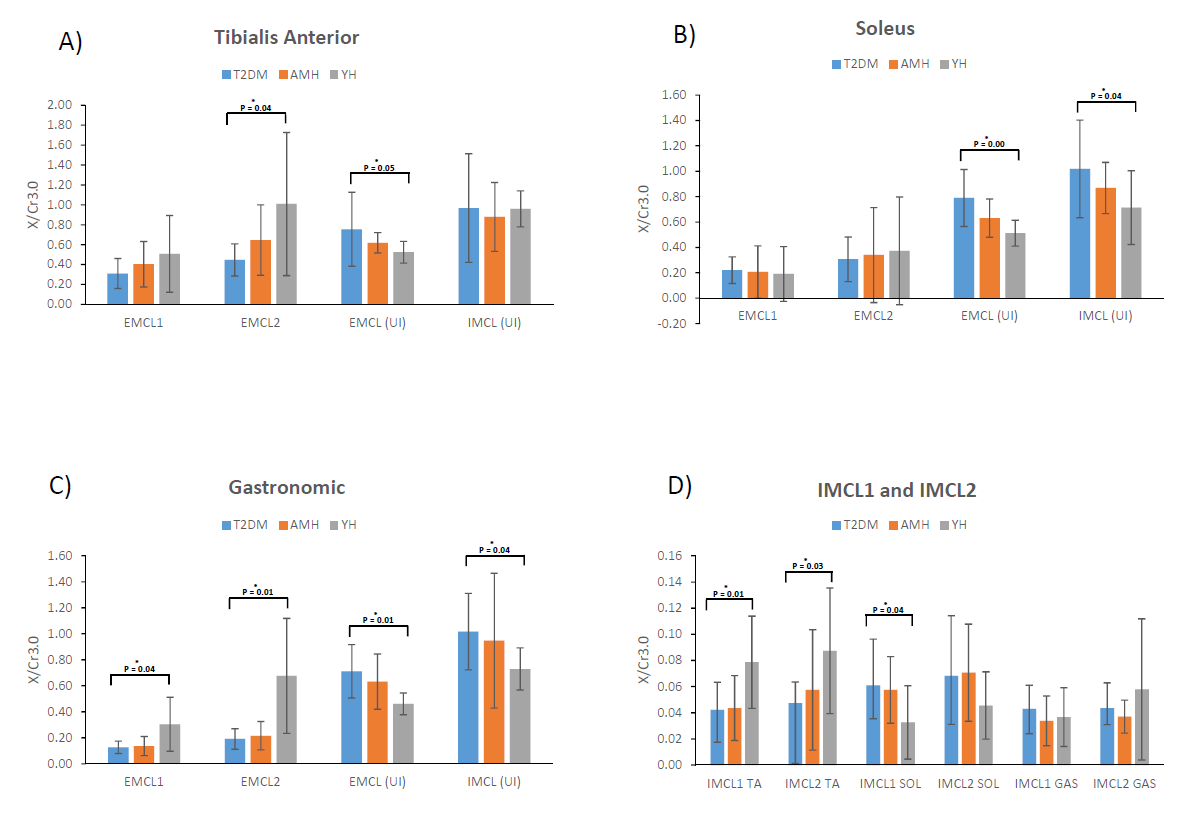
IMCL2. The EMCL and IMCL unsaturation
indices (UI) were defined as EMCL1/EMCL2 and IMCL1/IMCL2, respectively. The respective changes in the EMCL and IMCL UI's among the three groups were determined.Results
The 5D EP-COSI
technique measures 2D MRS data within multiple slices, allowing for broad
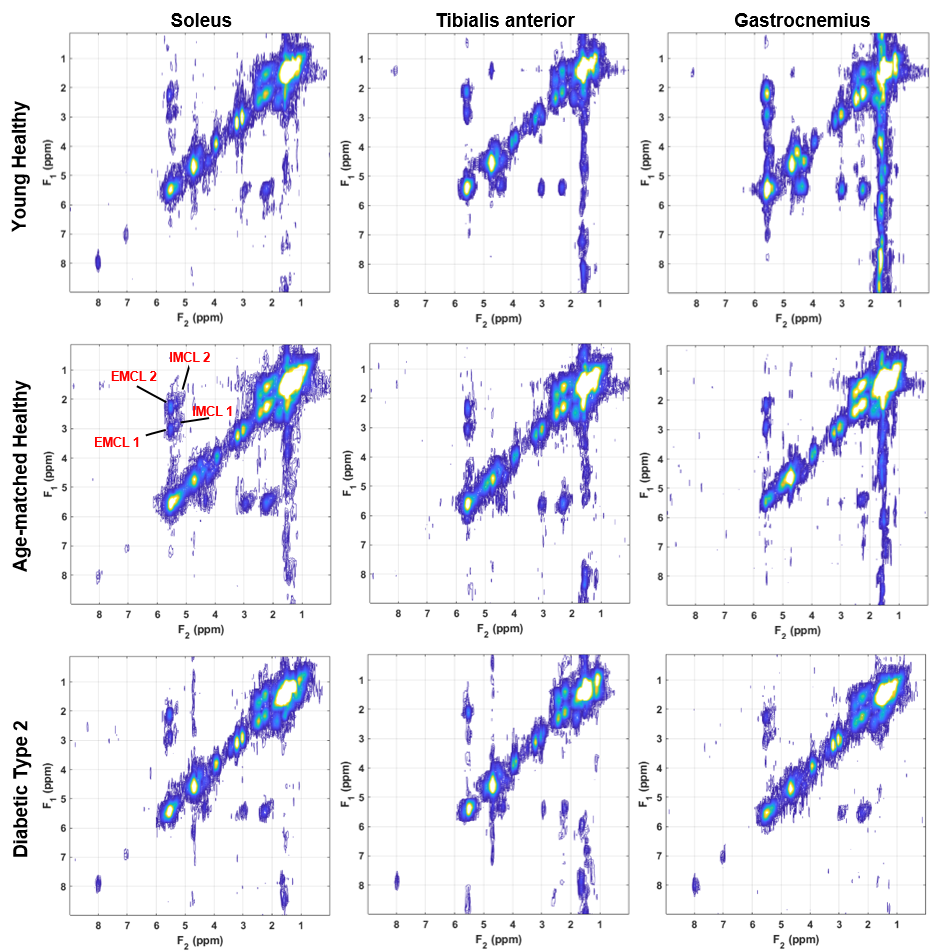
coverage of the calf muscle (Figure 1). Spectral characteristics can be differentiated among the various muscle compartments in the calf - soleus (SOL), tibialis anterior (TA) and gastrocnemius (GAS) (Figure 2). Differences among these regions can be seen in Figure 3 in which the diagonal peak of carnosine (8 ppm) is present in all soleus muscles, the diagonal creatine peak at 3.9 is
split into a doublet all tibialis anterior muscles but remains a
single peak in the soleus. The doublet is due to residual dipolar coupling in the type 2 muscle fibers. The EMCL UI shows significant decrease in the TA, SOL and GAS, whereas the IMCL UI shows decreases only in the SOL and TA among all groups (Figure 4).There is no significant changes of IMCL1 and IMCL2 in the diabetic group within the TA.
Discussion
Compared to 1D MRS findings, 2D COSY spectra in different muscle regions show feasibility of separating the unsaturated lipids from the saturated portions and detection of choline, creatine, myo-inositol, taurine and carnosine at a resolution of 3.4ml. Even though there were significant differences between the diabetics and young healthy volunteers, less or no significance in age-matched healthy subjects compared to diabetics. Another drawback was due to minimal detection of resonances on the aromatic region due to chemical shift displacement error (CSDE) that can be minimized by using adiabatic RF pulses for the VOI localization. Quantitative results can be further improved by using optimal methods such as prior-knowledge fitting (ProFit).Conclusion
Our pilot validation of the 5D EP-COSI sequence shows changes in unsaturated and saturated lipids as well as metabolites in type 2 diabetes compared to healthy subjects. Further validation is essential to demonstrate the reliability of the findings in vivo.Acknowledgements
This research was supported by a grant from NIH/NIBIB: (R21EB02088302).References
[1] Adams, K. F. N. Engl. J. Med. 355, 763–778 (2006)
[2] James, P. T., Rigby, N. & Leach, R. International Obesity Task Force. The obesity epidemic, metabolic syndrome and future prevention strategies. Eur. J. Cardiovasc. Prev. Rehabil. 11, 3–8 (2004).
[3] Boesch, C., Slotboom, J., Hoppeler, H. & Kreis, R. In vivo determination of intra-myocellular lipids in human muscle by means of localized H-1 MR spectroscopy. Magn. Reson. Med. 37, 484–493 (1997).
[4] Szczepaniak, L. et al. Stein Measurement of intracellular triglycerides stores by 1H spectroscopy: validation in vivo. Am. J. Physiol. Endocrinol. Metab. 276, E977–E989 (1999).
[5] Jacob, S. et al. Association of increased intramyocellular lipid content with insulin resistance in lean nondiabetic ofspring of type 2 diabetic subjects. Diabetes. 48, 1113–1119 (1999).
[6] Krssak, M. et al. Intramyocellular lipid concentrations are correlated with insulin sensitivity in humans: a 1H NMR spectroscopy study. Diabetologia. 42, 113–116 (1999).
[7] . Kern, P. A., Simsolo, R. B. & Fournier, M. Effect of weight loss on muscle fiber type, fiber size, capillarity, and succinate dehydrogenase activity in humans. J. Clin. Endocrinol. Metab. 84, 4185–90 (1999).
[8] Wilson, N. E., Burns, B. L., Iqbal, Z., & Thomas, M. A. Correlated spectroscopic imaging of calf muscle in three spatial dimensions using group sparse reconstruction of undersampled single and multichannel data. Magnetic resonance in medicine, 74(5), 1199-1208 (2015).
Figures
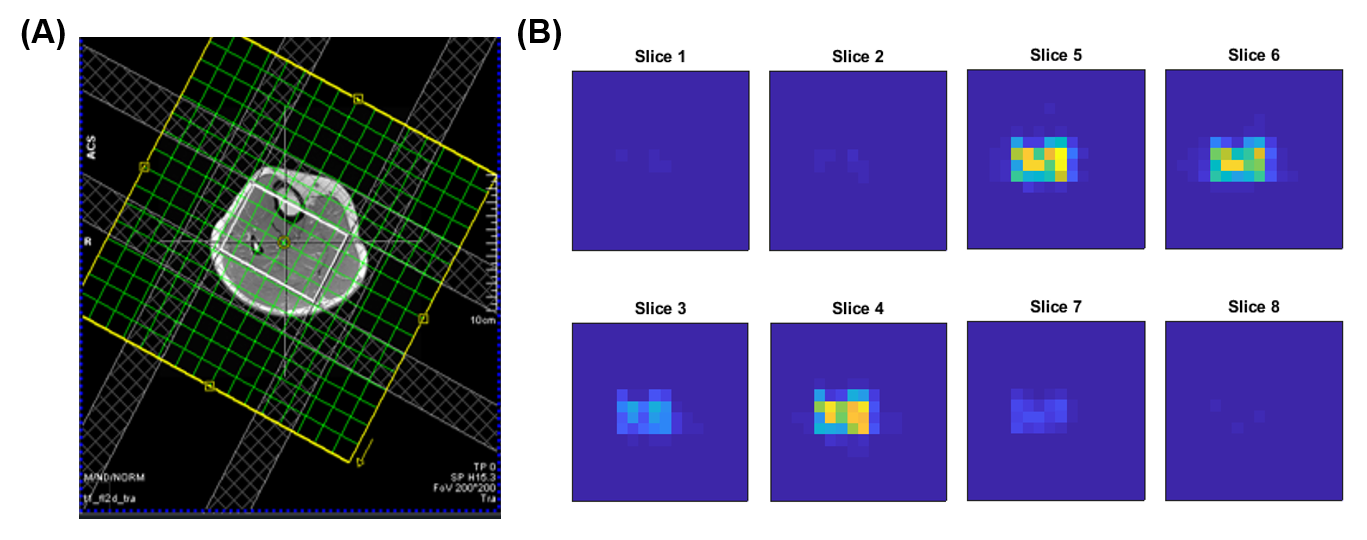
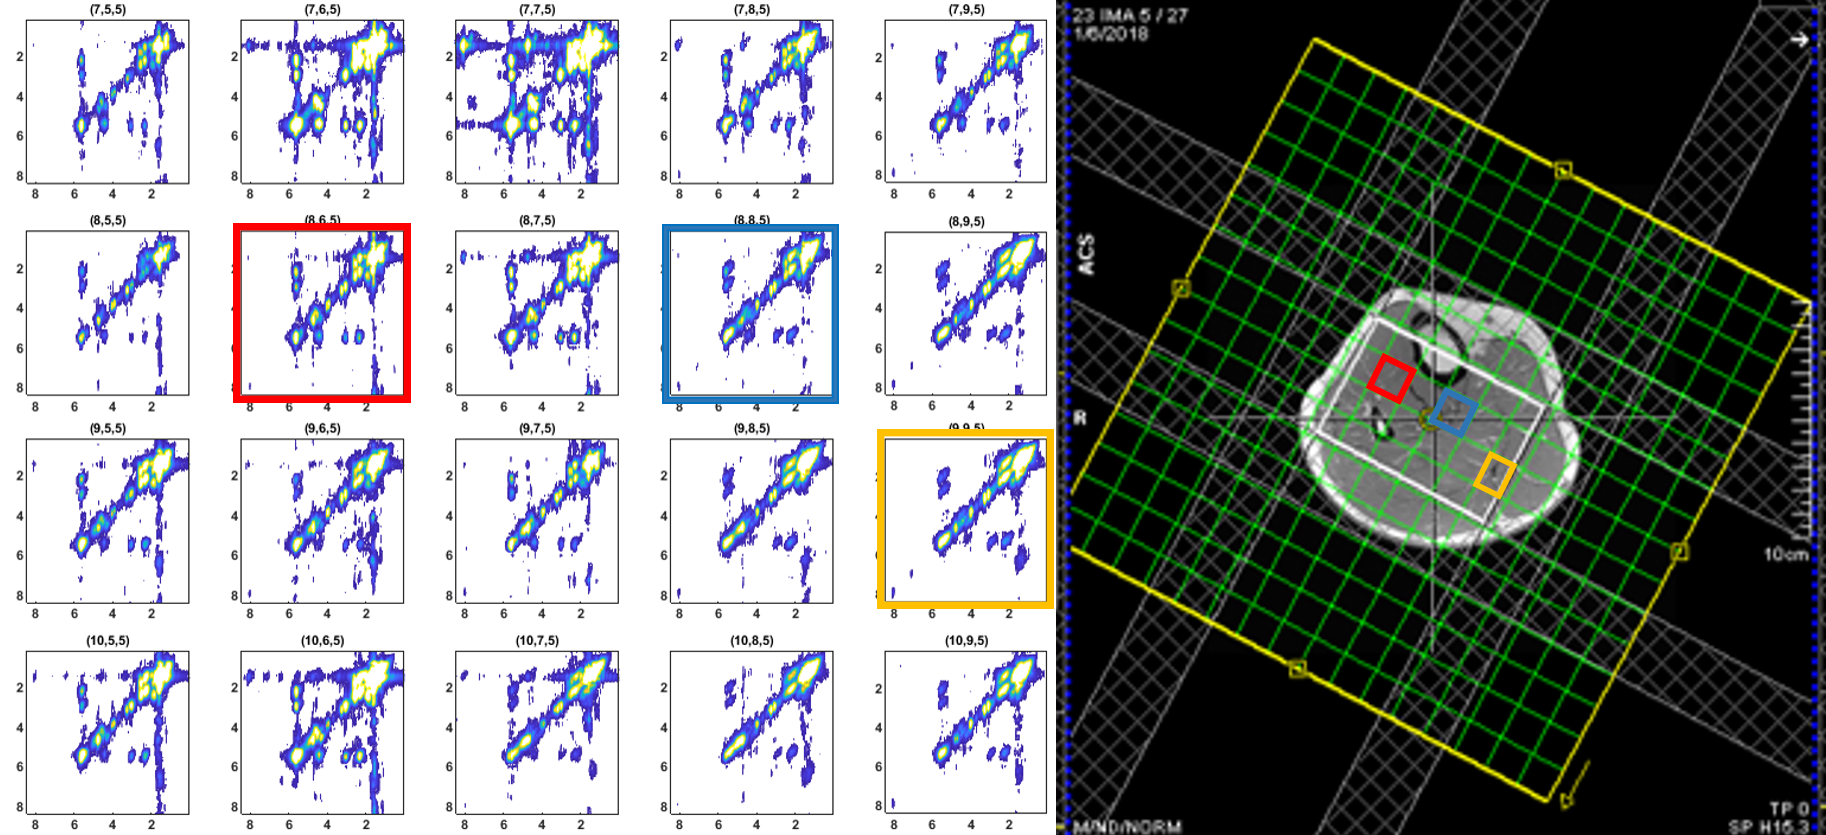
Figure 2: (Left) Multi-voxel COSY spectra in a 4 x 5 region covering the tibialis anterior (red), soleus (blue), and gastrocnemius (yellow) muscles in the calf (right) of a 55 year-old type-2 diabetic patient.