2535
Evaluation of the elevated signal at 3.55 ppm in 1H MRS spectra of certain glioma patients1Diagnostic and Interventional Neuroradiology, University Hospital Tuebingen, Germany, Tuebingen, Germany
Synopsis
In MR-spectroscopy of gliomas, sometimes an elevation of the signal at 3.55 ppm at an echo time of 135 ms is found, which can be interpreted as myo-inositol or as glycine. Due to coupling effects, the signal of inositol should be reduced at an echo time of 90 ms, while the glycine signal should be larger than at TE 135 ms. In measurements of glioma patients, which show an enhanced signal at 3.55 ppm at TE 135ms, we found a decreased signal at TE 90. Therefore, we saw no indication of elevated glycine concentration in gliomas.
Introduction
Magnetic-resonance-spectroscopy (MRS) allows the detection of several metabolites (e.g. N-acetylaspartate (NAA), Choline (Cho), Creatinine (Cr), myo-inositol (Ins) and Glycine (Glyc). In glioma the concentration of these metabolites changes compared to healthy brain tissue. One metabolite, which has been in focus of research over the last years, is Glyc. Its two protons produce a singlet signal at 3.55 ppm [1], which is subject to a continuous decrease over time (T2 decay). Glyc is often reported to be an elevated metabolite in glioma. [2, 3] Its signal is overlapped by the more intense signal of myo-inositol (Ins), making accurate detection difficult. The Ins signal consists of a triplet-like structure and a doublet of doublets [4]. These coupling effects lead to a loss of the Ins signal between 60-100ms TE in the spin-echo sequence (SE) [5]. Today, the usage of spin-echo sequence in clinical settings is slowly replaced by the semilaser sequence (sLaser). Therefore, the purpose of this study was exploring the described loss of signal in sLaser and furthermore investigating the signal at 3.55 ppm in glioma-patients showing elevated signals in standard diagnostic spectroscopy.Material and Methods:
Results:
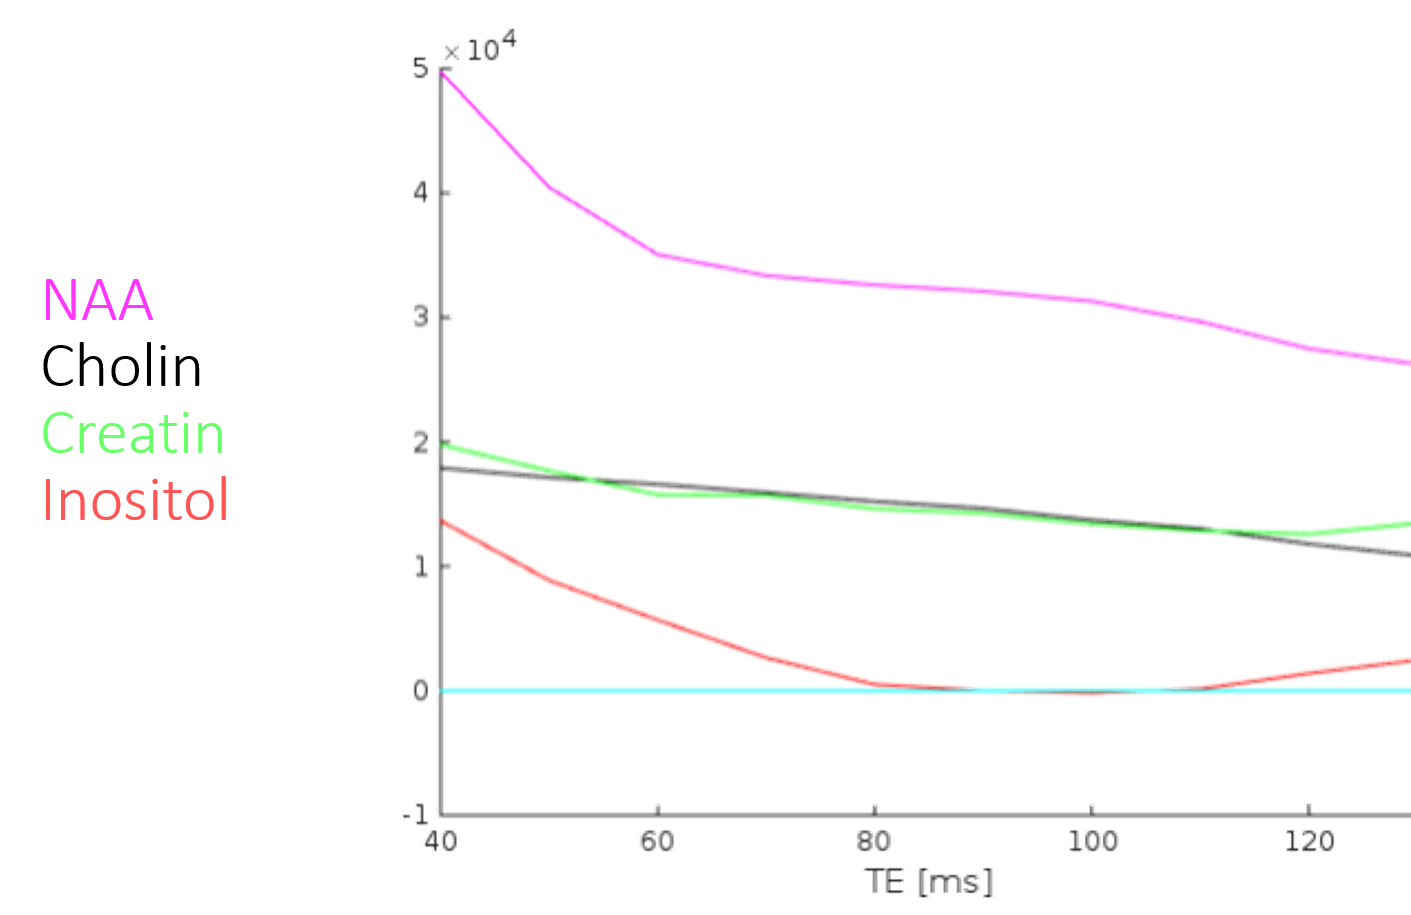
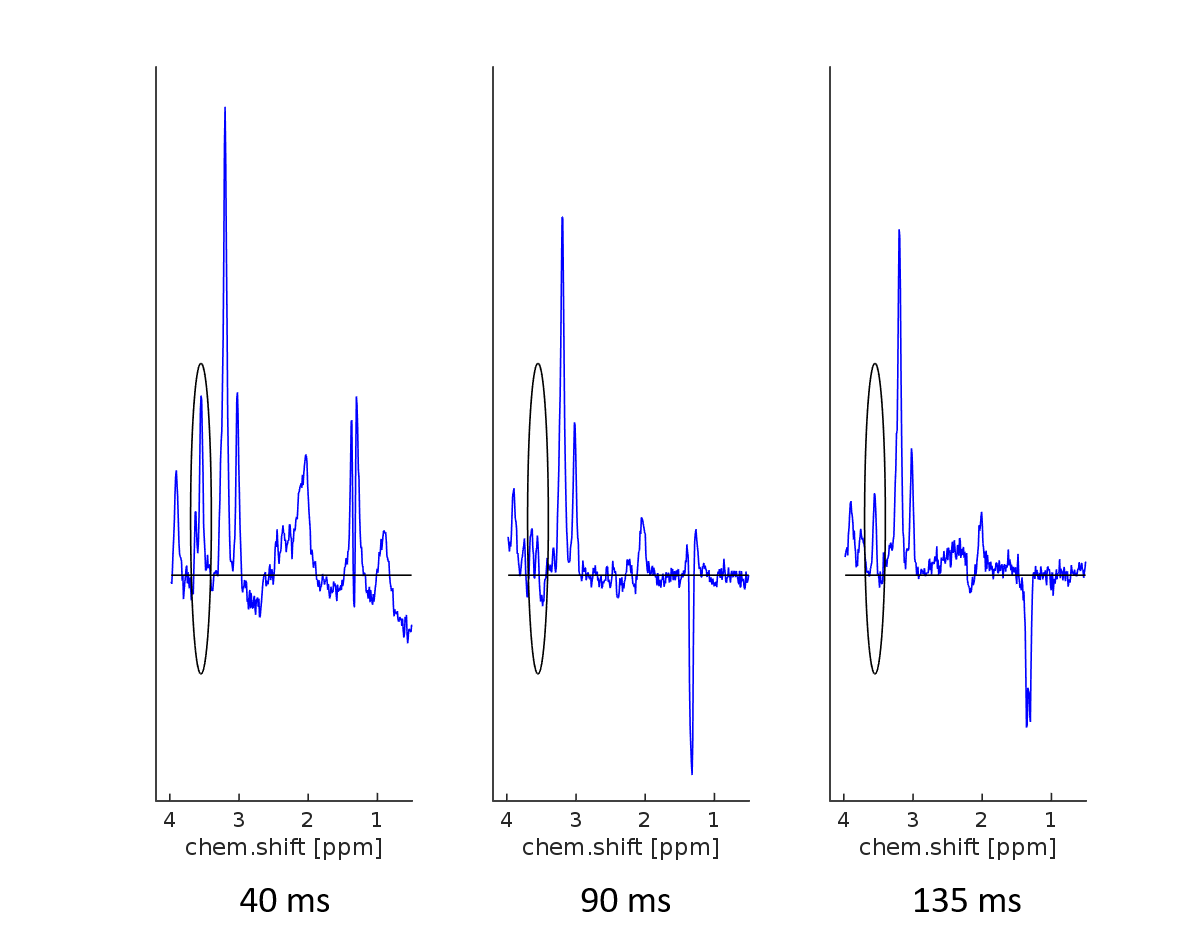
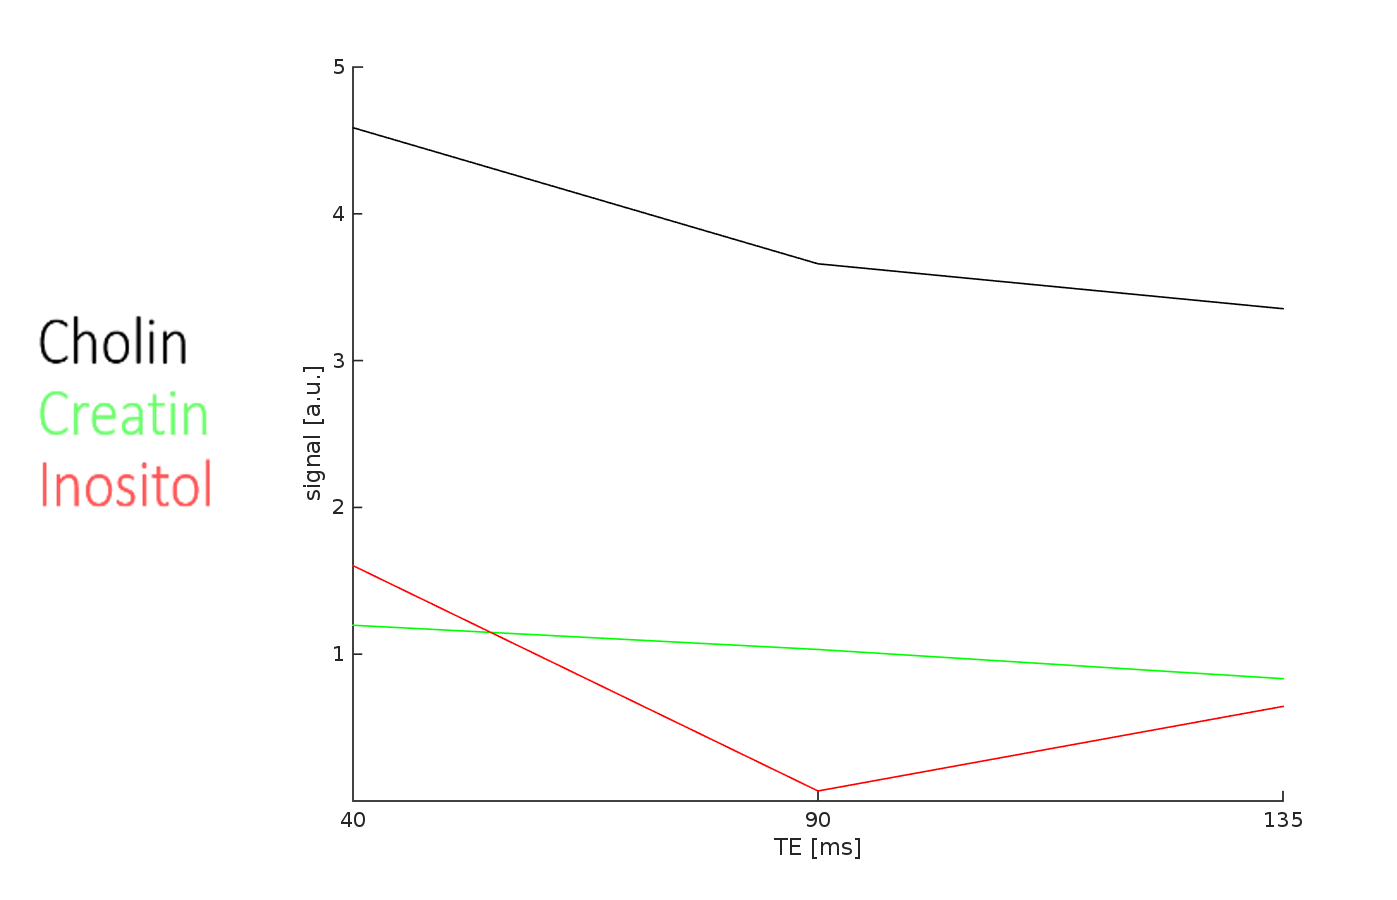
In the sLaser in healthy subjects, we saw a decrease of the signal at 3.55 ppm over TE. Between 90ms and 110 ms no signal was detected, followed by a renewed rise starting from 110 ms TE. Meanwhile the signal of other important metabolites as NAA, Cho and Cr showed approximately a continuous decrease. (Figure 1) Therefore TE_min was selected as 90 ms. In all three patients we saw a smaller signal at 3.55 ppm at TE_min than in the 135ms TE. The Signal of Cho and Cr showed again a decrease over time. (Figure 2, 3)Discussion
The loss of signal at 3.55 ppm described for SE could be found slightly shifted in sLaser, too. This effect could be therefore used to improve the detection of Glyc with sLaser. The reason for the different behaviour could be the more complex excitation pulses of sLaser. In our patients we found a smaller signal at 3.55 ppm at TE_minthan at 135 ms TE. The signal course is therefore similar to that of Ins that we have seen in healthy subjects. We conclude that in our patients the increase of the signal at 3.55 ppm at 135 ms TE is not due to an increased Glyc concentration. This contradicts the thesis that enhanced signal in 3.55 ppm in 135 ms TE is assigned as elevated Glyc concentration. One possible reason for the increased signal at 3.55 ppm at 135ms TE might be elevation of concentration of Ins. Both, an elevated concentration of total Ins or just the effect of a shift of Ins in the extracellular space due to low pH in the glioma microenvironment, represent potential explanations.[6]Conclusion:
In contrast to previous studies, our results indicate that the signal augmentation at 3.55 ppm at 135ms TE in glioma is caused by Ins. It would be therefore interesting to investigate more patients to confirm these results. In the future this could lead to a differentiation of subgroups, which will be then studied as predictor for tumor grade.Acknowledgements
IZKF scholarship of the medical faculty of TuebingenReferences
1. Gambarota, G., et al., In vivo 1H NMR measurement of glycine in rat brain at 9.4 T at short echo time. Magnetic Resonance in Medicine, 2008. 60(3): p. 727-731.
2. Tiwari, V., et al., Measurement of glycine in healthy and tumorous brain by triple‐refocusing MRS at 3 T in vivo. NMR in Biomedicine, 2017. 30(9): p. e3747.
3. Hattingen, E., et al., 1H MR spectroscopic imaging with short and long echo time to discriminate glycine in glial tumours. Magnetic Resonance Materials in Physics, Biology and Medicine, 2008. 22(1): p. 33.
4. Cerdan, S., et al., Nuclear magnetic resonance spectroscopic analysis of myo-inositol phosphates including inositol 1,3,4,5-tetrakisphosphate. J Biol Chem, 1986. 261(31): p. 14676-80.
5. Maudsley, A.A., et al., Mapping of Glycine Distributions in Gliomas. American Journal of Neuroradiology, 2014. 35(6 suppl): p. S31-S36.
6. Charlotte Stagg, D.L.R., Magnetic Resonance Spectroscopy - Tools for Neuroscience Research and Emerging Clinical Applications 2014: Academic Press Inc, pages 122-124.
Figures