2532
Whole-brain high resolution 3D MRSI for measuring 2HG and tumor metabolism in mutant IDH glioma patients1Department of Radiology, MGH, A.A. Martinos Center for Biomedical Imaging, Boston, MA, United States, 2Fetal Neonatal Neuroimaging and Developmental Science Center, Boston Children's Hospital, Boston, MA, United States, 3Department of Radiology, Harvard Medical School, Boston, MA, United States, 4Department of Radiology, A. A. Martinos Center for Biomedical Imaging, Boston, MA, United States, 5Department of Radiology, Medical University of Vienna, Vienna, Austria, 6Department of Neurosurgery, Massachusetts General Hospital, Boston, MA, United States, 7Department Neurology, Division of Neuro-Oncology, Massachusetts General Hospital, Boston, MA, United States
Synopsis
2-Hydroxyglutarate (2HG) detection using MRSI is a very promising, but challenging technique. Although high-resolution MRSI reduces the already small SNR of 2HG, it also reduces the spectral linewidth and provides more voxels for quantification. This study compares two high-resolution spiral MRSI sequences with a low-resolution MEGA-edited sequence, and one with a short echo time for 2HG detection in brain tumor patients. Three patients and three volunteers were measured with all four sequences. The two high-resolution sequences perform better with less false-positive 2HG detection in volunteers, and a more reliable 2HG quantification in IDH-mutated tumors.
Introduction
2-Hydroxyglutarate (2HG) is a biomarker for the IDH-mutation of brain tumors, and the IDH mutations correlate with the survival rate and response to therapy in glioma patients.1 2HG can be detected with MR spectroscopy2,3, but unfortunately it is challenging to measure reliably due to its low concentration, spectral overlap, and J-coupling.Although high-resolution MRSI has lower signal to noise ratios than low-resolution measurements, the linewidths are narrower, and more voxels can be quantified. These two effects might counterbalance the drawback of low SNRs, especially because the linewidth is critical for separating 2HG from overlapping signal of similar metabolites.Therefore we compared two long-TE high-resolution spiral-based sequences to a low resolution MEGA-edited sequence, and low-resolution short-TE sequence to find the optimal for 2HG detection.Methods
Three mutant IDH glioma patients and three volunteers were measured on a Siemens Trio Tim 3T scanner with a 32-channel head coil. All patients were confirmed IDH mutant glioma patients. Four different spiral MRSI sequences were measured: 1) "ASE97": EPI-based navigator for real-time frequency, shim, and motion correction4, asymmetric adiabatic lipid inversion frequency with 2 kHz inversion bandwidth and 48 Hz transition bandwidth, WET water suppression, adiabatic spin echo (ASE) localization, TI/TR/TE1/TE2 210/1800/32/65 ms, flip angle 79°, field of view 240×240×120 mm, volume of interest 240×240×100 mm³, voxel size 5.2×5.2×12 mm³, 3 averages, acquisition time 18:29; 2) "PRESS97": Same as ASE97, but with PRESS-localization; 3) "ASE14": Same as ASE97, but with an lipid inversion at (2.3±4)ppm, TE1/TE2 6/8 ms, voxel size 7.1×7.1×12 mm³, 8 averages, acquisition time 18:22 min; 4) "MEGA68": Same as ASE97, but with GAUSS MEGA-editing pulses played at (1.9±0.25)ppm and (7.5±0.25)ppm, TE1/TE2 8/60 ms, voxel size 10×10×10 mm³, 8 averages, acquisition time 22:12 min.Optimal sub-echo times of 32/65 ms were used for ASE97 and PRESS97 according to Choi et al.5 Due to the lower resolution, the whole spectral range was inverted in the ASE14 sequence, to reduce lipids more robustly. The echo time of 6/8 ms was used because 2HG signal was found to be strongest for shorter echo times in simulations. As a comparison to the high-resolution ASE97, the MEGA-editing sequence was chosen for comparison as another standard method to measure 2HG. To compare the PRESS and ASE localization schemes, the PRESS sequence was used. For all sequences, the pulses selected the same slab instead of a 3D rectangular volume of interest. All data were fitted with LCModel.Results
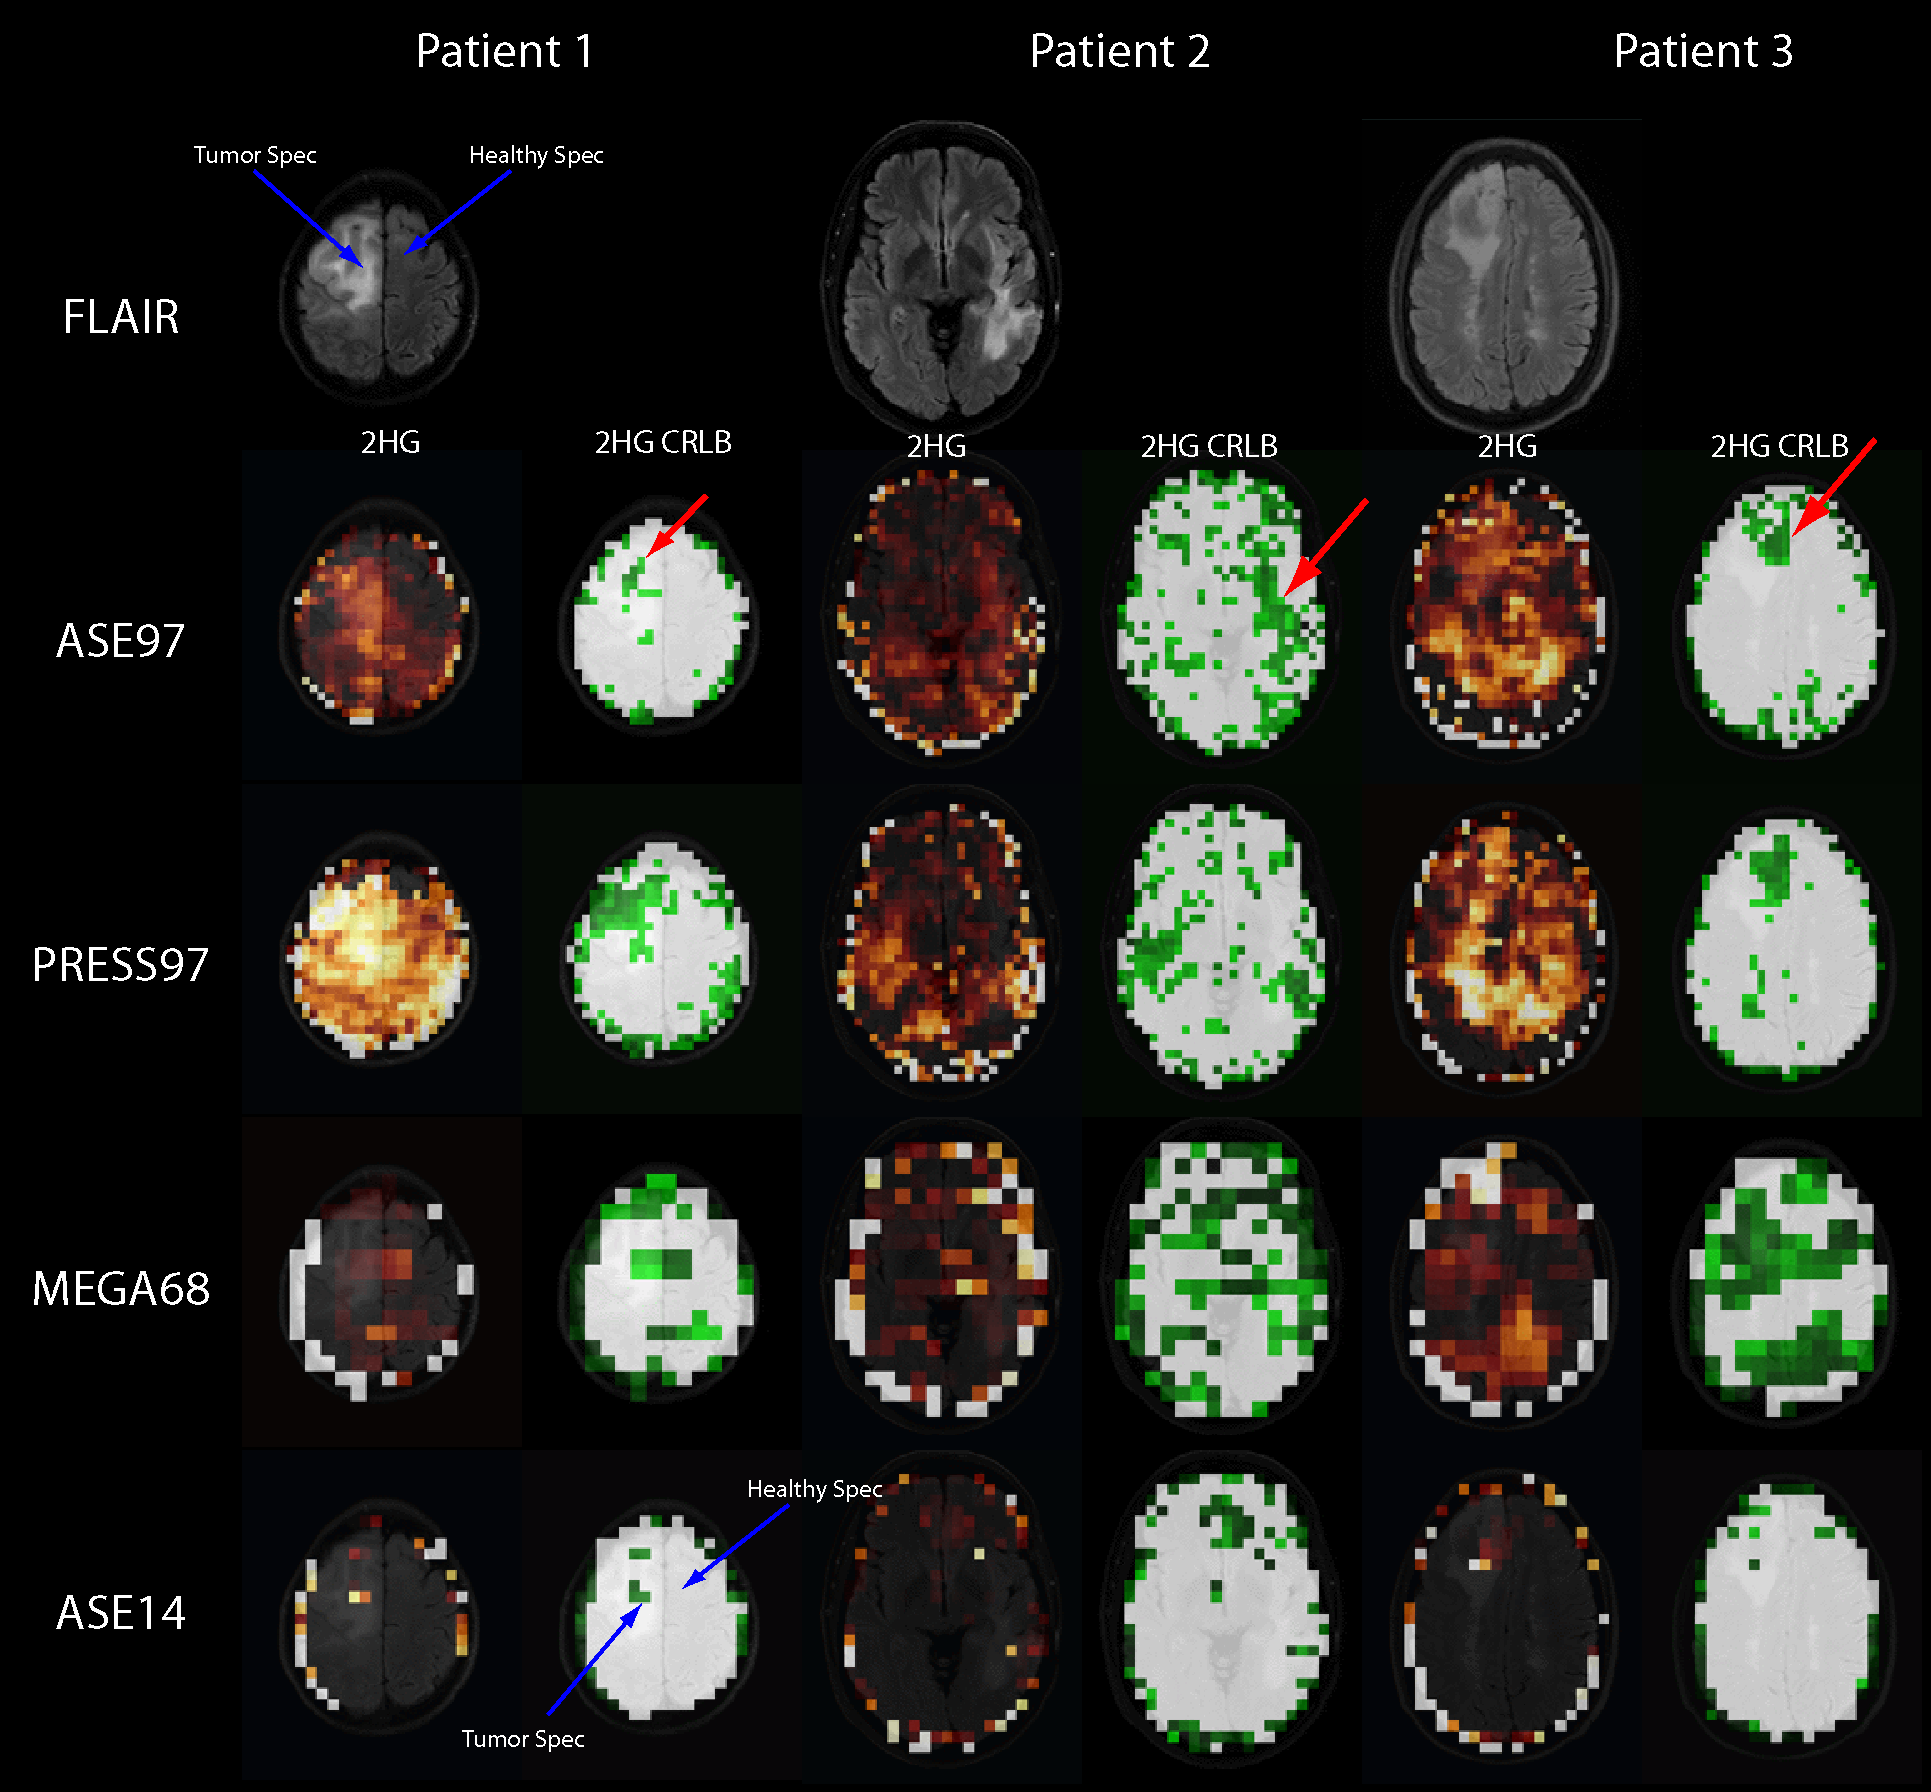
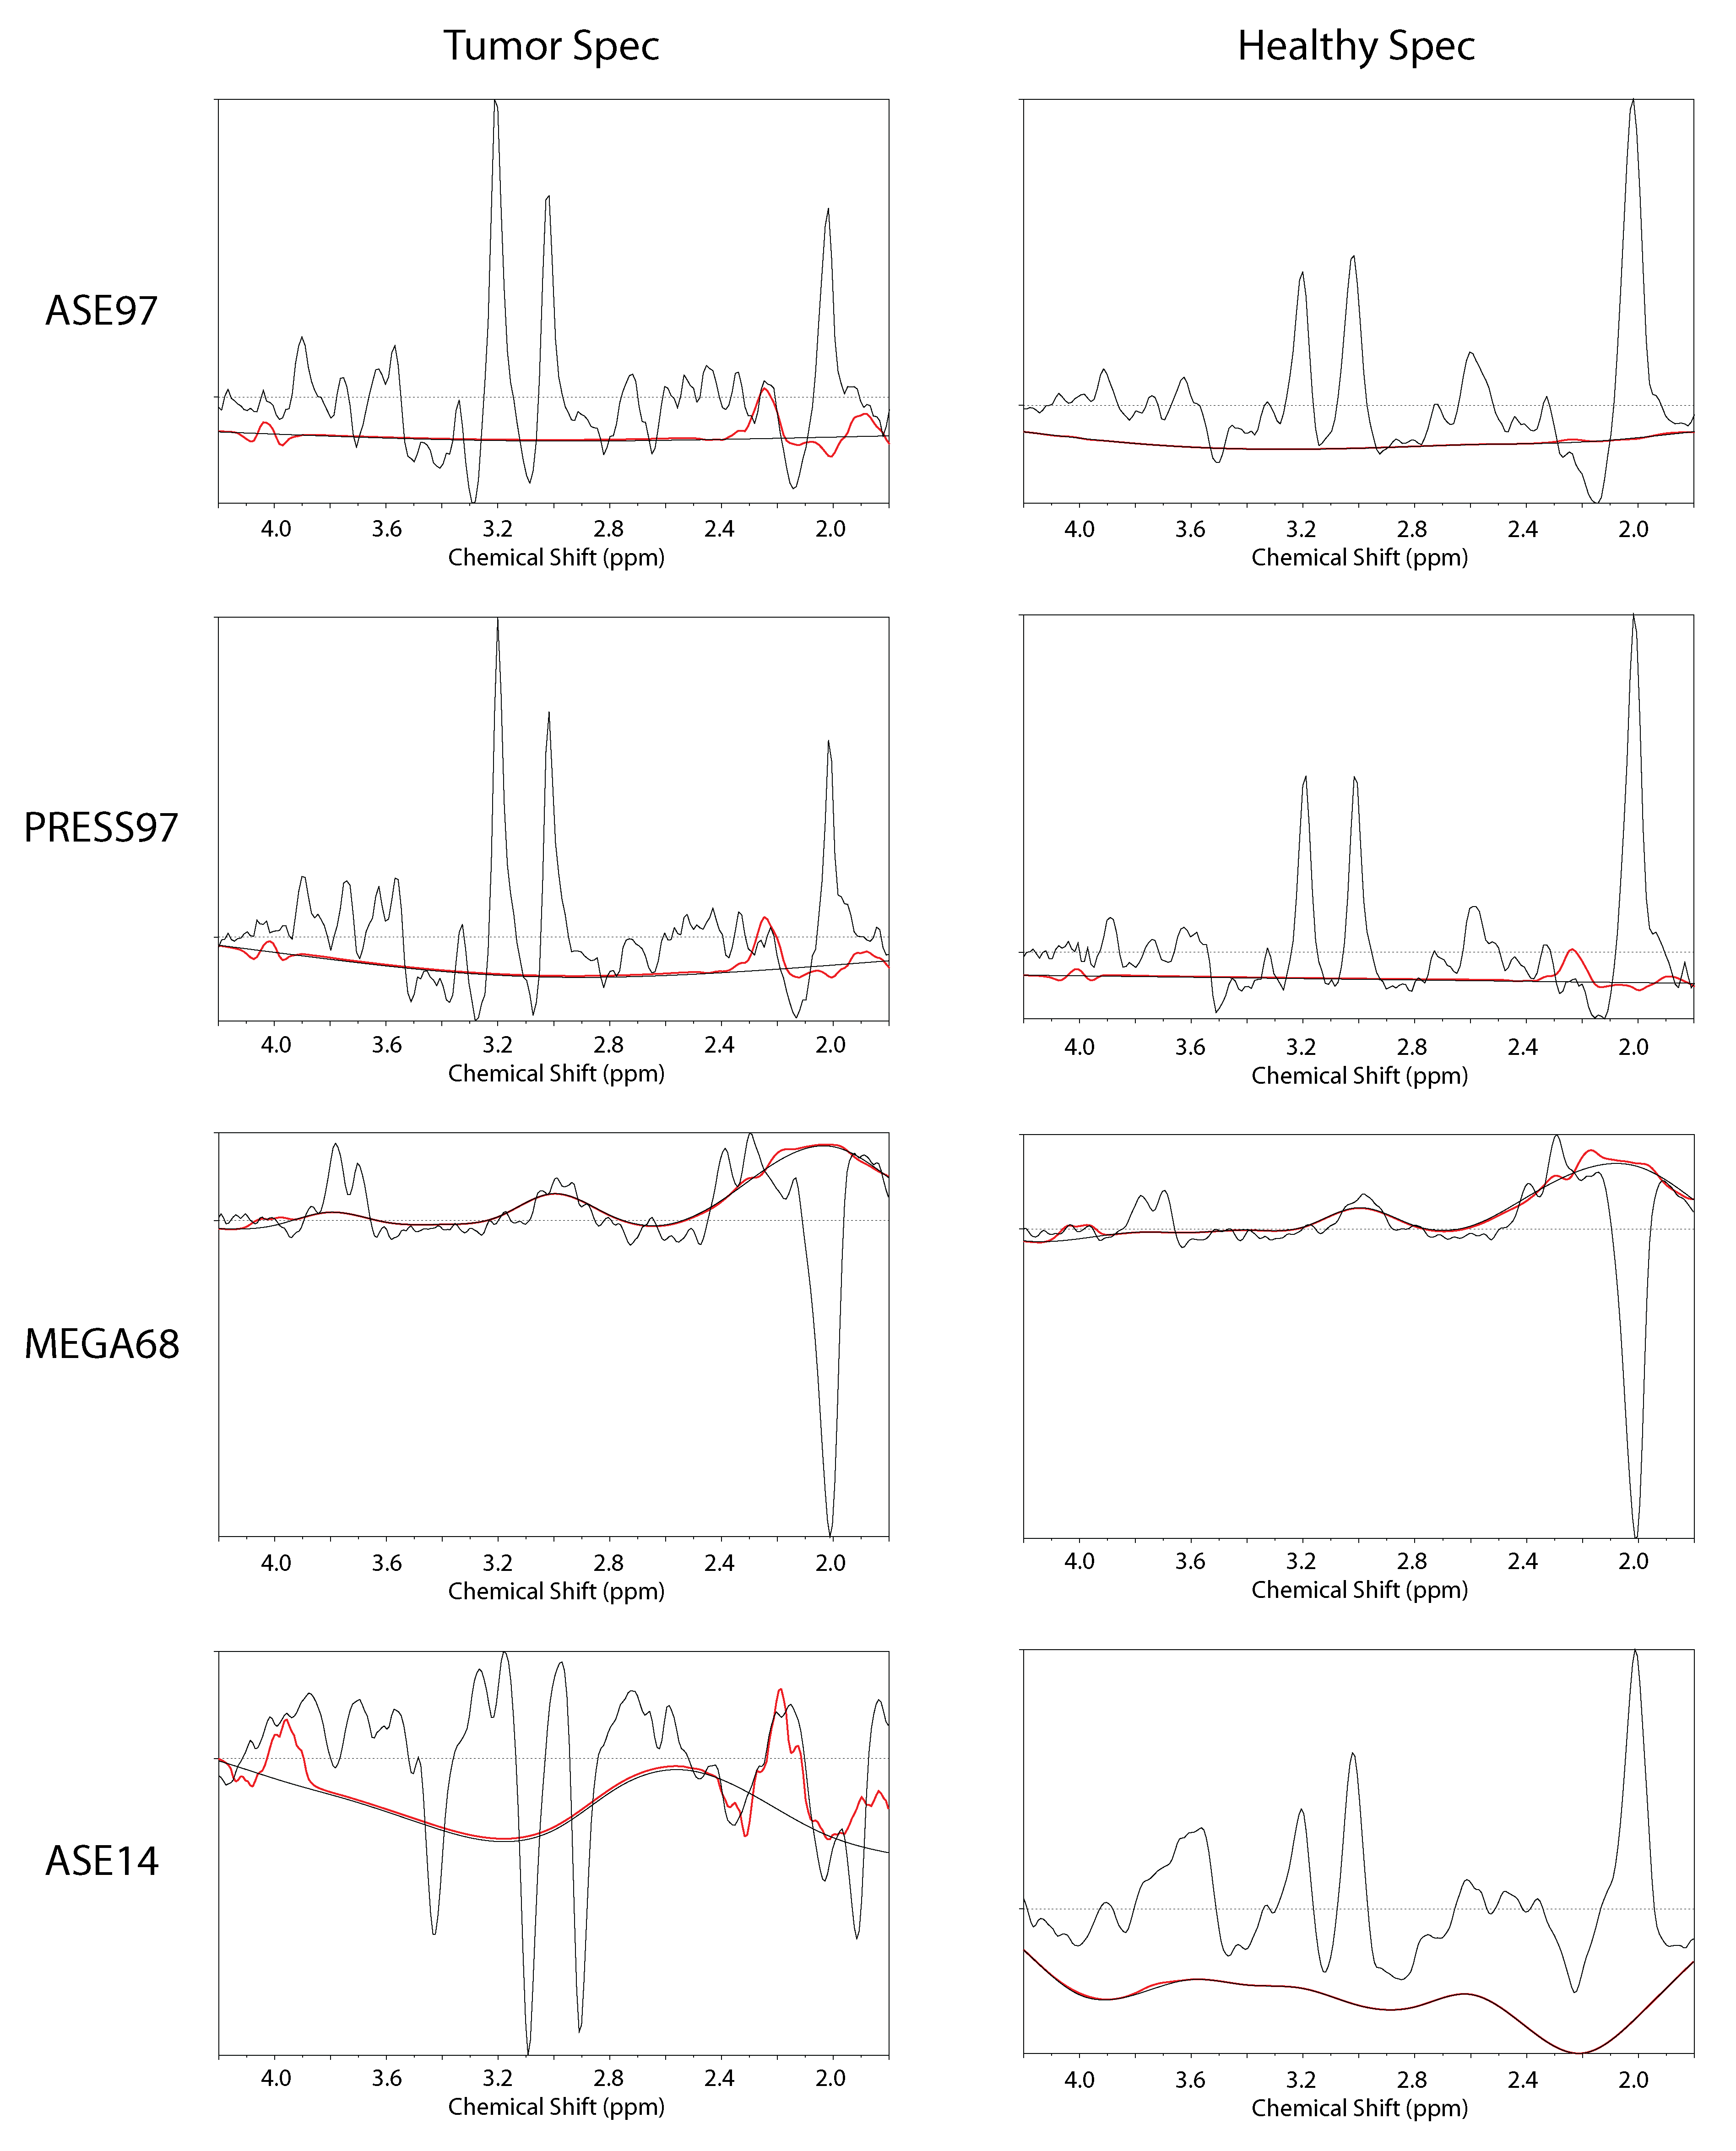
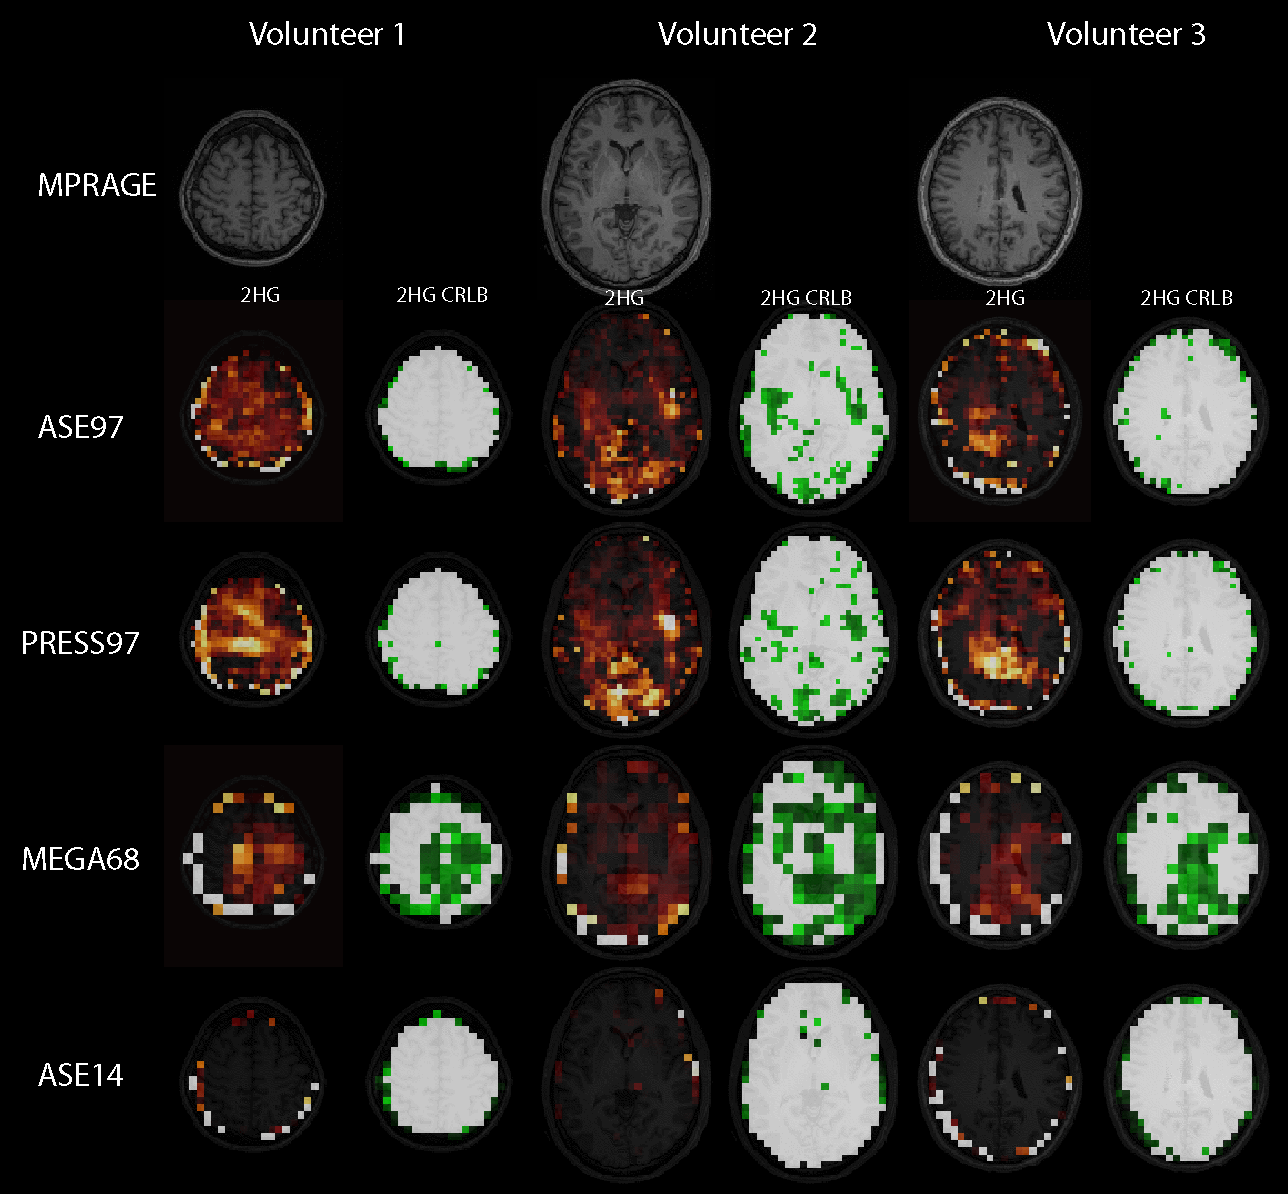
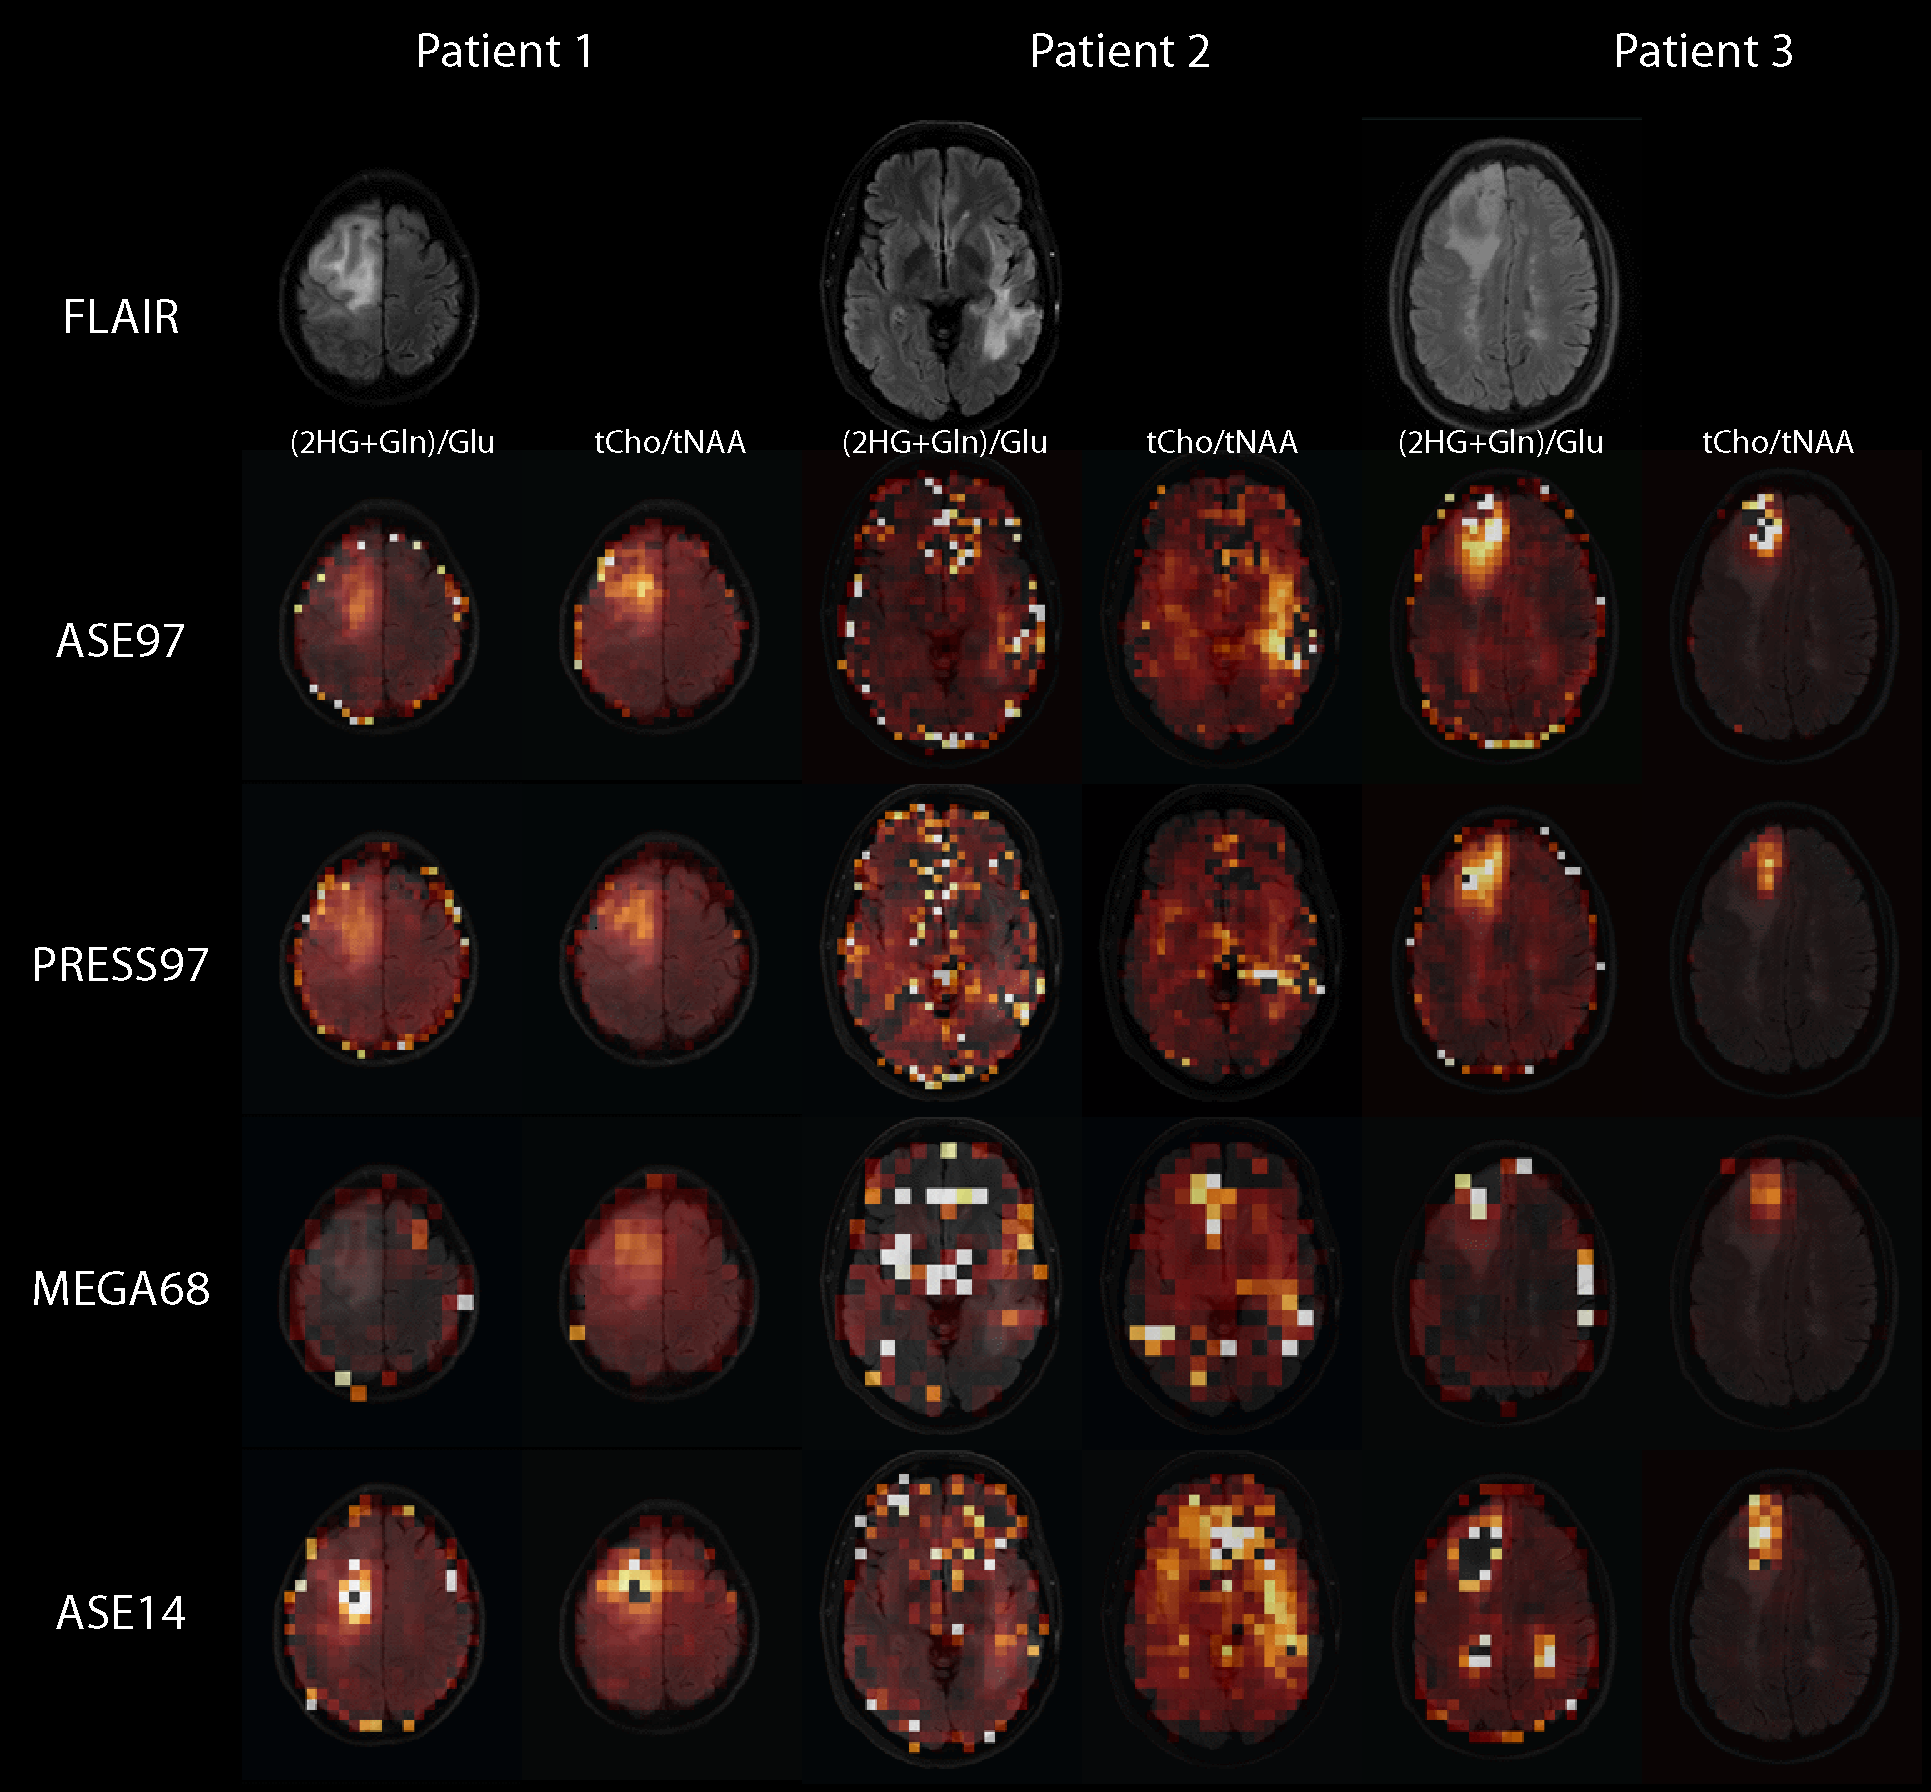
Fig. 1 shows the FLAIR (top row), 2HG maps and 2HG CRLB maps for all three patients and all four compared sequences, ASE97, PRESS97, MEGA68, and ASE14. The CRLB maps are scaled from 0 to 100 %, with white voxels representing CRLBs > 100%. Although the maps are noisy, the tumors can be seen clearly, especially in the CRLB maps of ASE97, indicated by red arrows. The ASE14 sequence seems to be very insensitive to 2HG, as very little 2HG is fitted in general. When further inspecting the voxels where 2HG was fitted, it is clear that artifacts are fitted as 2HG due to wrong preprocessing by LCModel. One such example is indicated by the blue arrows, and the corresponding spectra are shown in Fig. 2. Additionally, spectra of the other sequences, and spectra from healthy tissue are shown. 2HG is nicely detected in ASE97 for the tumor voxel, while it is hardly detectable in the healthy voxel.Fig. 3 shows the same as Fig. 2, but for volunteers. The CRLB maps show mostly CRLB values above 100%, except at lower slices (shown for volunteer 2), and in case of the MEGA68 sequence. The MEGA68 sequence has a higher false-positive detection of 2HG with more hotspots, which is also more pronounced on the PRESS97 data in comparison to ASE97. Fig. 4 shows the (2HG+Gln)/Glu, as well as the tCho/tNAA ratio maps. All sequences show a good contrast between tumor and healthy tissue in both ratio maps, except of MEGA68 for the (2HG+Gln)/Glu map.Discussion
In this work we compared four different sequences for detecting 2HG in brain tumor patients. The ASE97 sequence seems to have less false positive 2HG detection than the PRESS97 and the MEGA68 sequence, as shown in volunteers. The ASE14 sequence seems to be very insensitive to detecting 2HG in tumors. This suggests that high-resolution sequences might be better suited for 2HG-detection than low-resolution MEGA-edited sequences, or low-resolution sequences with shorter echo times. One explanation is that high resolutions decrease the spectral linewidths, and by having more voxels for quantification, the reliability of the whole data set is increased for 2HG detection.Acknowledgements
This work is supported by NIH (1R01CA211080-02) and Austrian Science Fund (J 4110).References
1. Balss J et al. Analysis of the IDH1 codon 132 mutation in brain tumors. Acta Neuropathol 2008;116:597-602.
2. Choi C et al. 2-hydroxyglutarate detection by magnetic resonance spectroscopy in IDH-mutated patients with gliomas. Nat Med 2012;18:624-629.
3. Andronesi OC et al. Detection of 2-hydroxyglutarate in IDH-mutated glioma patients by in vivo spectral-editing and 2D correlation magnetic resonance spectroscopy. Sci. Transl. Med. 2012; 4:116ra114.
4. Bogner W et al. 3D GABA imaging with real‐time motion correction, shim update and reacquisition of adiabatic spiral MRSI. Neuroimage 2014;103:290–302
5. Choi C et al. 2-hydroxyglutarate detection by magnetic resonance spectroscopy in IDH-mutated glioma patients. Nat Med. 2012;18(4):624-9
Figures