2530
Chemical deregulation in breast tissue of women at familial high risk of breast cancer correlates with the IBIS Breast Cancer Risk Evaluator Tool using 2D COSY at 3 Tesla1Queensland University of Technology/Translational Research Institute, Brisbane, Australia, 2Princess Alexandra Hospital/Translational Research Institute, Brisbane, Australia, 3Translational Research Institute, Brisbane, Australia, 4Translational Research Institute, Woolloongabba, Australia, 5Siemens, Brisbane, Australia, 6University of Newcastle, Newcastle, Australia, 7Princess Alexandra Hospital, Brisbane, Australia, 8Translational Research Institute/Princess Alexandra Hospital, Brisbane, Australia
Synopsis
Evaluation of breast tissue of women with a high familial risk of developing breast cancer using in vivo 2D COSY as part of a standard 3T breast MRI showed statistically significant alterations in the type of double bonds in fatty acyl chains compared with controls. Further, when separating the familial cohort using the IBIS risk evaluatior tool into a group above and below 20% lifetime risk, statistically significant differences in both cholesterol and metabolites were recorded.
Introduction
The medical management of women with the BRCA mutation is reasonably clear, however for women with unknown BRCA mutation status but who have a high familial risk of breast cancer, the pathways are less clear (1, 2). Evidence suggests that magnetic resonance spectroscopy (MRS) is a useful technique in the diagnosis and treatment monitoring of breast cancer (3-5). Previous work on biopsies and cell lines have established the existence of several premalignant states in various organs (6-8). In vivo two-dimensional Localized COrrelated SpectroscopY (2D L-COSY) has been used to detect alterations in breast chemistry in BRCA1 and BRCA2 mutation carriers and shown distinct alterations in breast chemistry compared to controls (5). However, comparing the 2D COSY technique with current screening tools such as the International Breast Cancer Intervention Study Risk Evaluation Tool (IBIS) is required in order to validate its use as a potential screening tool. This study investigates whether those women at high risk of developing familial breast cancer, but who have no established genetic mutations, exhibit alterations to breast chemistry as seen using the 2D COSY method and whether these chemical alterations correlate with IBIS scores.Materials and Methods
Data was collected between October 2017 and October 2018, with informed consent and Institutional Review Board approval. Sixty-six women at potentially high risk of developing breast cancer (according to the Australian Cancer Council’s Familial Risk Assessment-Breast and Ovarian Cancer (FRA-BOC) on-line tool (9)) were compared with twenty-five healthy controls. Age, body mass index and breast density was recorded. Lifetime risk of developing breast cancer was calculated using the IBIS Breast Cancer Risk Evaluator Tool. In vivo 2D L-COSY data were collected on a 3T Prisma or a 3T Skyra scanner (Siemens AG, Erlangen, Germany) using a Siemens 18-channel breast coil or a Rapid 16-channel breast coil (RAPID Biomedical, Germany). MR sequences included diffusion-weighted imaging, T2, non fat-suppressed T1, and fat-suppressed T1 3D flash series. High-risk participants underwent a dynamic contrast-enhanced MRI to exclude malignancy. Healthy controls did not receive contrast. A 20mm3 voxel was placed medially in the left breast to include a region representative of overall breast composition. The L-COSY sequence was applied using previously reported methods (3). The methylene peak at 1.3 ppm was used as an internal reference. Statistical significance (p<0.05) was calculated using the Mann-Whitney test.Results and Discussion
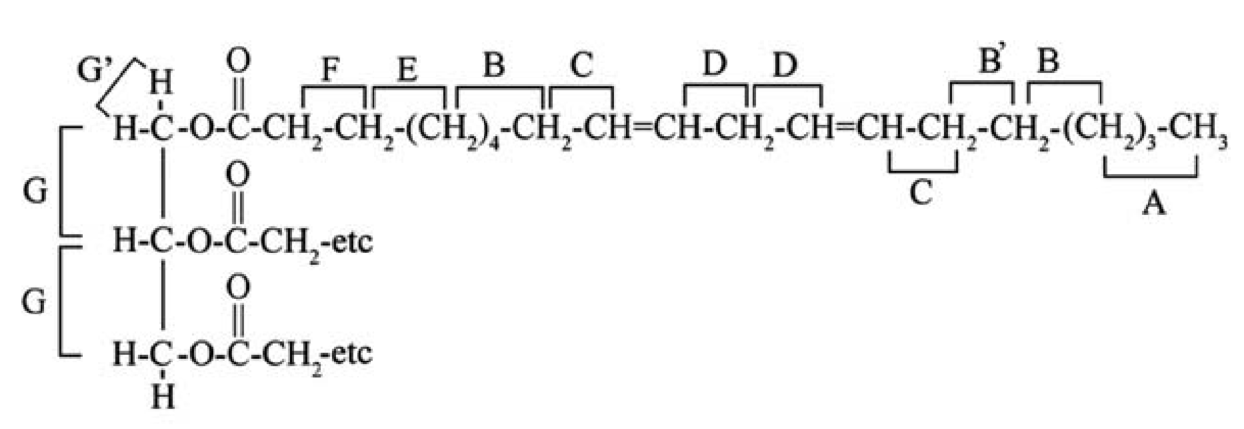
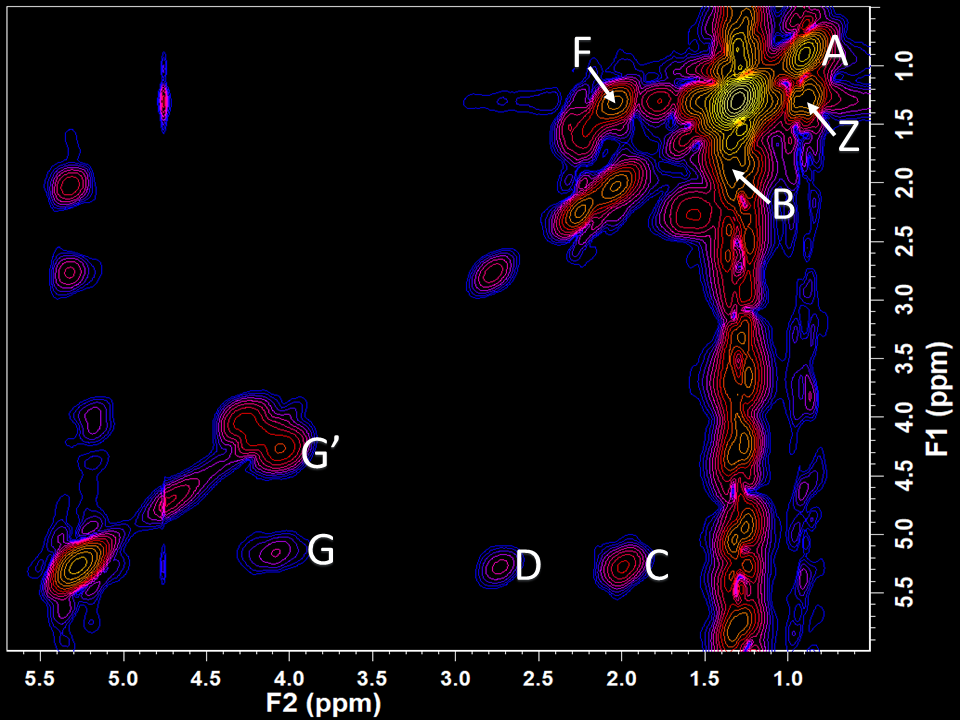
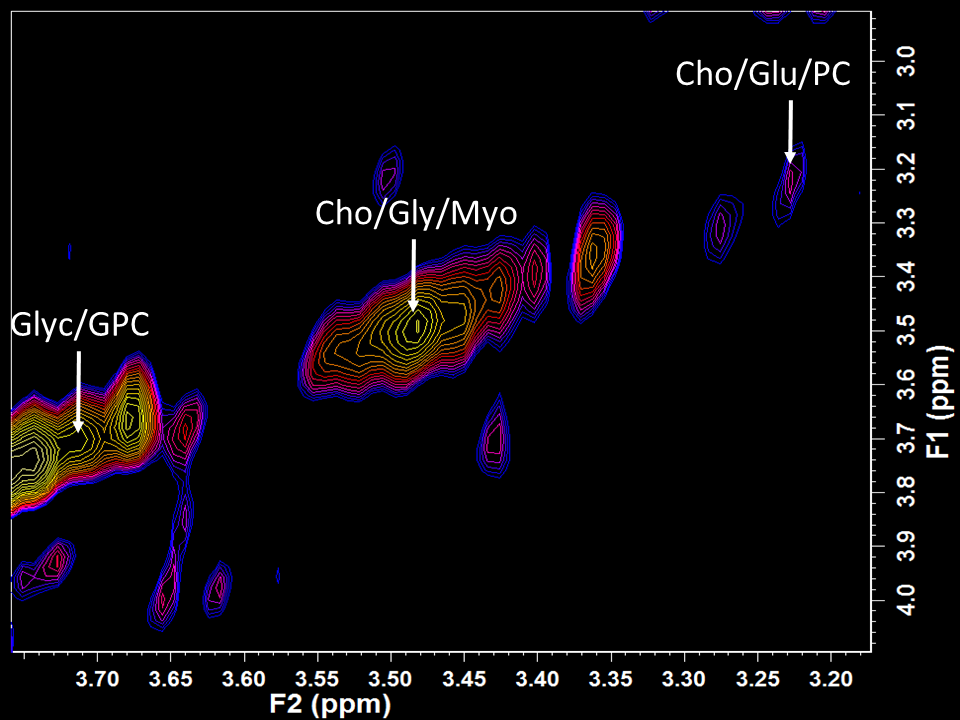
The mean age of participants was 46.09 (SD: 10.51) (range, 24-72) with a difference in the mean age between groups noted (controls: 38.32 (SD: 12.17); Familial risk scores (FRA-BOC) showed an increased risk: 49.03 (SD: 8.16)) (p<0.001), with no significant difference in the body mass index seen. Seventy-six per cent of all women (69/91) demonstrated a predominance of fatty breasts, with little difference between groups (p=0.600). In the high-risk cohort there were twenty-six women with an IBIS score ≤ to 20%, and fourty women with an IBIS score > 20%. A change in crosspeak D (-HC=CH-CH2-CH=CH-) at F2:2.77, F1:5.31ppm and crosspeak C (-CH2-CH=CH-) at F2:2.04, F1:5.31ppm (Figure 1) of 93% was recorded in this high risk group compared with healthy controls (p=0.026). No other statistically significant differences were found in terms of lipids or metabolites. When the ‘IBIS ≤ 20%’ group was compared to the ‘IBIS > 20%’ group, distinct differences were recorded (Table 1). The ‘IBIS > 20%’ group demonstrated a decrease in triglyceride crosspeak G (F2:4.25, F1:5.31 ppm) of 78% (p=0.008). The cholesterol peak increased by 278% (p=0.001). Choline, glycine and myoinositol increased by 198% (p<0.001). Glycerol and glycerophosphocholine (GPC) increased by 289% (p=0.004). Choline, glucose and phosphocholine increased by 414% (p<0.001); and creatine increased by 212% (p=0.001). As the methylene resonance at 1.3 ppm was used as the internal reference, these differences likely reflect changes in the lipid fatty acyl chain behaviour and composition concordant with an increase in the level of cholesterol, which is known to affect the molecular motion of fatty acyl chains of triglycerides and cholesterol esters (8).Conclusion
Evaluation of the breast tissue from women at familial high risk for breast cancer, using in vivo 2D COSY at 3 Tesla showed statistically significant alterations in the type of double bonds in the fatty acyl chains when compared with controls. Dividing the familial high risk cohort into groups above and below 20% IBIS risk score showed a statistically significant difference in cholesterol as well as a range of metabolites, including choline and glycerophosphocholine. As such, the chemical changes observed in the breast tissues of women appear to correlate with the IBIS risk evaluator regarding which women are considered at a lifetime risk above 20% of developing breast cancer. This is inkeeping with recommendations by the American Cancer society regarding which women require annual surveillance(10).Acknowledgements
Advance QueenslandReferences
1. Brennan M, Houssami N. Newly diagnosed early breast cancer An update on pre-operative assessment and staging. Australian Family Physician. 2012;41:871-4. 2. Lo LL, Milne RL, Liao Y, Cuzick J, Terry MB, Phillips K-A. Validation of the IBIS breast cancer risk evaluator for women with lobular carcinoma in-situ. British journal of cancer. 2018:1. 3. Bolan PJ, Nelson MT, Yee D, Garwood M. Imaging in breast cancer: magnetic resonance spectroscopy. Breast Cancer Research. 2005;7(4):149. 4. Bottomley PA, Griffiths JR. Handbook of Magnetic Resonance Spectroscopy In Vivo: MRS Theory, Practice and Applications. Newark: Wiley; 2016. 5. Ramadan S, Arm J, Silcock J, Santamaria G, Buck J, Roy M, et al. Lipid and Metabolite Deregulation in the Breast Tissue of Women Carrying BRCA1 and BRCA2 Genetic Mutations. Radiology. 2015;275(3):675-82. 6. Delbridge L, Lean CL, Russell P, May GL, Roman S, Dowd S, et al. Proton magnetic resonance and human thyroid neoplasia. II: Potential avoidance of surgery for benign follicular neoplasms. World journal of surgery. 1994;18(4):512-6; discussion 6-7. 7. Doran ST, Falk GL, Somorjai RL, Lean CL, Himmelreich U, Philips J, et al. Pathology of Barrett's esophagus by proton magnetic resonance spectroscopy and a statistical classification strategy. American journal of surgery. 2003;185(3):232-8. 8. Mackinnon WB, Huschtscha L, Dent K, Hancock R, Paraskeva C, Mountford CE. Correlation of cellular differentiation in human colorectal carcinoma and adenoma cell lines with metabolite profiles determined by 1H magnetic resonance spectroscopy. International journal of cancer. 1994;59(2):248-61. 9. Ramadan S, Mountford CE. Adiabatic localized correlation spectroscopy (AL-COSY): application in muscle and brain. Journal of magnetic resonance imaging : JMRI. 2011;33(6):1447-55. 10. Oeffinger KC, Fontham ET, Etzioni R, Herzig A, Michaelson JS, Shih Y-CT, et al. Breast cancer screening for women at average risk: 2015 guideline update from the American Cancer Society. Jama. 2015;314(15):1599-614.
Figures
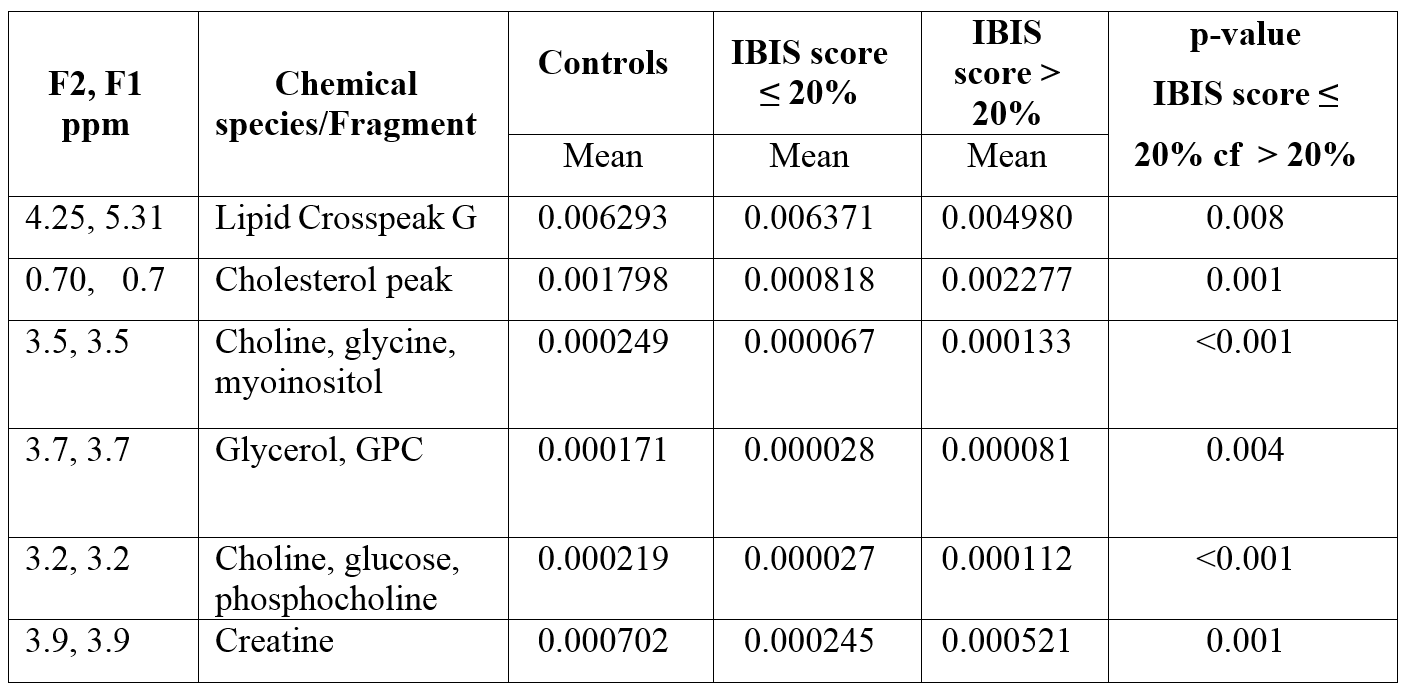
Table 1: Summary of in vivo 2D COSY differences between healthy controls, the ‘IBIS ≤ 20%’ subgroup and the ‘IBIS > 20%’ subgroup.