2529
1 H MRS Analysis of Pancreas Metabolites altered by Cachexia1Division of Cancer Imaging Research, The Russell H. Morgan Department of Radiology and Radiological Science, The Johns Hopkins University School of Medicine, Baltimore, MD, United States, 2Sidney Kimmel Comprehensive Cancer Center, The Johns Hopkins University School of Medicine, Baltimore, MD, United States, 3Department of Radiation Oncology and Molecular Radiation Sciences, The Johns Hopkins University School of Medicine, Baltimore, MD, United States
Synopsis
Cancer induced cachexia is a syndrome characterized by tissue wasting and weight loss. Cachexia occurs with the highest frequency and severity in pancreatic ductal adenocarcinoma (PDAC). To further understand this syndrome, we used 1H MRS to analyze pancreas metabolites in mice with and without cachexia-inducing PDAC xenografts. We detected significant weight loss in cachectic mice. 1H MR spectra identified significant differences in amino acids, BCAA, alanine, pyruvate, phosphocholine, niacinamide and NAD in cachectic mice that provide new insights into the morbidity and mortality associated with the syndrome that may lead to novel strategies to arrest this syndrome.
Introduction
Cachexia is a multifactorial syndrome characterized by skeletal muscle weight loss and reduced physical activity. The extreme weight loss due to cachexia results in a particularly poor quality of life causing profound weakness, listlessness, and inability to function (1, 2). Severe weight loss decreases the tolerance to treatments and anticancer therapies, and leads to the reduced survival of patients. In pancreatic cancer, the syndrome affects nearly 80% of patients (3). In most cases, cachexia is diagnosed when surgical removal is not possible. It has been reported that cancers can stimulate cachexia through the dysfunction of multiple organs i.e. liver, brain, spleen and pancreas (4). Metabolic abnormalities may interfere the regular functioning of these organs to increase the severity of the disease. Here we determined the metabolic changes in the pancreas with cachexia-inducing and non-cachexia inducing tumor growth using high-resolution quantitative 1H MRS of pancreas tissue obtained from normal, non-cachectic (Panc1) and cachectic (Pa04C) mice bearing pancreatic ductal adenocarcinoma (PDAC) xenografts.Methods
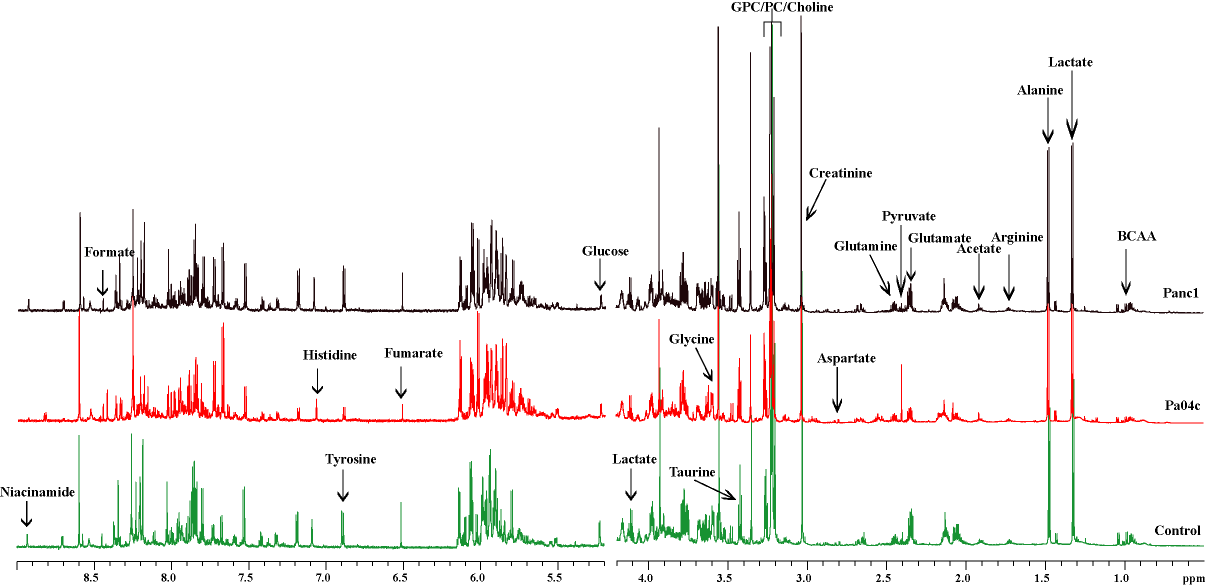
The Panc1 cell line was obtained from ATCC and the Pa04C cell line was provided by Dr. Maitra. Cancer cells (5 × 10⁶) were inoculated in the right flank of six to eight week old male severe combined immunodeficient mice. The pancreas was removed from mice once tumors were ~300 mm3 following euthanization, snap frozen and stored at -80°C prior to extraction. Snap frozen pancreas tissue samples were powdered for dual phase extraction. 1H MRS was performed on the water phase. Data were acquired on a Bruker Avance III 750 MHz (17.6T) NMR spectrometer equipped with a 5 mm broad band inverse (BBI) probe. All 1H MR spectra with water suppression were acquired using a single pulse sequence with the following experimental parameters: spectral width of 15495.86 Hz, data points of 64 K, 90° flip angle, relaxation delay 10 sec, acquisition time 2.11 sec, 64 scans with 8 dummy scans, receiver gain 256. All data processing analyses and quantification were performed with TOPSPIN 3.5 software. All statistical analysis were performed with Metaboanalyst software (5).Result and Discussion
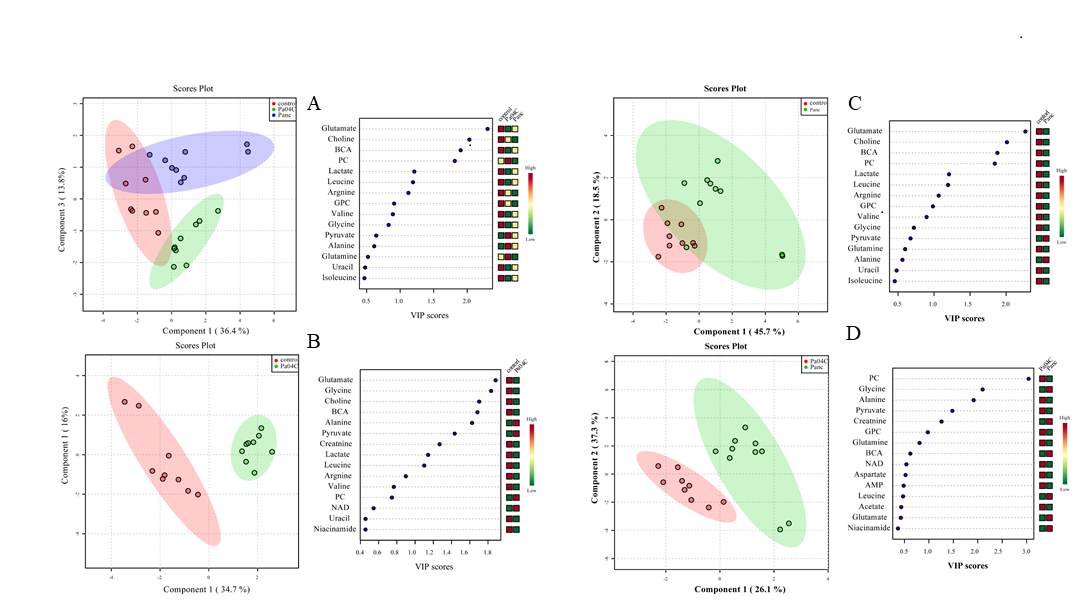
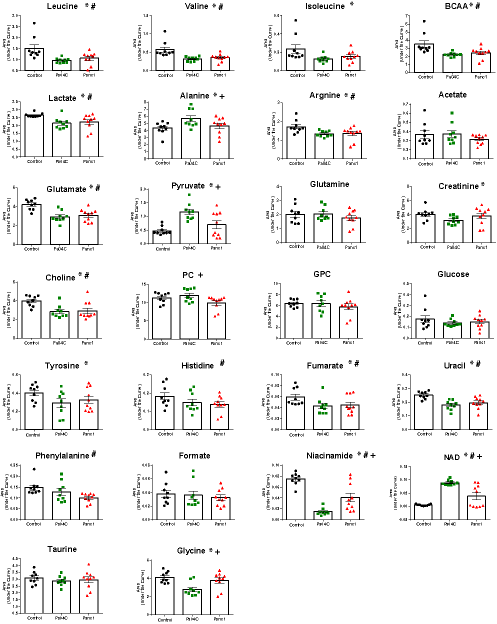
Representative 1H NMR spectra acquired from control, Pa04c and Panc1 groups are shown in Figure 1. PLS-DA Multivariate analyses were performed to analyze the differences in the metabolic profiles among the groups (Figure 2). Multivariate cluster analyses revealed differences in overall metabolic pattern in the pancreas from normal, cachectic and non-cachectic groups. A significant decrease of leucine, isoleucine, valine, BCAA, glutamate, choline, pyruvate, glycine, niacinamide, fumarate and increase of alanine, pyruvate, and NAD was detected in cachectic mouse pancreas compared to control pancreas. A significant increase in alanine, phenylalanine, pyruvate, phosphocholine and decrease in glycine, NAD, niacinamide was observed in cachectic mouse pancreas compared to non-cachectic mouse pancreas (Figure 3). Pathway impact analysis using MetaboAnalyst web software indicates alterations in branch chain amino acid pathways and glutamate, glutamine metabolism. These results provide new insights into changes in pancreas metabolism with cachexia, and support investigating metabolic targets and biomarkers to reduce cachexia-associated morbidity.
Acknowledgements
Supported by NIH R01CA193365 and R35CA209960.References
1. Fearon, K.; Strasser, F.; Anker, S. D.; Bosaeus, I.; Bruera, E.; Fainsinger, R. L.; Jatoi, A.; Loprinzi, C.; MacDonald, N.; Mantovani, G.; Davis, M.; Muscaritoli, M.; Ottery, F.; Radbruch, L.; Ravasco, P.; Walsh, D.; Wilcock, A.; Kaasa, S.; Baracos, V. E., Definition and classification of cancer cachexia: an international consensus. Lancet Oncol 2011, 12, (5), 489-95. 2. Penet, M. F.; Bhujwalla, Z. M., Cancer cachexia, recent advances, and future directions. Cancer J 2015, 21, (2), 117-22. 3. Winnard, P. T., Jr.; Bharti, S. K.; Penet, M. F.; Marik, R.; Mironchik, Y.; Wildes, F.; Maitra, A.; Bhujwalla, Z. M., Detection of Pancreatic Cancer-Induced Cachexia Using a Fluorescent Myoblast Reporter System and Analysis of Metabolite Abundance. Cancer Res 2016, 76, (6), 1441-50. 4. Argiles, J. M.; Busquets, S.; Stemmler, B.; Lopez-Soriano, F. J., Cancer cachexia: understanding the molecular basis. Nat Rev Cancer 2014, 14, (11), 754-62. 5. Xia, J.; Wishart, D. S., Web-based inference of biological patterns, functions and pathways from metabolomic data using MetaboAnalyst. Nat Protoc 2011, 6, (6), 743-60.Figures