2528
J-edited Cerebral MR Spectroscopy in Patients with Hepatic EncephalopathyHelge Jörn Zöllner1,2, Georg Oeltzschner3,4, Markus Butz1, Markus S. Jördens5, Nur-Deniz Füllenbach5, Dieter Häussinger5, Hans-Jörg Wittsack2, and Alfons Schnitzler1
1Institute of Clinical Neuroscience and Medical Psychology, Medical Faculty, Heinrich Heine University Düsseldorf, Düsseldorf, Germany, 2Department of Diagnostic and Interventional Radiology, Medical Faculty, Heinrich Heine University Düsseldorf, Düsseldorf, Germany, 3Russell H. Morgan Department of Radiology and Radiological Science, The Johns Hopkins University School of Medicine, Baltimore, MD, United States, 4F.M. Kirby Research Center for Functional Brain Imaging, Kennedy Krieger Institute, Baltimore, MD, United States, 5Department of Gastroenterology, Hepatology and Infectiology, Medical Faculty, Heinrich Heine University Düsseldorf, Düsseldorf, Germany
Synopsis
Hepatic encephalopathy (HE) associated with elevated brain ammonia levels. The detoxification of ammonia leads to regionally selective alterations in several brain metabolites. The present study investigates these neurotransmitter changes in HE patients in the GABAergic and glutamatergic system. Using MEGA-PRESS, MR spectroscopy was performed in cerebellum, thalamus, and motor cortex. Preliminary results unravel increased GABA levels accompanied by elevated glutamine and reduced myo-Inositol in the cerebellum, but an absence of GABA level changes in the two other regions. These initial findings may lead to further explanation of cognitive and motor deficits in HE, but need to be substantiated further.
Introduction
Hepatic encephalopathy (HE) is associated with elevated ammonia leveles in the brain and the detoxification of ammonia leads to regionally selective alterations in several brain metabolites1. The present study investigates these neurotransmitter changes in HE patients in the GABAergic and glutamatergic system2,3, as well as myo-Inositol4,5, glutathione6,7, and aspartate8. The involvement of the motor system, thalamus, and cerebellum has been demonstrated in human9 and rodent studies10 and is linked to cognitive impairment and motor deficits. The present study investigates alterations in metabolite concentrations within the human brain of HE patients, focusing on the cerebral neurotransmitter GABA and glutamate, but also other HE related metabolites. Brain metabolite levels in the cerebellum (CEREB), thalamus (THA), and motor cortex (M1) (Figure 1) were assessed with j-edited proton magnetic resonance spectroscopy (MRS) to explore changes in brain metabolism of HE patients.Methods
5 clinically well-characterized HE patients and 7 healthy age-matched controls were investigated with J-edited MEGA-PRESS11 MRS (TE/TR = 68/1750 ms, NEX = 256, ‘ON’ pulse = 1.9 ppm, ‘OFF’ pulse = 7.5 ppm, CEREB: (25 mm)3, THA: (35 (LR) x 30 (AP) x 25 (HF)) mm3, M1: (30 mm)3) in this ongoing study. Voxel localization was based on an T1-weighted anatomical scan. Critical flicker frequency (CFF) was recorded via a CFF goggle (NevoLAB GmbH, Maierhöfen, Germany) in both groups, as it accounts for the continuous nature of HE12. The CFF is defined as the frequency at which the participant can distinguish a flickering light source from a continuous one. The MR acquisition was performed on a clinical 3T MRI (Siemens MAGNETOM Prisma, Siemens Healthcare AG, Erlangen, Germany). GABA-to-creatine ratios were assessed with Gannet 3.013, whereas OFF spectra were processed with FID-A14 and evaluated using LCModel v6.315. Normal distributed data were tested with t-test, otherwise the Mann-Whitney-U-test was used (both significance levels α = 0.05). Tow-sided partial correlations with CFF and age as covariates were calculated, again significance levels α = 0.05.Results
A sifnificant increase in GABA levels was detected in the cerebellum (p < .05), whereas no GABA level changes were observed in the THA and M1. An elevation of glutamine and a reduction in myo-Inositol was visible in all regions of interest (all p < .01). In addition, aspartate levels were increased within CEREB and M1 (both p < .05), as well as increased glutathione levels in THA and M1 (both p < .05) (see Figure 1 & Figure 2). CFF values (controls: 43.3 ± 2.2 Hz; HE: 36 ± 1.7 Hz) were different (p < .05) between both groups. Negative correlations between CFF and metabolite levels were found for glutamine (Gln) in CEREB, Aspartate (Asp) in CEREB and M1, and for Glutathione (GSH) in M1. Positive correlations between CFF and myo-Inositol (mI) were found in all regions (see Figure 3 & Figure 4).Discussion
Preliminary results point at a cerebellar involvement in HE and are in line with the hyperammonemia rat model10. The increased GABAergic tone, which was accompanied by elevated Gln and reduced mI, could be linked to detoxification of ammonia. Another striking result is the link between Asp and HE within CEREB and M1. A high-affinity uptake of aspartate was described in rats with HE8, but was to our knowledge not yet reported in human in vivo studies. Elevated GSH levels within THA and M1 might be attributed to a oxidative stress response7. Further, patients – especially patients with minimal HE – should be included to substantiate these findings.Conclusion
GABA j-edited MRS in cerebellum, thalamus, and motor cortex unraveled increased GABAergic tone within the cerebellum. Elevated Gln and mI depletion, which are typical for HE, were found in all regions and were closely linked to CFF. In addition, increasing Asp level were found in cerebellum and motor cortex. These findings underline the regionally specific and continuous nature of HE.Acknowledgements
The authors would like to thank Erika Rädisch for the assistent during the MR measurements. Georg Oeltzschner received salary support from NIH R01EB016089, R01EB023963, R01MH106564, and R21AG060245. This study was supported by the Sonderforschungsbereich (SFB) 974 (TP B07) of the Deutsche Forschungsgemeinschaft (DFG).References
- Häussinger, D. & Schliess, F. Pathogenetic mechanisms of hepatic encephalopathy. Gut 57, 1156–1165 (2008).
- Sergeeva, O. A. GABAergic transmission in hepatic encephalopathy. Arch. Biochem. Biophys. 536, 122–130 (2013).
- Oeltzschner, G. et al. Low visual cortex GABA levels in hepatic encephalopathy: links to blood ammonia, critical flicker frequency, and brain osmolytes. Metab. Brain Dis. 30, 1429–1438 (2015).
- Häussinger, D. et al. Proton magnetic resonance spectroscopy studies on human brain Myo-inositol in hypo-osmolarity and hepatic encephalopathy. Gastroenterology 107, 1475–1480 (1994).
- Oeltzschner, G. et al. Effects of eddy currents on selective spectral editing experiments at 3T. J. Magn. Reson. Imaging 47, 673–681 (2018).
- Oeltzschner, G., Butz, M., Wickrath, F., Wittsack, H.-J. & Schnitzler, A. Covert hepatic encephalopathy: elevated total glutathione and absence of brain water content changes. Metab. Brain Dis. 31, 517–527 (2016).
- Hilgier, W. et al. Direct Exposure to Ammonia and Hyperammonemia Increase the Extracellular Accumulation and Degradation of Astroglia-Derived Glutathione in the Rat Prefrontal Cortex. Toxicol. Sci. 117, 163–168 (2010).
- Schmidt, W., Wolf, G., Grüngreiff, K., Meier, M. & Reum, T. Hepatic encephalopathy influences high-affinity uptake of transmitter glutamate and aspartate into the hippocampal formation. Metab. Brain Dis. 5, 19–31 (1990).
- Timmermann, L. et al. Impaired cerebral oscillatory processing in hepatic encephalopathy. Clin. Neurophysiol. 119, 265–272 (2008).
- Cauli, O., Mansouri, M. T., Agustí, A. & Felipo, V. Hyperammonemia Increases GABAergic Tone in the Cerebellum but Decreases It in the Rat Cortex. Gastroenterology 136, 1359–1367.e2 (2009).
- Mescher, M., Merkle, H., Kirsch, J., Garwood, M. & Gruetter, R. Simultaneous in vivo spectral editing and water suppression. NMR Biomed. 11, 266–272 (1998).
- Kircheis, G., Hilger, N. & Häussinger, D. Value of Critical Flicker Frequency and psychometric hepatic encephalopathy score in diagnosis of low-grade hepatic encephalopathy. Gastroenterology 146, 961–969.e11 (2014).
- Edden, R. A. E., Puts, N. A. J., Harris, A. D., Barker, P. B. & Evans, C. J. Gannet: A batch-processing tool for the quantitative analysis of gamma-aminobutyric acid-edited MR spectroscopy spectra. J. Magn. Reson. Imaging 40, 1445–1452 (2014).
- Simpson, R., Devenyi, G. A., Jezzard, P., Hennessy, T. J. & Near, J. Advanced processing and simulation of MRS data using the FID appliance (FID-A)—An open source, MATLAB-based toolkit. Magn. Reson. Med. 77, 23–33 (2017).
- Provencher, S. W. Estimation of metabolite concentrations from localized in vivo proton NMR spectra. Magn. Reson. Med. 30, 672–679 (1993).
Figures
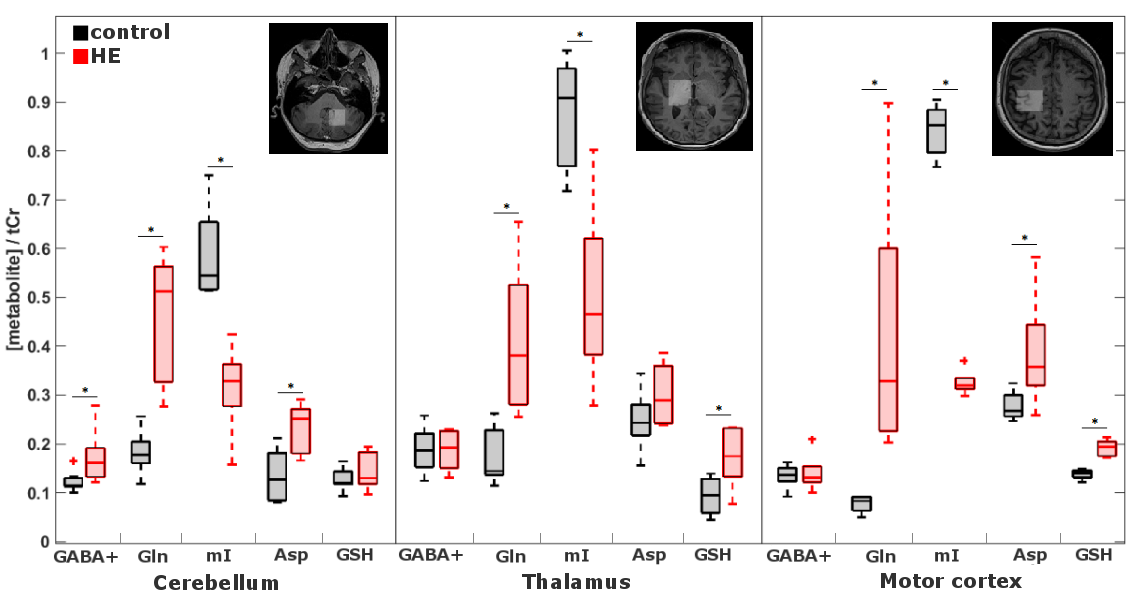
Metabolite-to-creatine (see x-axis) ratios in
cerebellum, thalamus, and motor cortex of controls (black) and HE patients (red). Asteriks mark
significant differences (p<.05). Voxel sizes: cerebellum (25 mm)3, thalamus (35 (LR) x 20 (AP) x 25 (HF)) mm3, motor cortex (30 mm)3
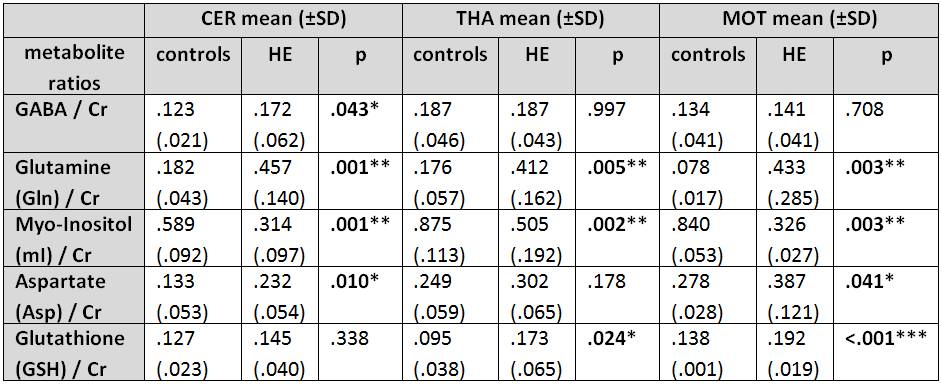
Metabolite-to-creatine ratios of controls and HE
patients. Significant differences are marked in bold (*= (p < .05); **= (p
< .01); ***= (p < .001)).
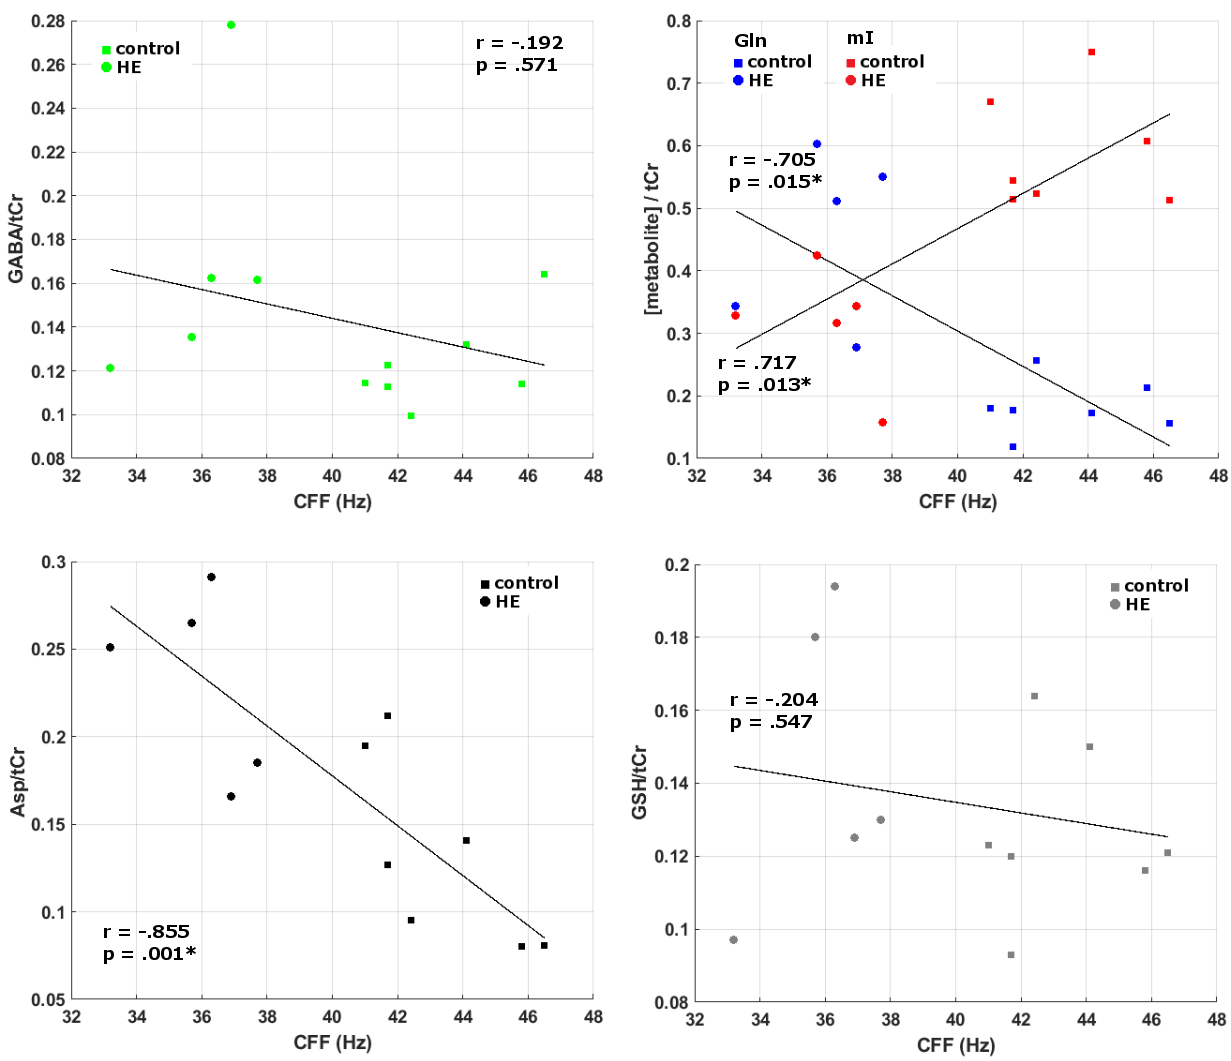
Correlation between critical clicker frequency
(CFF) and metabolite-to-creatine ratios. Asteriks mark significant correlations
*= (p < .05).
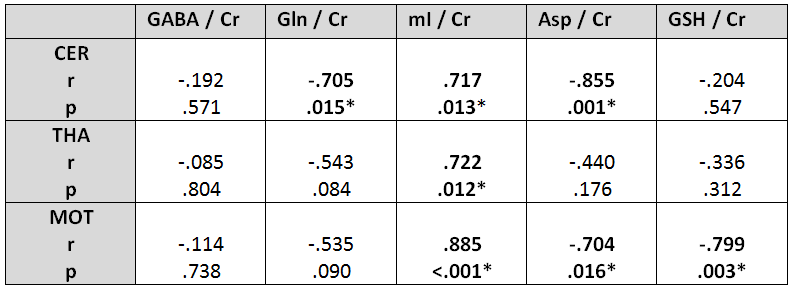
Two-sided partial correlation between CFF and
metabolite-to-creatine ratios.
Significant correlations are marked in bold (*= (p < .05)).