2527
Association of hepatic histologic features with magnetic resonance spectroscopy derived hepatic fat and water T1 and T2 estimates in adults with nonalcoholic fatty liver disease1Radiology, University of California, San Diego, San Diego, CA, United States
Synopsis
The purpose of this study is to assess possible associations between hepatic histologic features of NAFLD and the T1 and T2 of water and fat, measured by a multi TR, multi TE 1H MRS STEAM sequence that acquires 32 spectra for a range of TRs and TEs in a single breath-hold. In evaluation of 51 adults Water T1 showed a positive association with fibrosis. Water T1 and T2 and Fat T1 and T2 all showed associations with steatosis grade; no other statistically significant associations were observed. This may contribute to noninvasive methods of detection and monitoring of NALFD.
Introduction
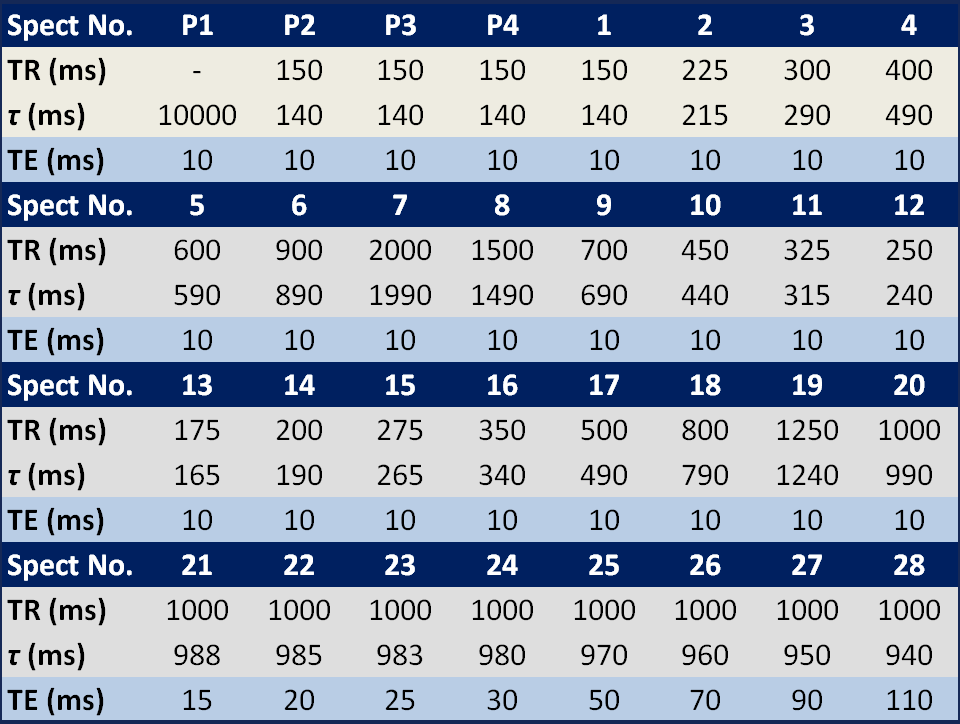
Nonalcoholic fatty liver disease (NAFLD) has two components that are visible to Magnetic Resonance; water and fat both of which have independent T1 and T2 values. One method of measuring the T1 and T2 of both water and fat is a novel multi-repetition time (TR)-echo time (TE) 1H magnetic resonance spectroscopy (MRS)-stimulated echo acquisition mode (STEAM) sequence that acquires 32 spectra for a range of TRs and TEs in a single breath-hold (Figure 1) and has been shown to be repeatable and reproducible (1). The purpose of this study is to assess possible associations between hepatic histologic features of NAFLD and magnetic resonance spectroscopic (MRS)-derived T1 and T2 fat and water estimates in adults.Methods
The study was IRB approved and HIPAA compliant, and all subjects provided written informed consent. Enrolled subjects receiving standard-of-care liver biopsy for evaluation of NAFLD were consented for 3T liver MR examinations. Their biopsies were scored based on NASH CRN criteria (5). A custom MRS sequence that acquired 32 spectra across a range of TR and TE in a 21 s breath hold was used to estimate the T1 and T2 of liver fat and water (Figures 1 and 2). Signals from different array elements were combined using an SVD technique (2) and a single experienced observer analyzed the spectra offline using the AMARES algorithm (3) included in jMRUI software package (4). Fat and water T1 and T2 were estimated by non-linearly fitting the standard MR decay function to the fat and water peak areas (1). The relationship between T1 and T2 values of fat and water, and histologically-determined steatosis, inflammation, and fibrosis were examined using Spearman’s correlation.Results
51 adults were enrolled in this study. Water T1 showed a positive association with fibrosis (rho = 0.31and p =0.03), (Figure 2). Water T1 and T2 and Fat T1 and T2 all showed associations with steatosis grade (rho = -0.3, -0.48, -0.29, 0.60; p < 0.02, p < 0.0005, p = 0.04, p < 0.00005) (Figure 3). There were no other statistically significant associations.Conclusions
In adults with NAFLD, hepatic fibrosis shows association with MRS-estimated water T1 and steatosis with the T1 and T2 of water and fat. This may contribute to noninvasive methods of detection and monitoring of NALFD.Acknowledgements
No acknowledgement found.References
1. Hamilton G, Middleton MS, Hooker JC et al J Magn Reson Imaging 2015; 42: 1538-1543.
2. Bydder M, Hamilton G, Yokoo T, Sirlin CB. Magn Reson Imaging 2008;26:847-850
3. Vanhamme L, van den Boogaart A, Van Huffel S. J Magn Reson 1997;129:35-43
4. Naressi A, Couturier C, Devos JM, et al. MAGMA 2001;12:141-152
5. Kleiner DE, Brunt EM, Van Natta M, et al. Hepatology 2005;41:1313-1321
Figures