2525
The Neurotransmitter NAAG in Different Phases of Relapsing-Remitting Multiple Sclerosis Patients1Department of Radiology, Swiss Paraplegic Centre, Nottwil, Switzerland, 2Institute for Biomedical Engineering, ETH and University of Zurich, Zurich, Switzerland, 3Max-Planck Institute for Biological Cybernetics, Tuebingen, Germany, 4Neuroimmunology and Multiple Sclerosis Research, Department of Neurology, University Hospital and University Zurich, Zurich, Switzerland
Synopsis
This study explores the alterations of N-Acetyl aspartate (NAA) and the neurotransmitter N-Acetyl aspartyl glutamate (NAAG) in the cerebral normal-appearing white tissue of multiple sclerosis patients with a relapsing-remitting course. A two-dimensional J-resolved single voxel spectroscopy sequence and two-dimensional prior-knowledge fitting is used to disentangle the resonance lines of NAA and NAAG.
Introduction
Multiple sclerosis (MS) is a central nervous system disease that is
driven by environmental and genetic factors and manifests in subgroups at various
demyelinating and neurodegenerative stages.1 Magnetic resonance
spectroscopy (MRS) allows for non-invasive in-vivo assessment of the
biochemical profile and allows insight into ongoing alterations.
Large concentration metabolites including N-Acetyl-Aspartate (NAA) have been
investigated previously2,3,4.
In
this present study, we examine the metabolic concentrations of the
neurotransmitter N-Acetyl aspartyl glutamate (NAAG) for the first time in the normal appearing white matter of relapsing-remitting
MS patients in different subgroups of disease activity.
Data and Methods
Single voxel spectroscopic data were acquired in 31 relapsing-remitting multiple sclerosis patients (RRMS) and 20 healthy controls (HC). A two-dimensional J-resolved spectroscopy sequences was applied to acquire data from the normal appearing white matter at the periventricular zone, as previously5 reported. In essence, a 100-step TE series using PRESS localization was used (VOI=25x20x20mm3, TE=[30ms:2ms:228ms], TR=1600ms) and fitting was done with ProFit26 including NAA and NAAG as two separate basis sets among 18 metabolite profiles in total.In a second step, the RRMS patients were stratified according to changes of their neurological scores (Expanded Disability Status Scale, EDSS) during the last year prior to the MRS measurement. The following subgroups were investigated: decreased EDSS = dRRMS, stable EDSS = sRRMS, increased EDSS = iRRMS.
All statistical analyses were done in R (Version 3.4.3). Group differences were evaluated using Kruskal-Wallis tests followed by pairwise Wilcoxon signed rank test.
Results
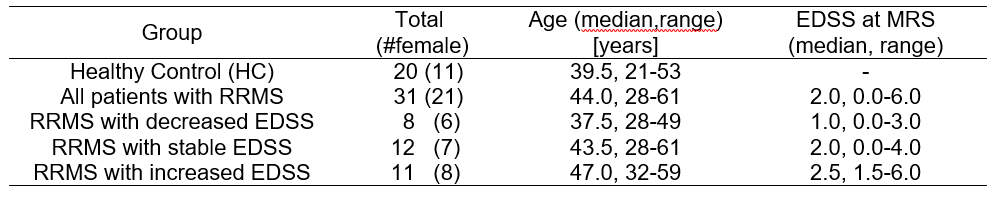
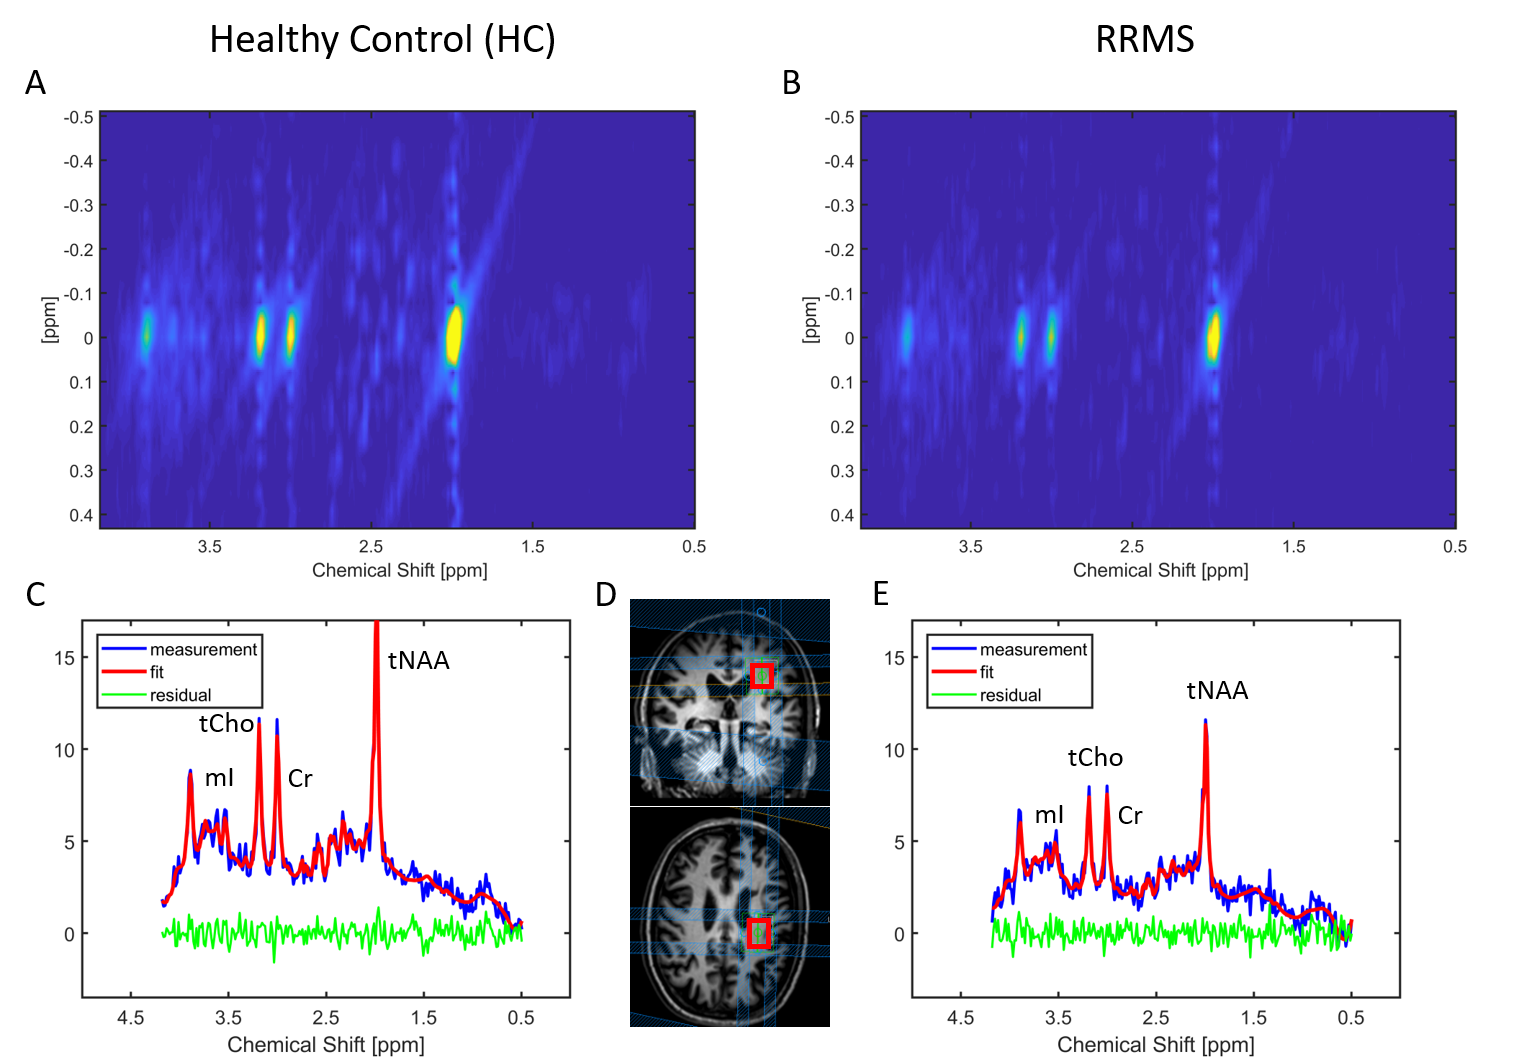
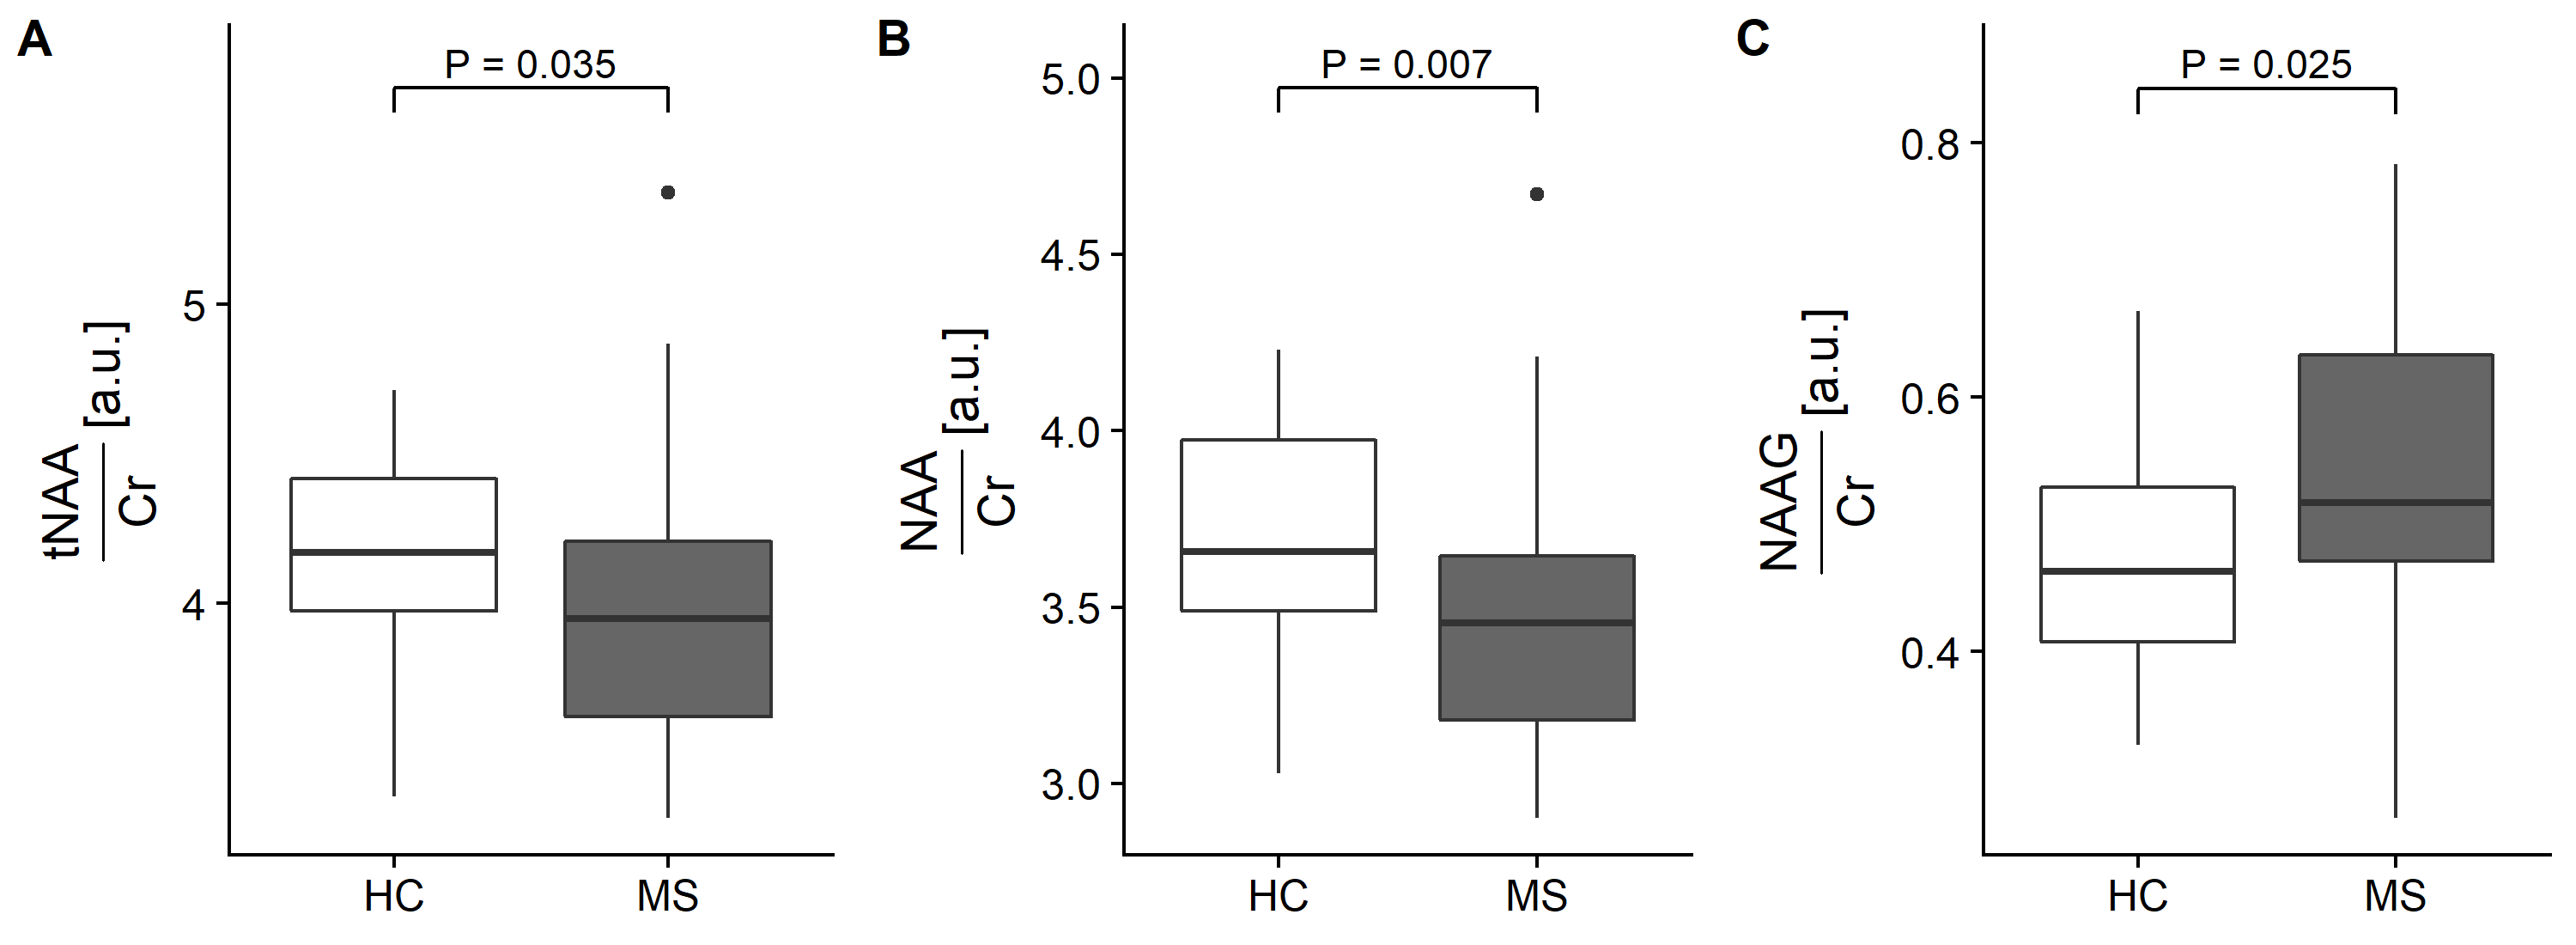
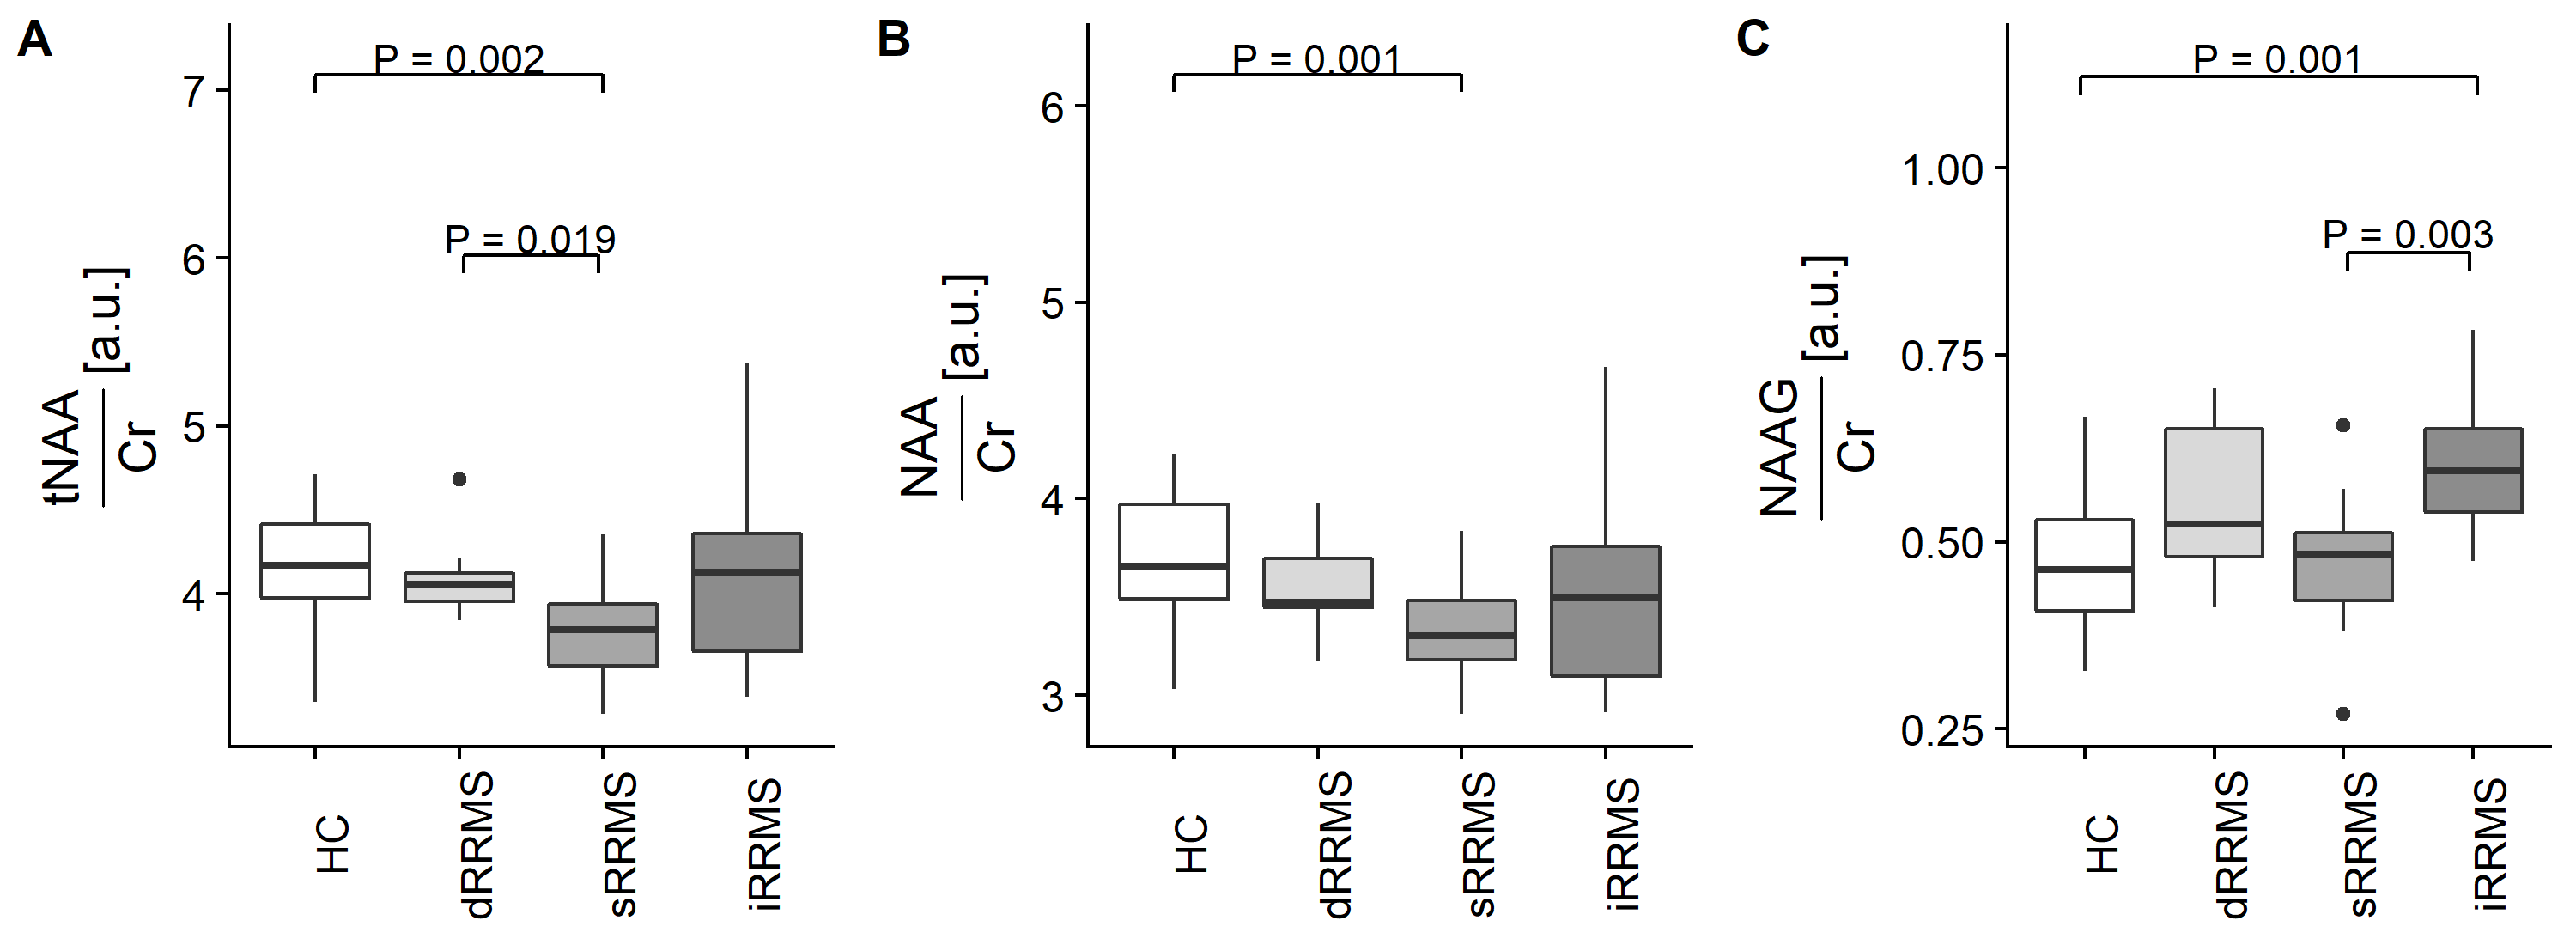
The study population is summarized in Fig.1. The MRS voxel position in normal appearing white matter (WM) and representative 2D J-resolved spectra and their 1D projections are shown in Fig.2. Fig.3 shows boxplots of total NAA (tNAA=NAA+NAAG, in A), NAA (in B) and NAAG (in C) concentrations normalized to creatine (Cr) for the comparison of HC to MS patients. The tNAA/Cr (P=0.035) and NAA/Cr (P=0.007) ratios are lower in MS patients versus HC, whereas the NAAG/Cr concentration ratio is higher in MS patients when compared to HC (P=0.025). Fig.4 shows a comparison of HC to different RRMS subgroups (dRRMS, sRRMS, iRRMS) using the same metabolite ratios as above. Lower concentration ratios are reported for tNAA/Cr and NAA/Cr in dRRMS and NAA/Cr in sRRMS subgroups versus HC (P=0.002, P=0.019 and P=0.001, resp). In contrast, the NAAG/Cr ratio is higher for iRRMS patients than HC (P=0.001).Discussion
With two-dimensional J-resolved spectroscopy, it is possible to disentangle the resonance lines of NAA and NAAG, which usually overlap in one-dimensional 1H MRS experiments at 3T6. In line with previous results, the ratio NAA/Cr is lower in MS patients compared to HC reflecting the neural loss in multiple sclerosis7,8. Since the contribution of NAAG to the total NAA signal is small (factor 1:6), the sum of NAAG and NAA, i.e. tNAA/Cr is also lower in RRMS patients. Interestingly, NAAG/Cr is higher in the WM of RRMS patients than in HC. It has been proposed that NAAG might act as a neuroprotective factor inhibiting neuronal apoptosis9 and correlated with cognitive function when measured in the right hippocampus in MS patients10. Impact of NAAG levels on disease activity and clinical performance should be further evaluated. Hereby clinical tests should cover functions that are associated with the brain region where the MRS data were obtained. NAAG might thus be useful as biomarker in future clinical trials.Conclusion
This is the first MR spectroscopy evaluation of NAAG alterations in subgroups of relapsing-remitting multiple sclerosis patients with different disease activity stages. Lower tNAA/Cr and NAA/Cr ratios are shown for RRMS patients, whereas NAAG/Cr is higher in RRMS patients when compared to HC. Metabolite ratios depend on the average EDSS score during the previous year with opposite behavior of NAA and NAAG.Acknowledgements
The authors thank all participants for their involvement in this study. Funding by the Swiss National Science Foundation (Grant Number: 143715) and support by the Clinical Research Priority Project-MS of the University Zurich are gratefully acknowledged.References
[1] Compston A et al. The
Lancet 2008;372(9648):1502-17.
[2] Siobhan ML et al.
Magnetic Resonance Imaging 2000;18(4):455-459.
[3] Chard DT et al. Brain
2002;125(10):2342-2352.
[4] Srinivasan R et al. Brain
2005;128(5):1016-1025.
[5] Wyss PO et al. Proc Intl Soc Mag
Reson Med. Honolulu, HI, USA 2017:881.
[6] Fuchs A et al. Magn Reson Med 2014; 71(2):458-468.
[7] Bjartmar C et al. Ann Neurol 2002; 48:893-901.
[8] Pardini M et al. Eur J Neurol 2016; 23(12):1769-1774.
[9] Neale et al. J Neurochem 2011; 119:891-895.
[10] Kristen A et al. PNAS 2012 109(49): 20101-20106.
Figures