2524
Cerebellar GABA+/Glx ratios in essential tremor patients are correlated with tremor severity1Department of Radiation Physics, and Department of Medical and Health Sciences, Linköping University, Linköping, Sweden, 2Center for Medical Image Science and Visualization (CMIV), Linköping University, Linköping, Sweden, 3Department of Biomedical Engineering and Department of Neurosurgery, Linköping University, Linköping, Sweden, 4Department of Clinical and Experimental Medicine, and Department of Neurosurgery, Linköping University, Linköping, Sweden
Synopsis
The aims of this study were to investigate whether GABA+ and Glx concentrations, and the relation between them, were altered in patients with severe essential tremor (ET) compared to healthy controls, and to investigate if the GABA and Glx concentrations were associated with the tremor severity. We observed an increasing GABA+/Glx ratio with tremor severity in the ET patients. Our conclusion was that this increasing cerebellar GABA+/Glx ratio mainly was driven by the decrease in Glx rather than an increase in GABA+, which suggests that an increasing tremor severity is partly due to a disturbance in the Glx concentration.
Introduction
Essential tremor (ET) is a common movement disorder that is characterized by action tremors during simple voluntary movements such as drinking, eating, and writing1. The tremor is often insidious, progressive and very disabling for the patients. Despite ET being a common neurological disorder, the mechanism behind ET is poorly understood. However, other common symptoms of ET such as impaired gait and balance dysfunction, may suggest that cerebellum is involved in the pathophysiology of ET2. Furthermore, Louis et al (2018) investigated cerebellar (dentate nucleus) GABA+ concentrations using magnetic resonance spectroscopy (MRS) in ET patients compared to healthy controls, and did not find any significant changes in the GABA+ concentration3. Moreover, Paris-Robidas et al (2012) showed that the GABA receptors were less abundant in the dentate nucleus of cerebellum in patients with essential tremor4.Therefore, we aimed to further investigate the cerebellar involvement in ET by not only target the GABA+ concentration (GABA + coedited macromolecular signal), but also the concentration of the corresponding main excitatory neurotransmitter glutamate (Glu), which commonly is reported as the combined MRS measure of glutamine and glutamate (Glx, mostly Glu). Furthermore, we also aimed to investigate the relationship between these cerebellar inhibitory and excitatory neurotransmitter concentrations and the tremor severity.Method
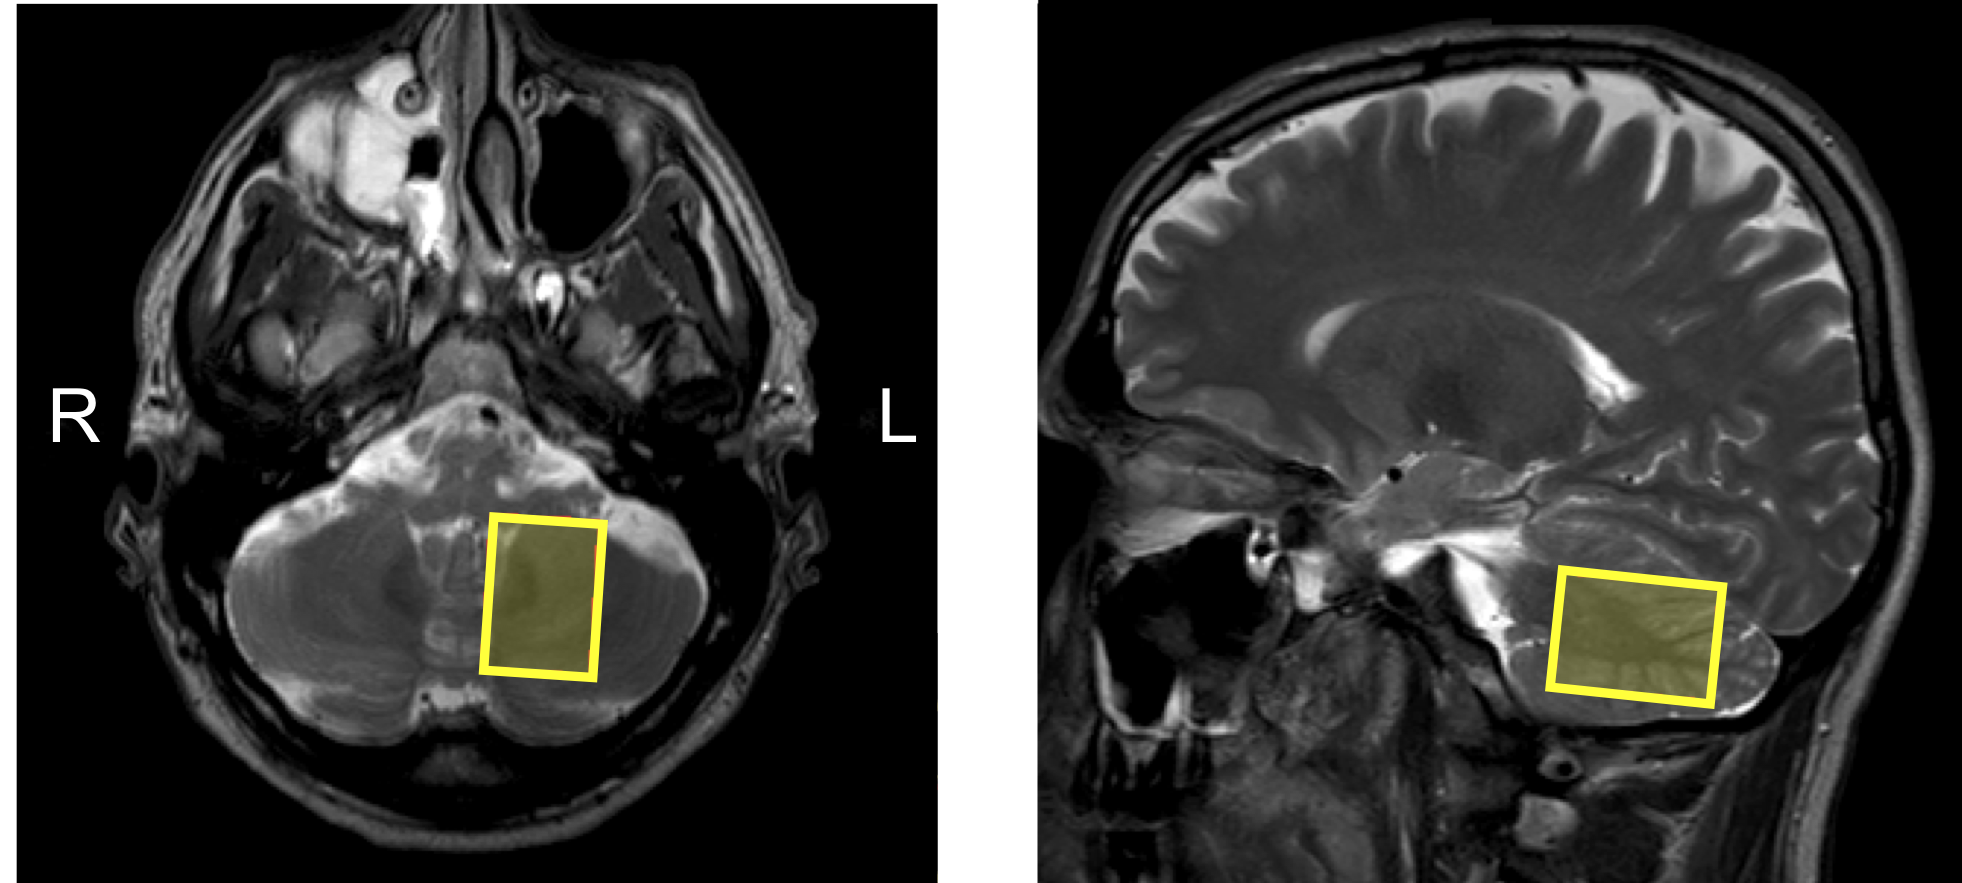
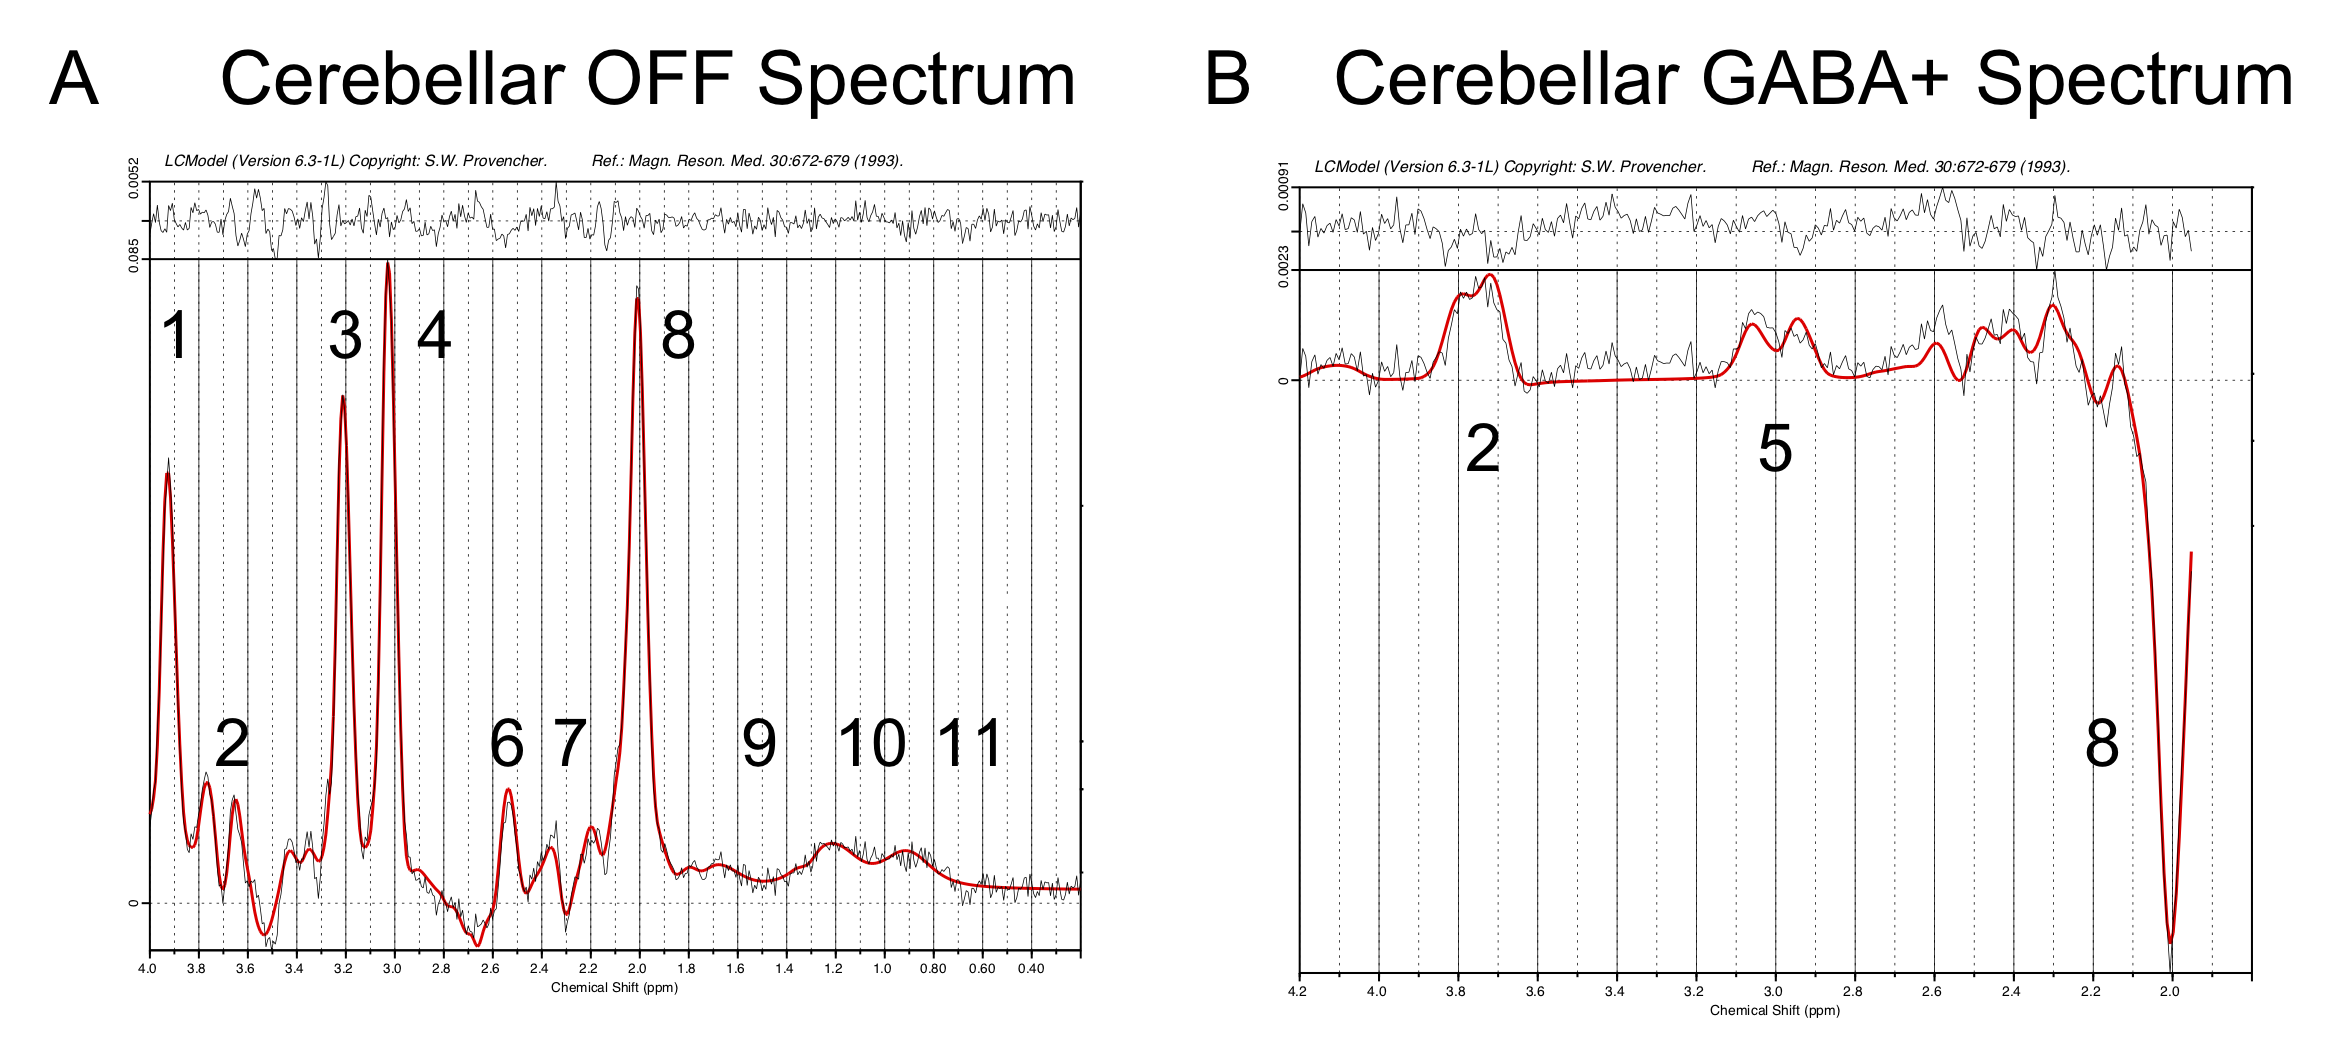
10 patients with severe ET scheduled for deep brain stimulation intervention, and 6 age-matched healthy controls underwent an MRS examination using a 3 T Philips Ingenia MR scanner equipped with a 12-channel phased array head coil. Structural T1-weighted images were used for voxel placement, and the MRS data were acquired using a MEGA-PRESS pulse sequence5-7 (TR/TE = 2000/68 ms, 40 dynamics, 8 phase cycle steps, edited pulses ON/OFF at 1.90/7.46 ppm, water suppression MOIST) with the voxel (35 x 25 x 25 mm3) placed in the left and right cerebellar hemisphere (Figure 1). Directly afterwards, an unsuppressed water reference measurement (2 dynamics) was collected within the same voxel, which was used for water scaling. The MRS data were phase corrected8 and frequency aligned before quantifying GABA+ and Glx using LCModel9 (Version 6.3-1L). For the purpose of GABA+ quantification, the resulting difference spectrum was analyzed, thus, the average OFF spectrum was subtracted from the average ON spectrum, which reveals the GABA signal at 3 ppm (Figure 2B). Finally, for the purpose of Glx quantification, the average OFF spectrum was analyzed (Figure 2A). The essential tremor rating scale (ETRS) was used according to Fahn, Tolosa, and Marin, to assess the tremor severity in patients and controls. The upper right extremity was evaluated with part A item 5, and part B items 10-14. The ETRS score was defined as the sum of the evaluated items (max score 32). Finally, the statistical analyses were performed using unpaired non-parametric Mann-Whitney test to investigate differences between the ET patients and the control group. Also, the Spearman correlation coefficients were computed to detect any correlation between the concentrations and the tremor severity.Results
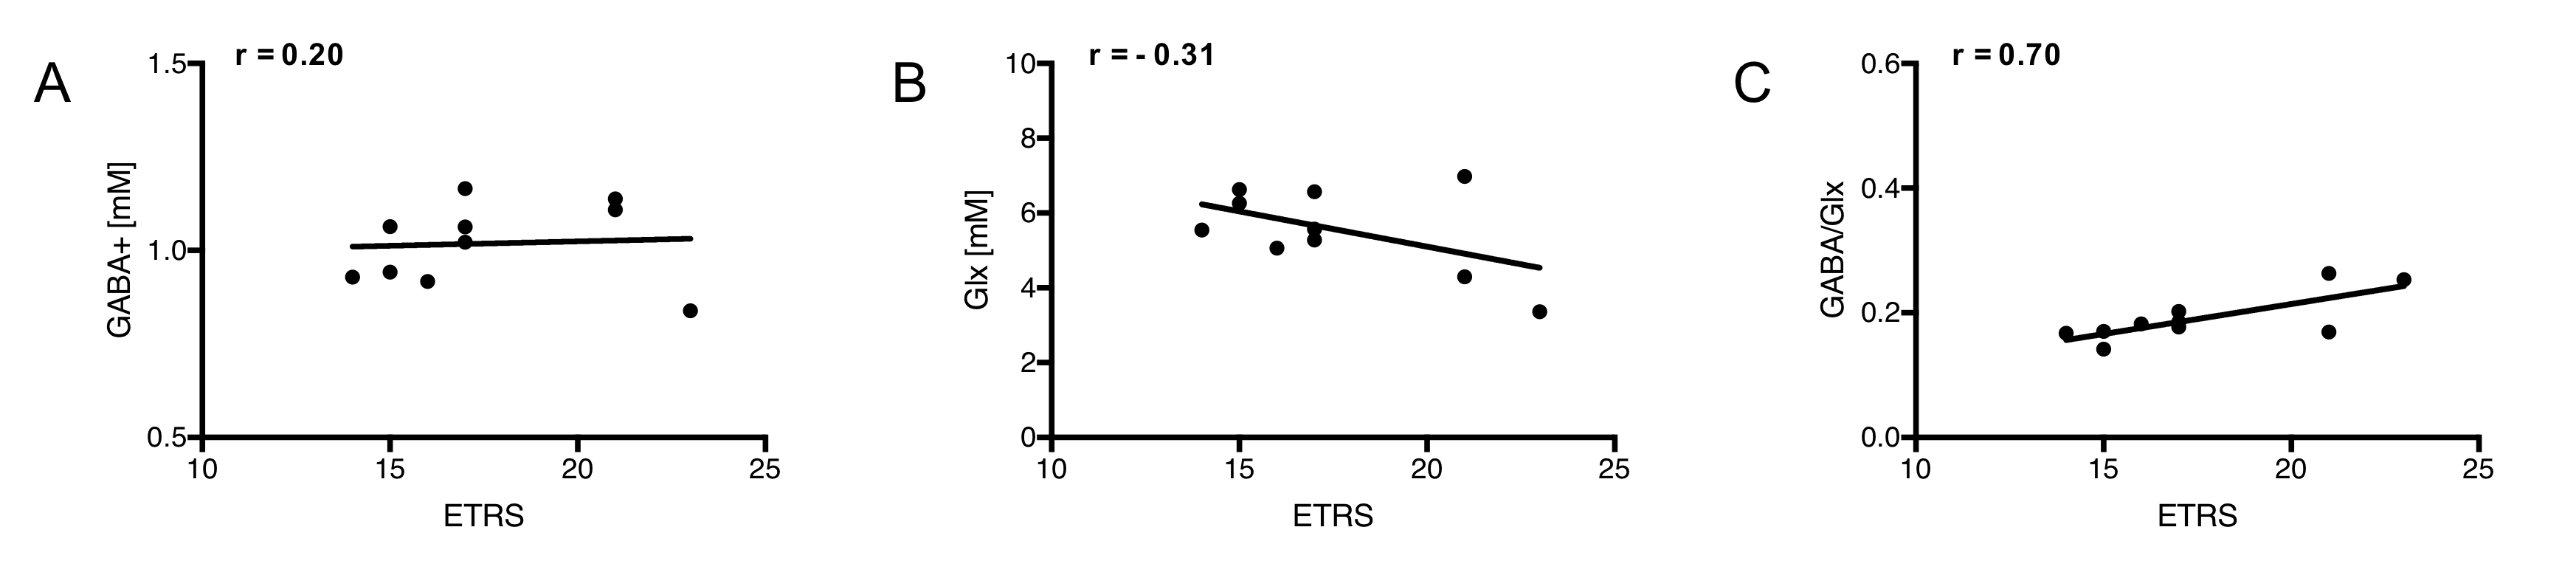
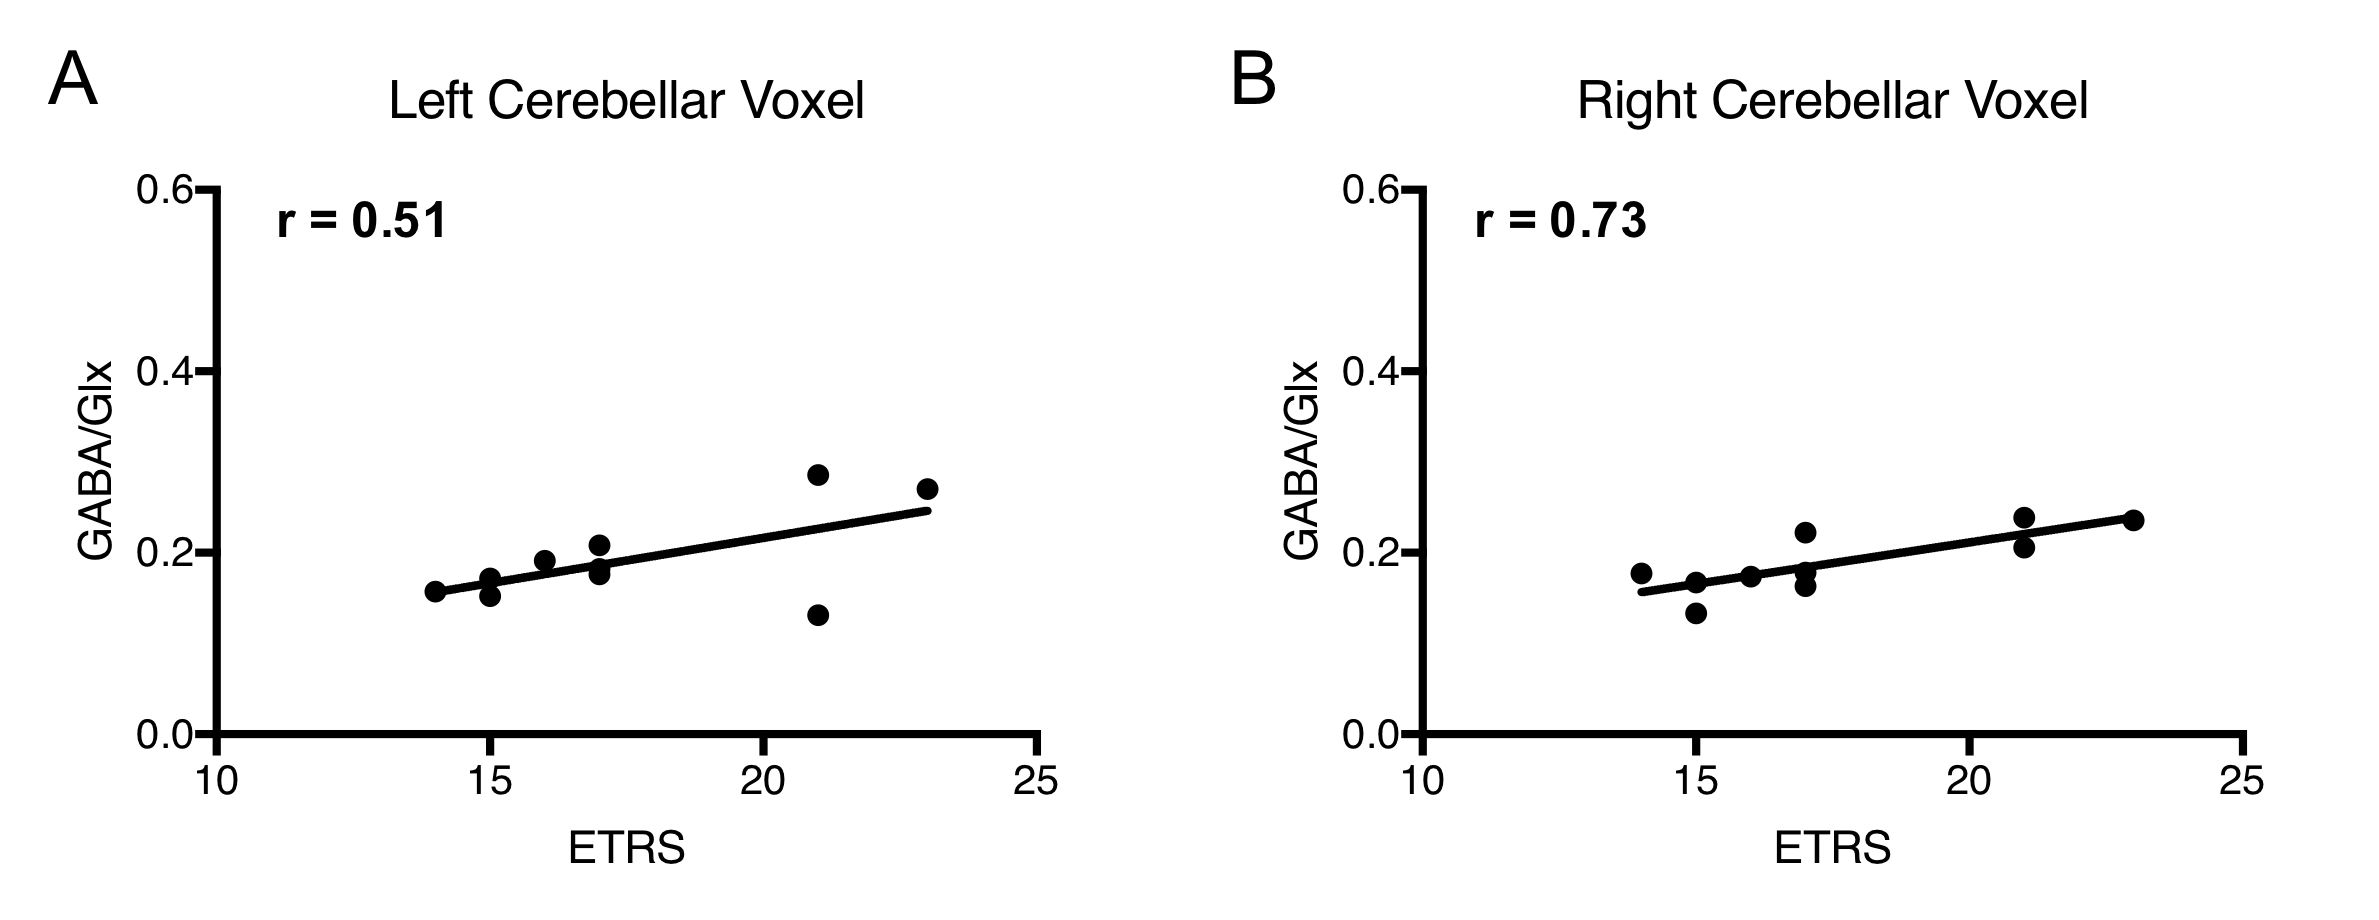
We observed no significant group level differences in cerebellar GABA+ or Glx concentrations, or in the GABA+/Glx ratio between the ET patients and the control group (p > 0.7). Figure 3 shows the results from the correlation analyses, which showed a significant positive correlation between the bilateral GABA+/Glx ratio and the tremor severity in the patients (r = 0.70, p = 0.03). Furthermore, Figure 4 shows the GABA+/Glx ratio for the left and right cerebellar hemisphere, where the right cerebellar GABA+/Glx ratio remains significantly correlated to ETRS (r = 0.73, p = 0.02), meanwhile on the left side only a trend remained (r = 0.51, p = 0.14).Discussion
We did not observe any group level differences in cerebellar GABA+ concentration between the ET patients and the controls, which is in accordance with the results from the previous study3 by Louis et al (2018). Furthermore, our resulting correlations in Figure 3 suggest that the Glx concentration is the main factor driving the significant positive correlation between ETRS and GABA+/Glx ratio. Our interpretation of these results is that pathological changes caused by ET may be on the receptor level for GABA (as shown by Paris-Robidas4), and on the tissue concentration level with respect to cerebellar Glu.Conclusion
To our knowledge, this is the first study to show a correlation between tremor severity and an increasing cerebellar GABA+/Glx ratio. The increasing cerebellar GABA+/Glx ratio was driven by the decrease in Glx rather than an increase in GABA+, which suggests that an increasing ETRS score is partly due to a disturbance in the Glx (which mainly consists of Glu) concentration.Acknowledgements
The Knut and Alice Wallenberg Foundation is gratefully acknowledged for supporting the ‘Seeing Organ Function’-project
Research Foundation of the County Council of Östergötland, Medical Research Council of Southeast Sweden for supporting the study.
Richard Edden is gratefully acknowledged, for very generously providing the MEGA-PRESS pulse sequence and other tools that were developed under NIH GRANTS P41 015909 and R01 016089.
References
1. Klamin R, Annese J. Functional anatomy of essential tremor: lessons from neuroimaging. AJNR Am J Neuroradiol. 2014 Aug;35(8): 1450-7. doi: 10.3174/ajnr.A3586. Epub 2013 Apr 25.
2. Applegate LM, Louis ED. Essential tremor: mild olfactory dysfunction in a cerebellar disorder. Parkinsonism Relat Disord. 2005 Sep;11(6):399-402.
3. Louis ED, Hernandez N, Dyke JP, Ma RE, Dydak U. In vivo dentate nucleus Gamma-aminobutyric acid concentration in essential tremor vs. controls. Cerebellum. 2018 Apr;17(2):165-172. doi: 10.1007/s12311-017-0891-4.
4. Paris-Robidas S, Brochu E, Sintes M et al. Defective dentate nucleus GABA receptors in essential tremor. Brain, Volume 135, Issue 1, 1 January 2012, Pages 105-116.
5. Mescher M, Merkle H, Kirsch J, Garwood M, Gruetter R. Simultaneous in vivo spectral editing and water suppression. NMR Biomed. 1998 Oct:11(6):266-72.
6. Mullins PG, McGonigle DJ, O'Gorman RL, Puts NA, Vidyasagar R, Evans CJ, et al. Current practice in the use of MEGA-PRESS spectroscopy for the detection of GABA. Neuroimage. 2014;86:43-52.
7. Mescher M, Tannus A, Johnson MOn, Garwood M. Solvent Suppression Using Selective Echo Dephasing. Journal of Magnetic Resonance, Series A. 1996;123(2):226-9.
8. Klose U. In vivo proton spectroscopy in presence of eddy currents. Magnetic Resonance in Medicine. 1990;14(1):26-30.
9. Provencher SW. Estimation of metabolite concentrations from localized in vivo proton NMR spectra. Magnetic Resonance in Medicine. 1993;30:672-9.
Figures