2522
Quantitative susceptibility mapping and sodium imaging based analysis of susceptibility and sodium concentrations in the basal ganglia1Department of Neuroradiology, University Hospital Heidelberg, Heidelberg, Germany, 2Division of Medical Physics, German Cancer Research Center (DKFZ), Heidelberg, Germany
Synopsis
23Na concentrations and iron deposition in cerebral gray matter have both shown to be increased in degenerative and inflammatory cerebral diseases. This study employs sodium imaging and quantitative susceptibility mapping to assess differences in sodium concentrations and susceptibility within the basal ganglia in healthy volunteers at 7T. Results indicate a fundamentally different distribution of 23Na concentrations compared to the distribution of susceptibility within the nuclei of the basal ganglia and suggest that not only susceptibility but also 23Na concentrations may be physiologically distributed in a characteristic manner.
INTRODUCTION
Quantitative susceptibility mapping (QSM) not only provides a spatially specific image contrast for optimized discrimination of basal ganglia 1,2, but also enables detection of increased iron deposition in the basal ganglia which has become a biomarker for a range of degenerative and inflammatory diseases such as multiple sclerosis, Parkinson’s and Huntington’s disease as well as alcohol use disorder 3-7. Similarly, increased 23Na concentrations in cerebral gray matter have been linked to Alzheimer’s disease and an increasing severity of multiple sclerosis 8,9 as 23Na tissue concentrations are thought to be dependent on volume of extracellular space and cellular membrane integrity. In this study, QSM-based mapping of the basal ganglia and sodium imaging are used to assess differences in sodium concentrations and susceptibility within the basal ganglia.METHODS
The study was conducted in accordance with the
Declaration of Helsinki. Institutional review board approval was obtained and
all subjects provided written informed consent. Five healthy volunteers (mean
age 28.4 ± 6.5 years; three female) were scanned on a 7 T whole-body MR system (MAGNETOM
7 T, Siemens Healthcare GmbH, Germany). A monopolar 3D gradient echo (GRE)
sequence was acquired for susceptibility mapping with a 8Tx/32Rx-channel head
coil (Nova Medical Inc., Wakefield, MA, USA) operated in CP+ mode using an
in-house-built Butler matrix with TR = 21 ms, TE1,2,3 = 6/12/18 ms, flip
angle = 10°, 0.5 mm isotropic resolution, and acquisition time 9:17 min:sec. After
a coil change, 23Na data were acquired using a double-resonant
1H/23Na Tx/Rx quadrature volume head coil integrating a 30-channel 23Na
Rx phased array (Rapid Biomedical GmbH, Rimpar, Germany) and a density adapted
3D radial pulse sequence ((Δx)3=(2.0mm)3, 7000 projections,
TR = 100 ms, TE1 = 0.35 ms, flip angle=90°, TA=11:40 min)12. The data were
reconstructed with adaptive combination (ADC). Sodium data were referenced such
that mean cerebrospinal fluid sodium values equaled the physiological
concentration of 140 mmol/l. A T1-weighted GRE-sequence was acquired
to facilitate image registration.
Susceptibility maps were generated from phase data that
were combined on the scanner using ASPIRE 13.
Brain masks were calculated using FSL-BET 14 from the first
echo of the GRE magnitude data. Laplacian-based phase unwrapping, V-SHARP 15-17
with kernel size up to 12 mm for background field removal and
STAR-QSM 18
were used in Matlab (R2017b, MathWorks, Natick, USA) to calculate
susceptibility maps. Volumes of interest (VOIs) (see Figure 1) for basal
ganglia were manually drawn on susceptibility maps with the Medical Imaging
Interaction Toolkit (MITK) 19,20.
Based
on the recorded
T1-weighted images, VOIs were
registered to sodium data in MITK.RESULTS
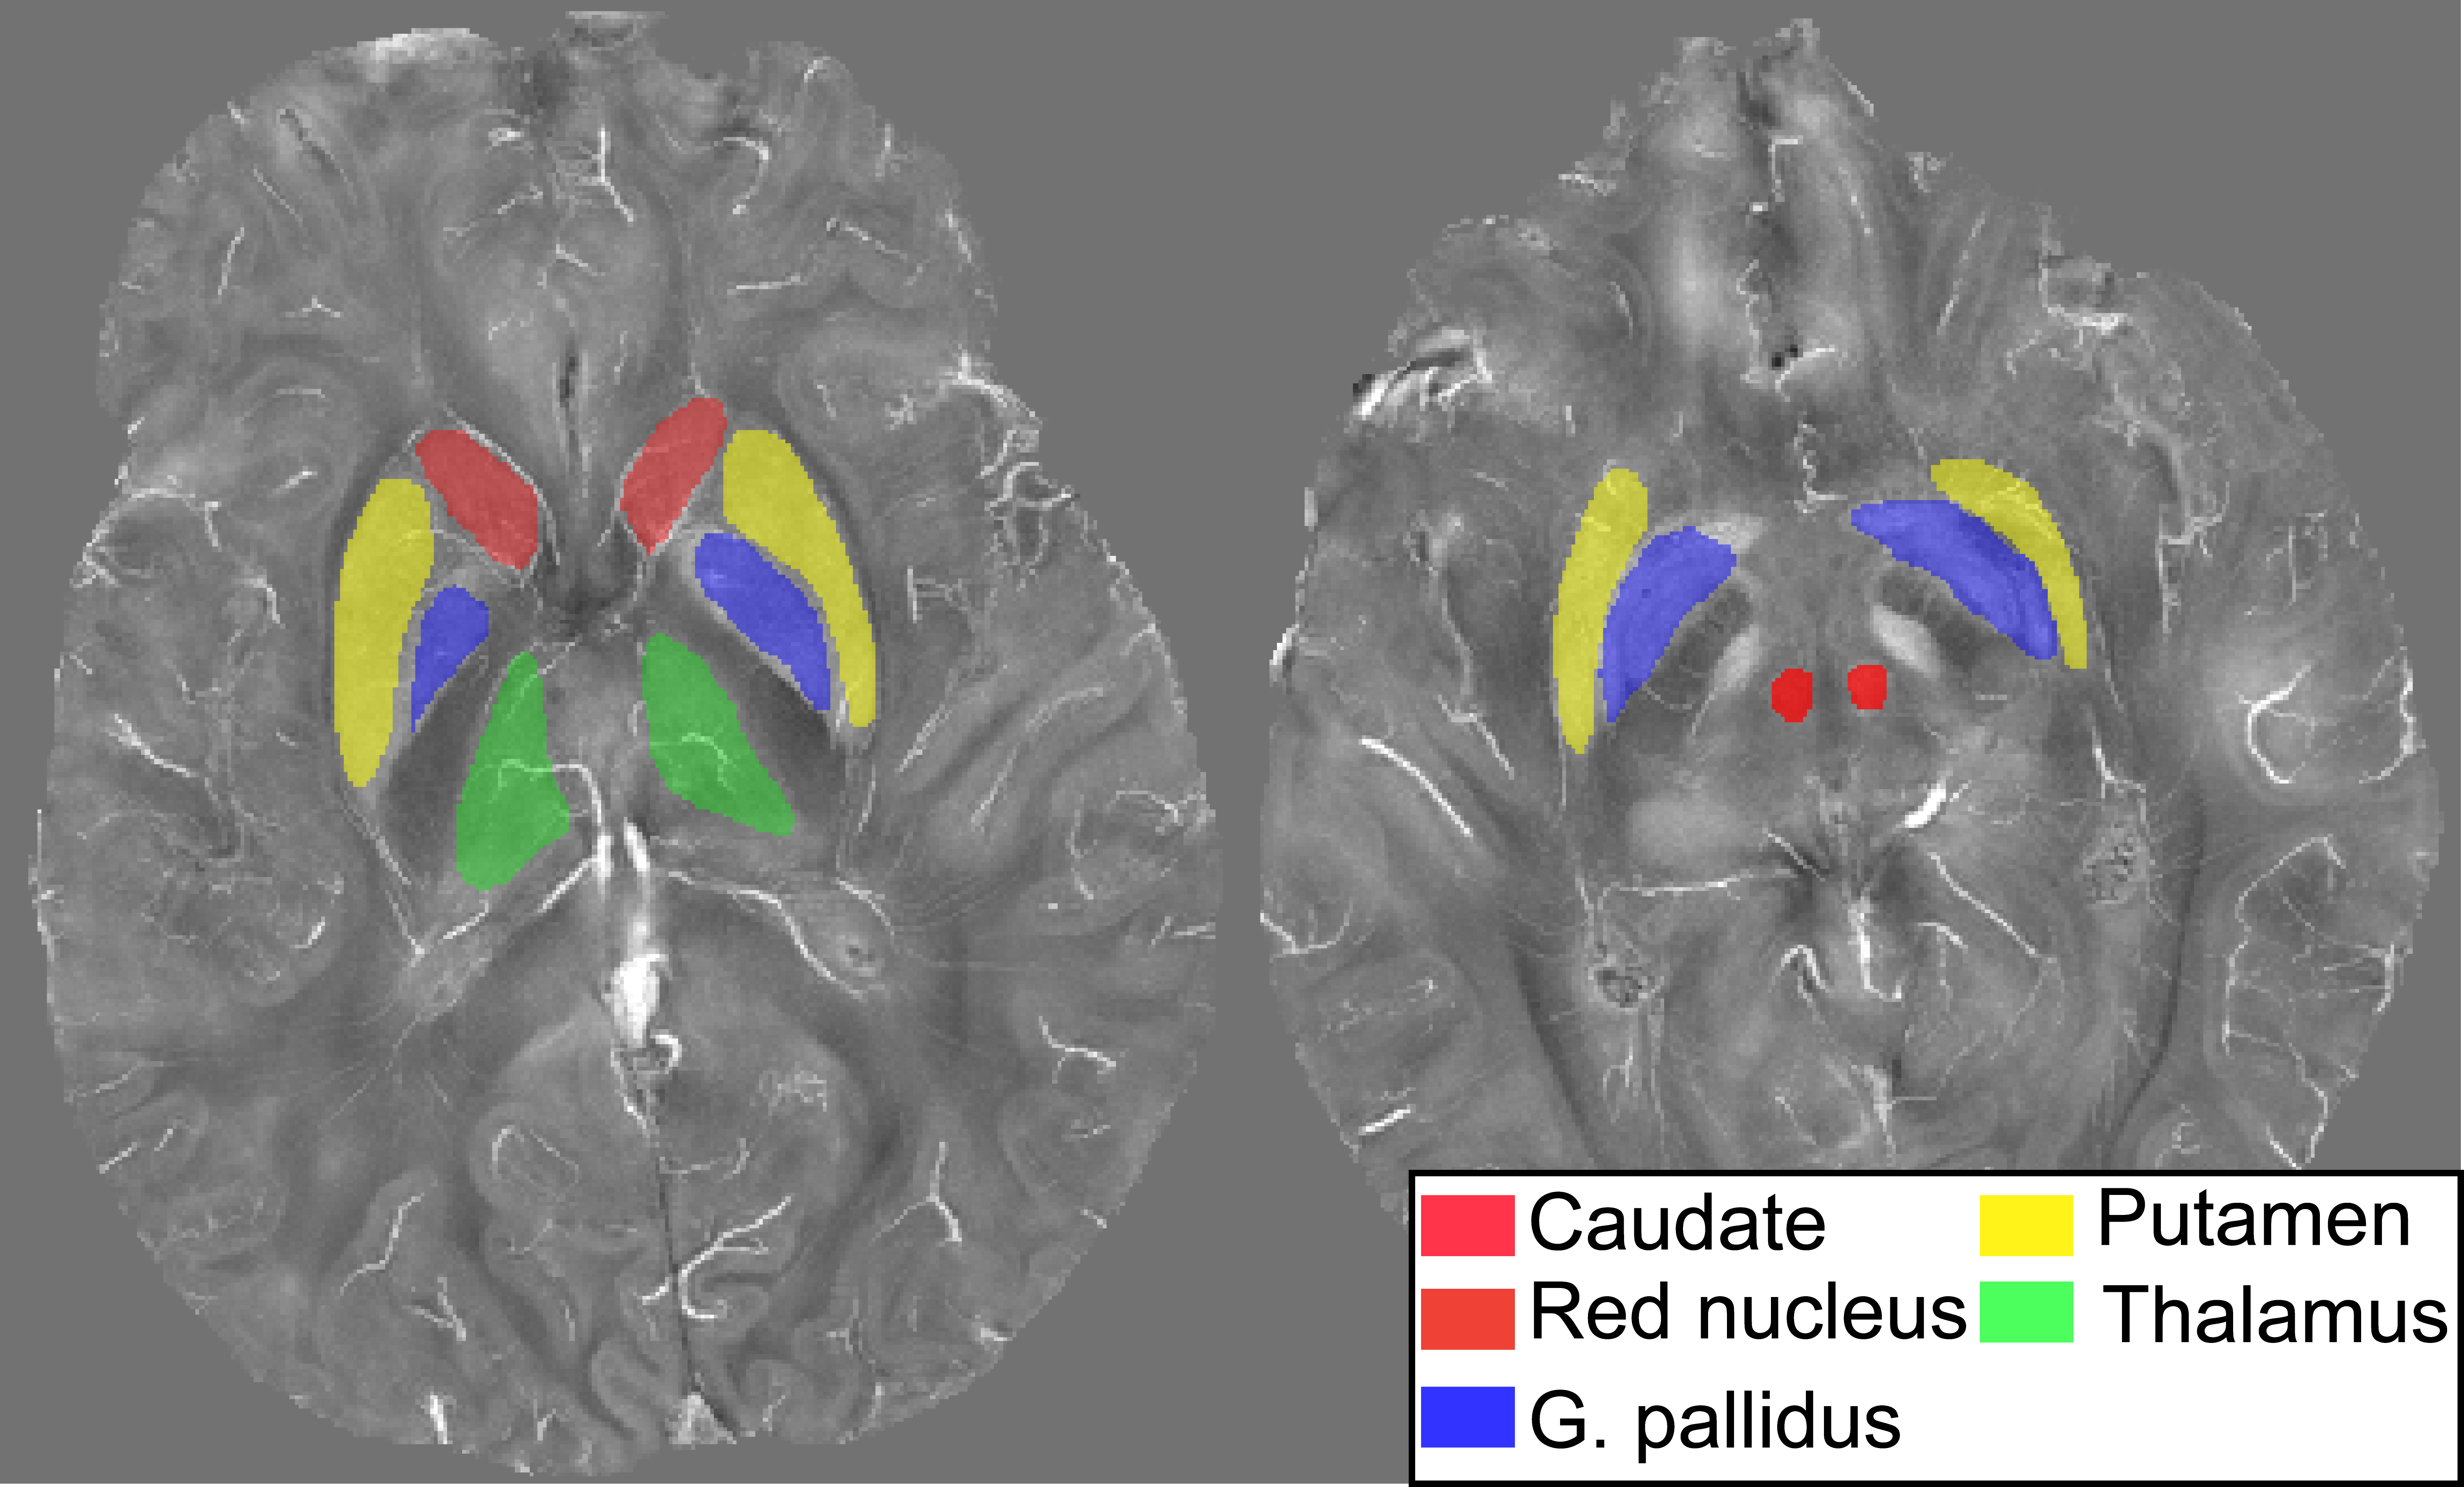
Figure 1 shows the segmented basal ganglia on
QSM with the red nucleus in orange, the caudate nucleus in red, the thalamus in
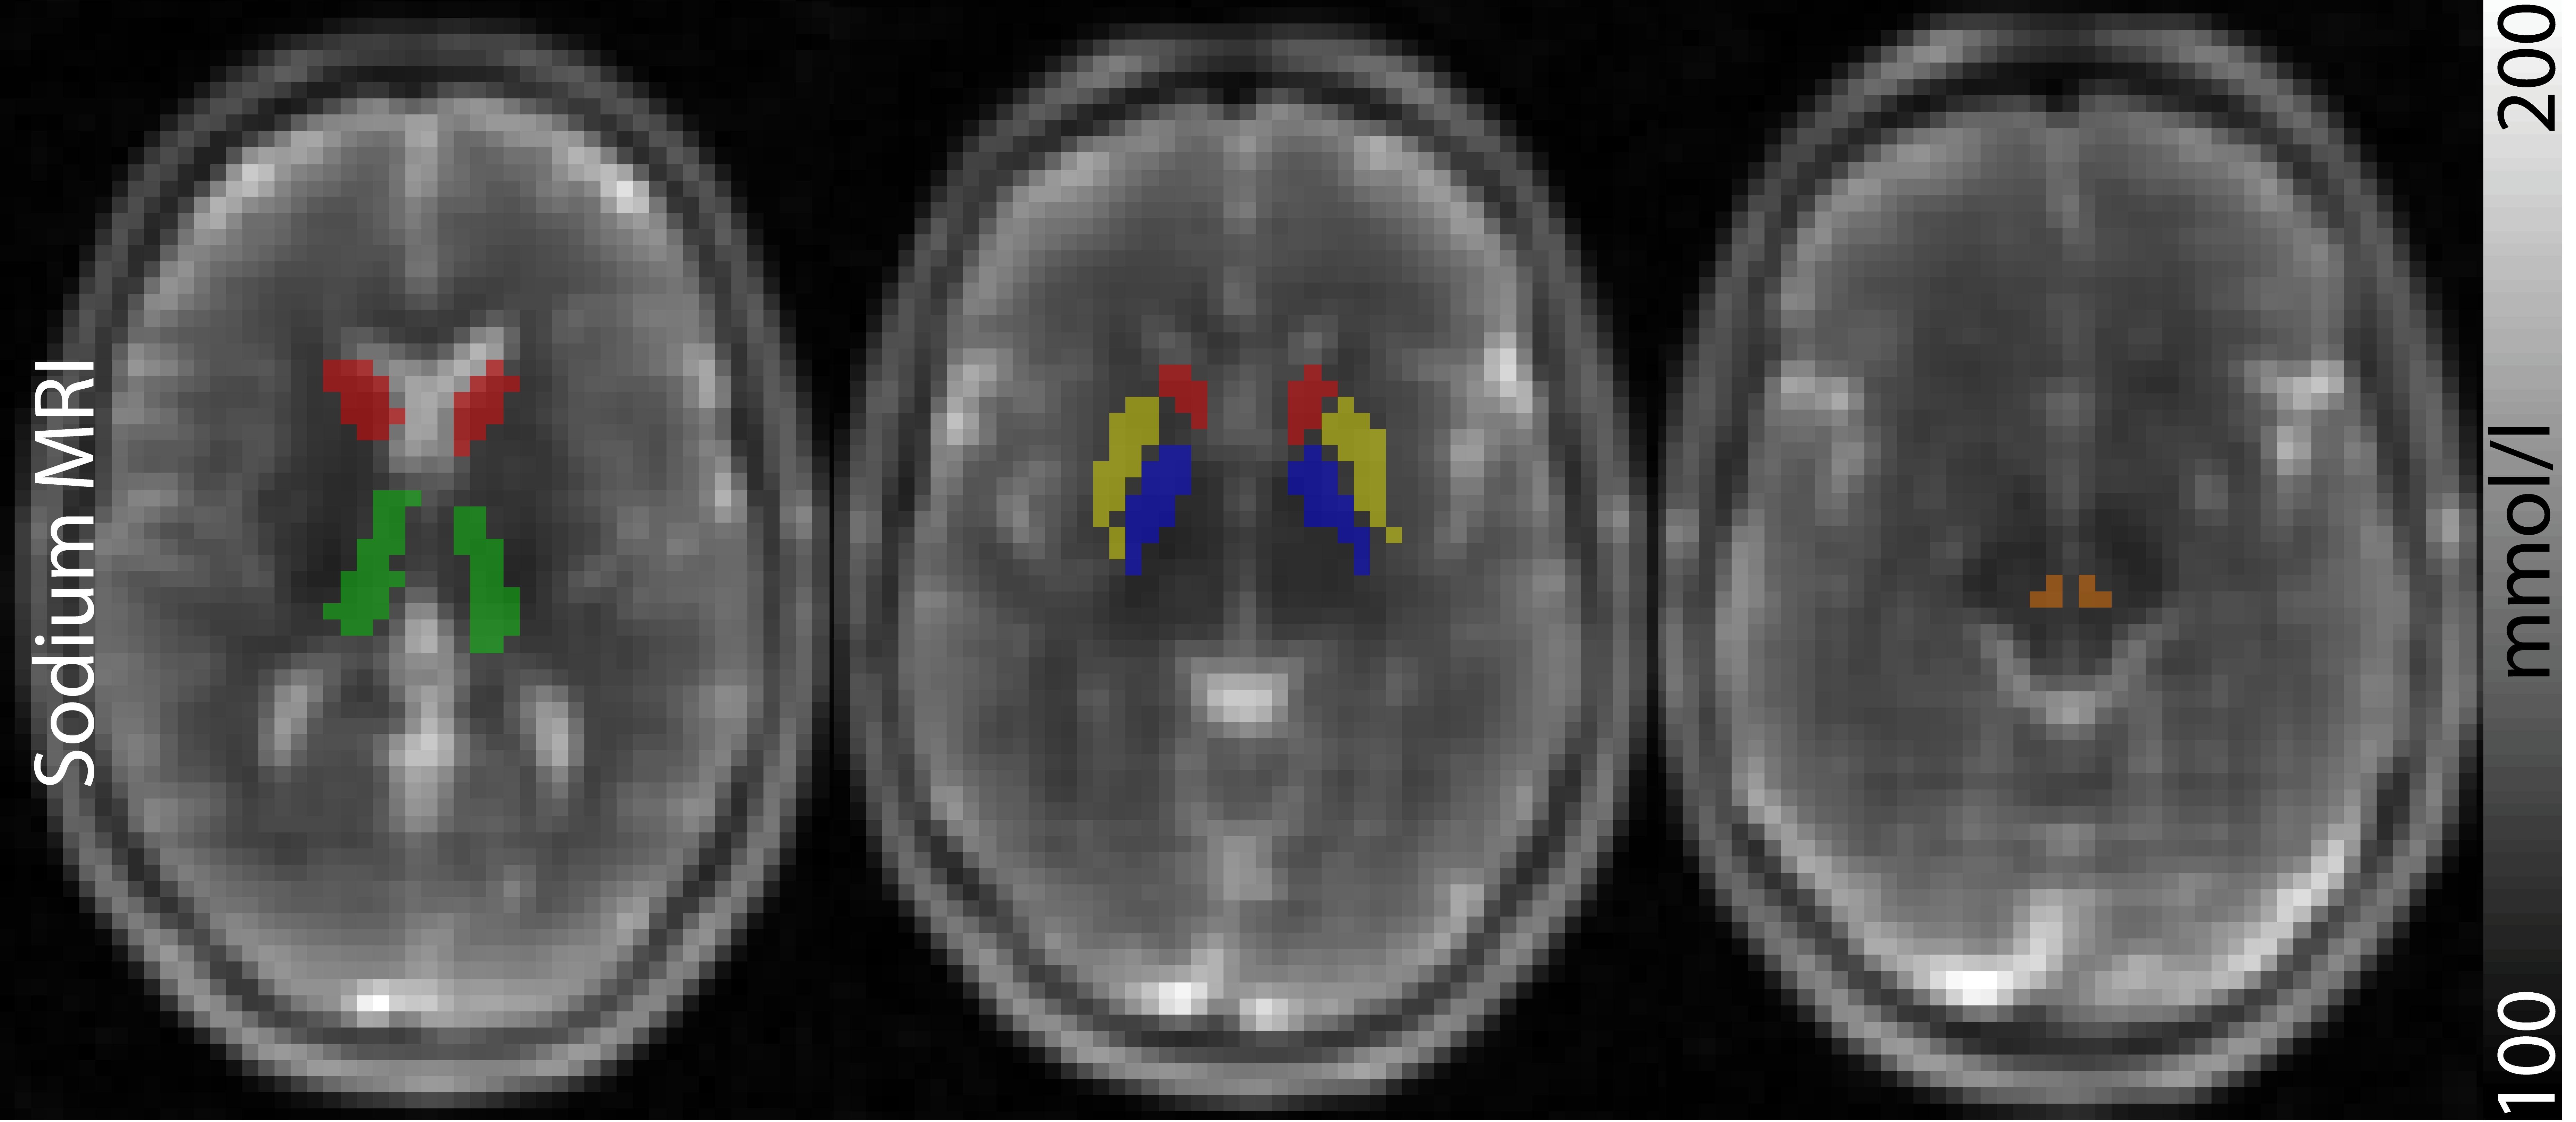
green, the pallidum in blue and the putamen in yellow. Figure 2 shows the
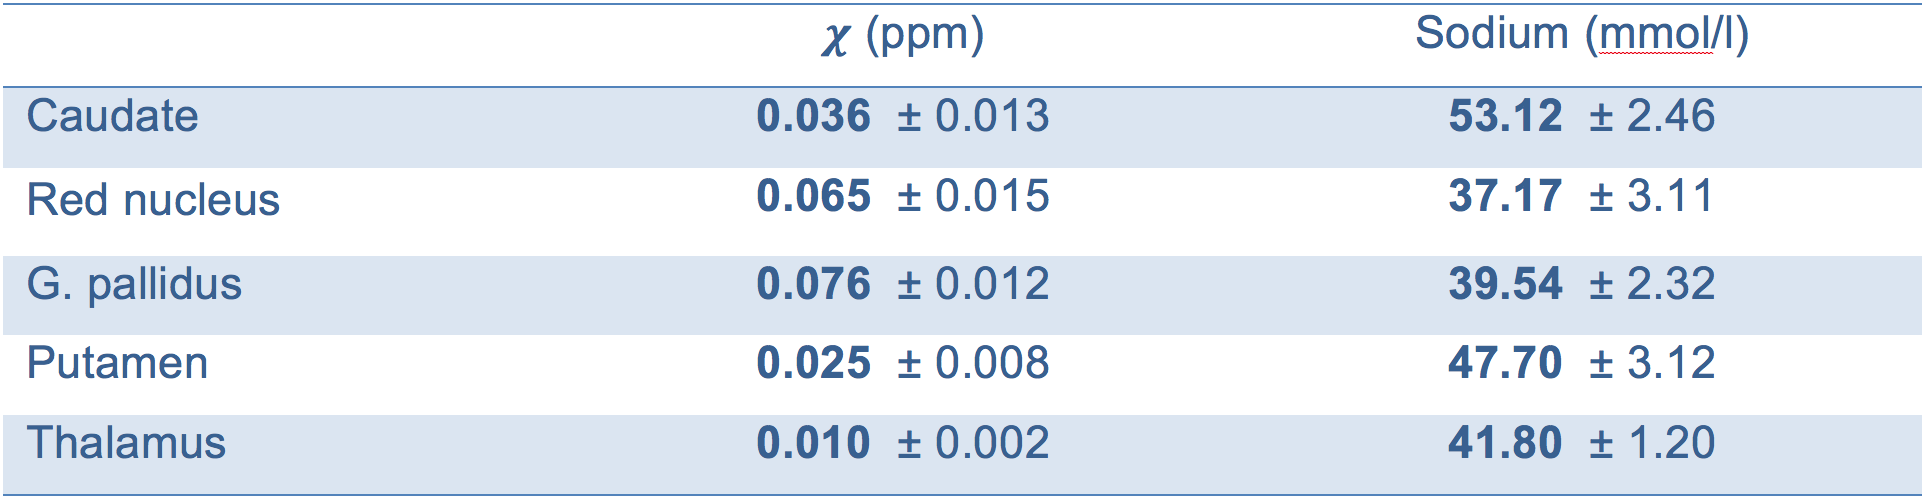
registered masks on axial 23Na images. Mean susceptibility and sodium values are
given in Table 1. The results show that the globus pallidus, the red nucleus
and the thalamus contain sodium concentrations in a similar range while caudate
and the putamen each feature distinctly higher sodium concentrations. In
comparison, susceptibility values of the basal ganglia possess a very different
distribution with values of the thalamus well below all other nuclei and comparatively
high values in the globus pallidus and red nucleus.DISCUSSION and CONCLUSION
Although 23Na concentrations and susceptibility of cerebral gray matter have both been shown to be elevated in degenerative and inflammatory diseases, the distribution of 23Na concentrations appears to be fundamentally different compared to the distribution of susceptibility within the nuclei of the basal ganglia. The interpretation of this study is limited by a low number of studied subjects; the results however suggest that not only susceptibility but also 23Na concentrations may be physiologically distributed in a characteristic manner. A recent study also investigating 23Na concentrations within the basal ganglia at a lower nominal isotropic resolution reported similar concentrations in the thalamus while the distribution of 23Na concentrations in the remaining basal ganglia differed in comparison to this study 21. A possible reason for differing results may be partial volume effects.
The results of this study suggest that basal ganglia may not only distinguish themselves through characteristic susceptibilities but also characteristic 23Na concentrations.
Acknowledgements
The provision of the ASPIRE gradient echo sequence and corresponding ICE program for coil combination of the 7T GRE data by Korbinian Eckstein and Simon D. Robinson is kindly acknowledged.References
1. Deistung A, Schafer A, Schweser F, Biedermann U, Turner R, Reichenbach JR. Toward in vivo histology: A comparison of quantitative susceptibility mapping (QSM) with magnitude-, phase-, and R-2*-imaging at ultra-high magnetic field strength. Neuroimage 2013;65:299-314.
2. Keuken MC, Bazin PL, Crown L, et al. Quantifying inter-individual anatomical variability in the subcortex using 7 T structural MRI. Neuroimage 2014;94:40-46.
3. Dominguez JF, Ng AC, Poudel G, et al. Iron accumulation in the basal ganglia in Huntington's disease: cross-sectional data from the IMAGE-HD study. J Neurol Neurosurg Psychiatry 2016;87:545-549.
4. Juhas M, Sun HF, Brown MRG, et al. Deep grey matter iron accumulation in alcohol use disorder. Neuroimage 2017;148:115-122. 5. Zivadinov R, Tavazzi E, Bergsland N, et al. Brain Iron at Quantitative MRI Is Associated with Disability in Multiple Sclerosis. Radiology 2018;289:487-496.
6. Langkammer C, Pirpamer L, Seiler S, et al. Quantitative Susceptibility Mapping in Parkinson's Disease. Plos One 2016;11.
7. Wallis LI, Paley MNJ, Graham JM, et al. MRI Assessment of Basal Ganglia Iron Deposition in Parkinson's Disease. J Magn Reson Imaging 2008;28:1061-1067.
8. Mellon EA, Pilkinton DT, Clark CM, et al. Sodium MR Imaging Detection of Mild Alzheimer Disease: Preliminary Study. Am J Neuroradiol 2009;30:978-984.
9. Zaaraoui W, Konstandin S, Audoin B, et al. Distribution of brain sodium accumulation correlates with disability in multiple sclerosis: a cross-sectional 23Na MR imaging study. Radiology 2012;264:859-867.
10. O'Brien MD, Jordan MM, Waltz AG. Ischemic cerebral edema and the blood-brain barrier. Distributions of pertechnetate, albumin, sodium, and antipyrine in brains of cats after occlusion of the middle cerebral artery. Arch Neurol 1974;30:461-465.
11. Boada FE, LaVerde G, Jungreis C, Nemoto E, Tanase C, Hancu F. Loss of cell ion homeostasis and cell viability in the brain: What sodium MRI can tell us. Curr Top Dev Biol 2005;70:77-+.
12. Nagel AM, Laun FB, Weber MA, Matthies C, Semmler W, Schad LR. Sodium MRI using a density-adapted 3D radial acquisition technique. Magn Reson Med 2009;62:1565-1573.
13. Eckstein K, Dymerska B, Bachrata B, et al. Computationally Efficient Combination of Multi-channel Phase Data From Multi-echo Acquisitions (ASPIRE). Magn Reson Med 2018;79:2996-3006.
14. Smith SM. Fast robust automated brain extraction. Hum Brain Mapp 2002;17:143-155.
15. Li W, Wu B, Liu CL. Quantitative susceptibility mapping of human brain reflects spatial variation in tissue composition. Neuroimage 2011;55:1645-1656. 16. Li W, Avram AV, Wu B, Xiao X, Liu CL. Integrated Laplacian-based phase unwrapping and background phase removal for quantitative susceptibility mapping. Nmr Biomed 2014;27:219-227. 17. Wu B, Li W, Guidon A, Liu CL. Whole brain susceptibility mapping using compressed sensing. Magn Reson Med 2012;67:137-147.
18. Wei HJ, Dibb R, Zhou Y, et al. Streaking artifact reduction for quantitative susceptibility mapping of sources with large dynamic range. Nmr Biomed 2015;28:1294-1303.
19. Maleike D, Nolden M, Meinzer HP, Wolf I. Interactive segmentation framework of the Medical Imaging Interaction Toolkit. Comput Meth Prog Bio 2009;96:72-83.
20. Nolden M, Zelzer S, Seitel A, et al. The Medical Imaging Interaction Toolkit: challenges and advances. Int J Comput Ass Rad 2013;8:607-620.
21. Ridley B, Nagel AM, Bydder M, et al. Distribution of brain sodium long and short relaxation times and concentrations: a multi-echo ultra-high field (23)Na MRI study. Sci Rep 2018;8:4357.
Figures