2519
Ouabain Inhibition Reverses Sodium Fluxes in a Preclinical Model of Migraine: a 23Na MRI Study at 21.1 T1Chemical and Biomedical Engineering, Florida State University, Tallahassee, FL, United States, 2National High Magnetic Field Laboratory, Florida State University, Tallahassee, FL, United States, 3Neurosciences, Huntington Medical Research Institutes, Pasadena, CA, United States
Synopsis
Increased sodium potassium ATPase(Na,K-ATPase) pump activity raises cerebrospinal fluid and brain sodium, resulting in the onset and progression of central sensitization [1-4]. With the goal of testing whether impaired Na,K-ATPase activity is implicit in the onset of migraine, this study makes use of ouabain to inhibit Na,K-ATPase activity and delineate sodium changes that may lie at the heart of migraine. At high spatial and temporal resolution, 23Na multislice CSI scans were acquired from a rodent migraine model, at 21.1 T following the onset or potential inhibition of central sensitization to identify localized sodium changes over 3-h after induction.
Introduction
Migraine manifests due to an interplay of genetic, environmental and hormonal factors that influence susceptibility. Although central sensitization and pain are major manifestations, ionic instability is implicit. The overall premise of this study is to pursue the origin homeostatic perturbations by evaluating the role of sodium transport that may impact neural activity involved in migraine.
Our human [2] and animal [1,3] studies have demonstrated bulk sodium changes, predominantly in the ventricular and trigeminovascular system, with the onset and progression of central sensitization. We hypothesize that neural excitability manifesting from sodium fluxes results from impaired Na,K-ATPase activity, and these imbalances are implicit in the origin and progression of migraine. Accordingly, ouabain, a cardiotonic steroid, was used to inhibit Na,K-ATPase activity, to test whether the previously reported [1] increased sodium fluxes that follow stimulation with nitroglycerin (NTG), are diminished with an Na,K-ATPase-specific inhibitor.
Performed at 21.1 T, this study aims to provide high spatial and temporal discrimination of bulk sodium changes following the onset, potential inhibition, and re-establishment of homeostasis with the onset of central sensitization over a time course of 3 h using repeated 23Na MRI.
Materials and Methods
Animal Model: Using a preclinical analogue of migraine based on NTG injection, twelve Sprague-Dawley male rats were imaged in this study. While anesthetized in the MR scanner, the rats (n=6/group) were administered in situ an IP injection of either 1 mg/kg of ouabain or saline followed (after 5-mins) by 10 mg/kg of NTG to provide conditions of Na,K-ATPase inhibition or control, respectively, prior to the central sensitization in the preclinical model.
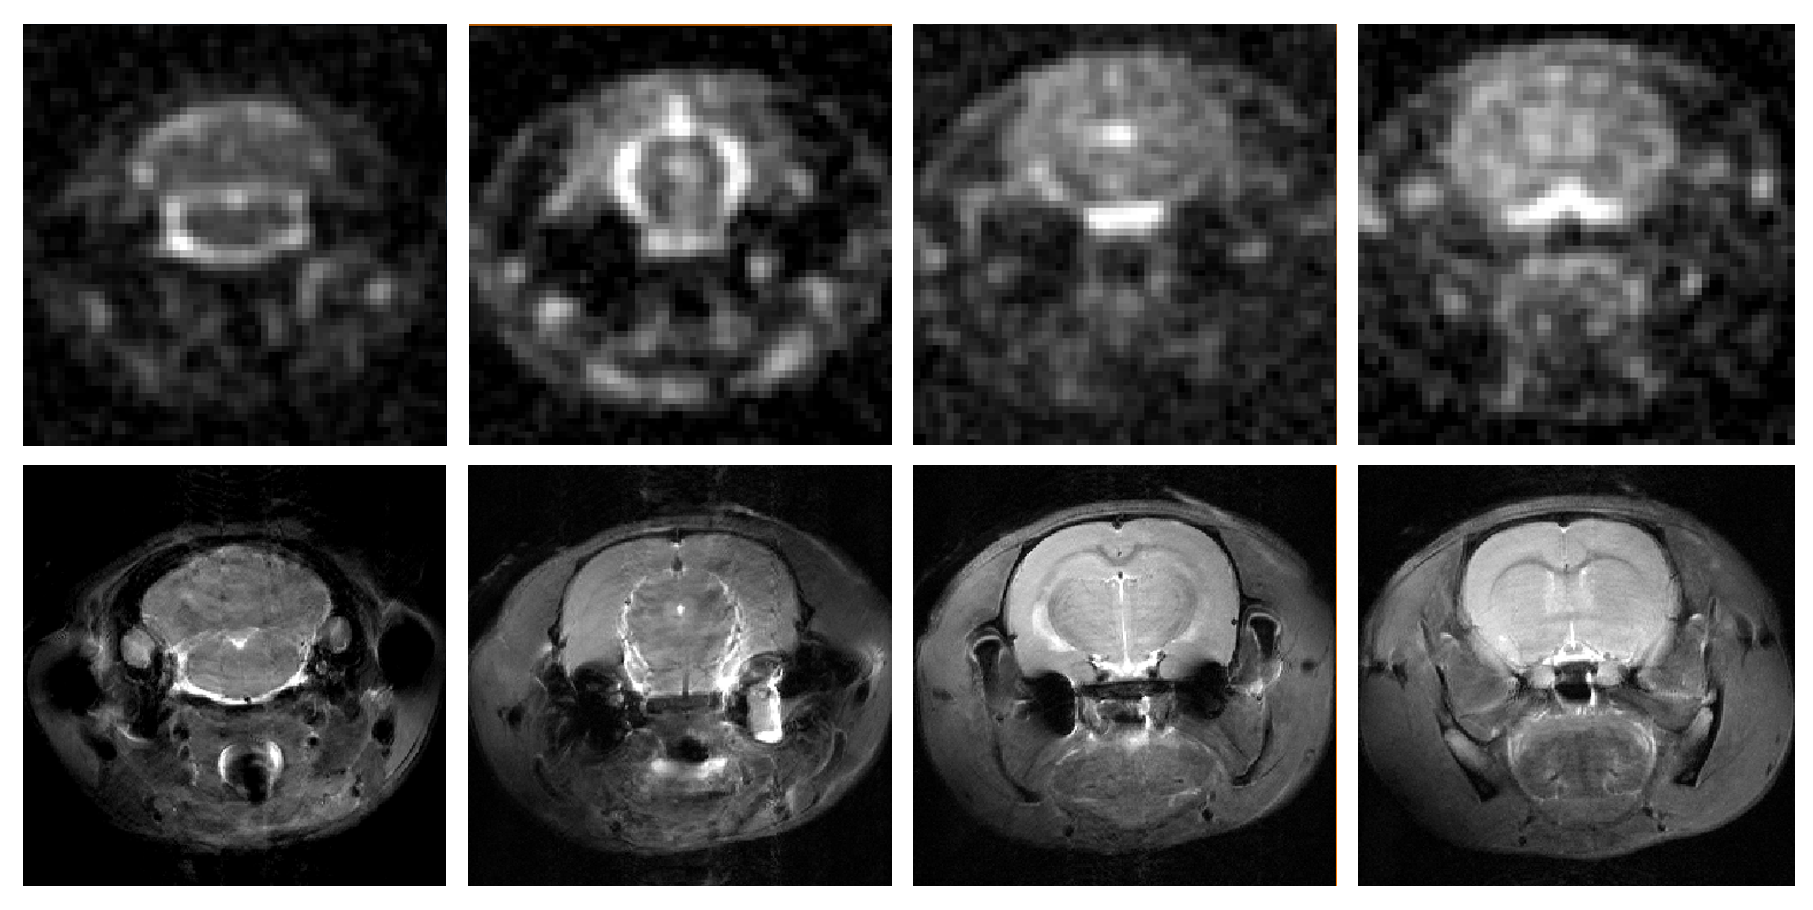
MR Acquisitions: Using the 21.1-T ultra-wide bore magnet at the US National High Magnetic Field Laboratory and a linear 1H/23Na birdcage coil, 2D multi-slice 23Na images were acquired using an optimized FID based Chemical Shift Imaging (CSI) sequence yielding an in-plane resolution of 1 x 1 mm. A weighted Gaussian sampling approach was used with 500 phase encodes, with NA=6 and TR=180 ms, resulting in a total acquisition time of 9-min. Four simultaneously acquired 2-mm coronal slices were located 1.68 mm anterior and 0.51, 5.2 and 8.32 mm posterior to bregma to provide image datasets that covered the lateral, third and fourth ventricles, extracerebral CSF, aqueduct, brainstem and cisterna magna. A total of twenty-four repeated scans were acquired starting from pre-injection, with 0.5 h of baseline scanning, followed by 3 h of post-injection scans.
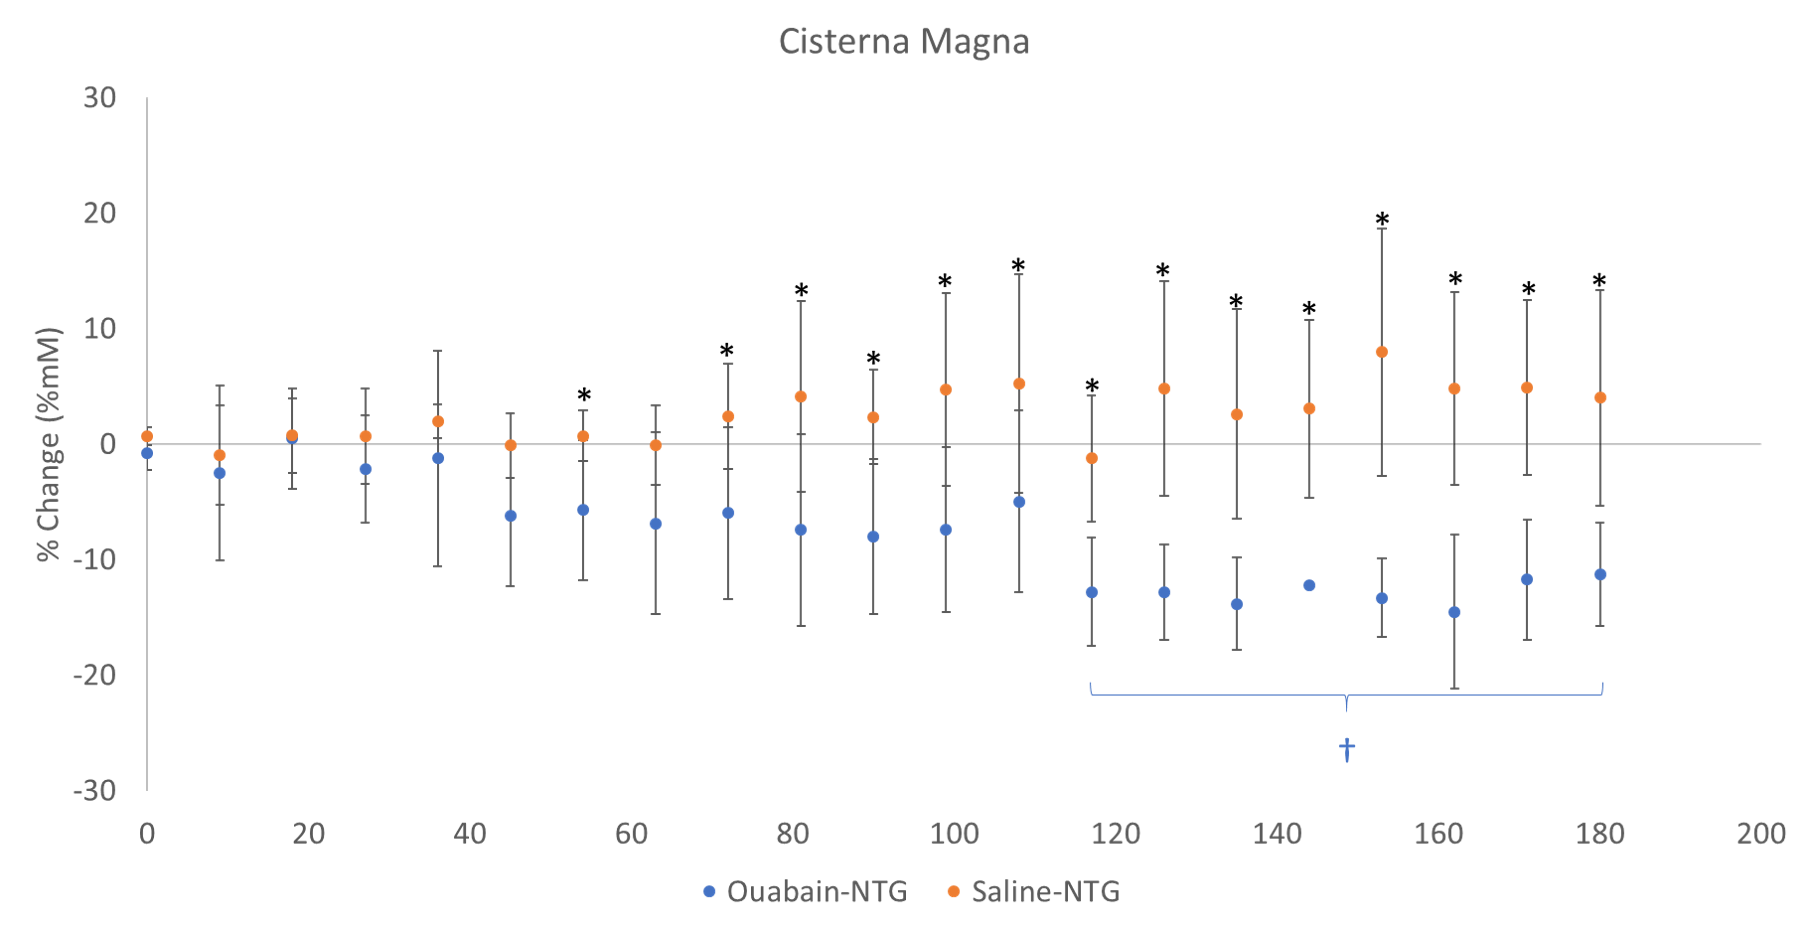
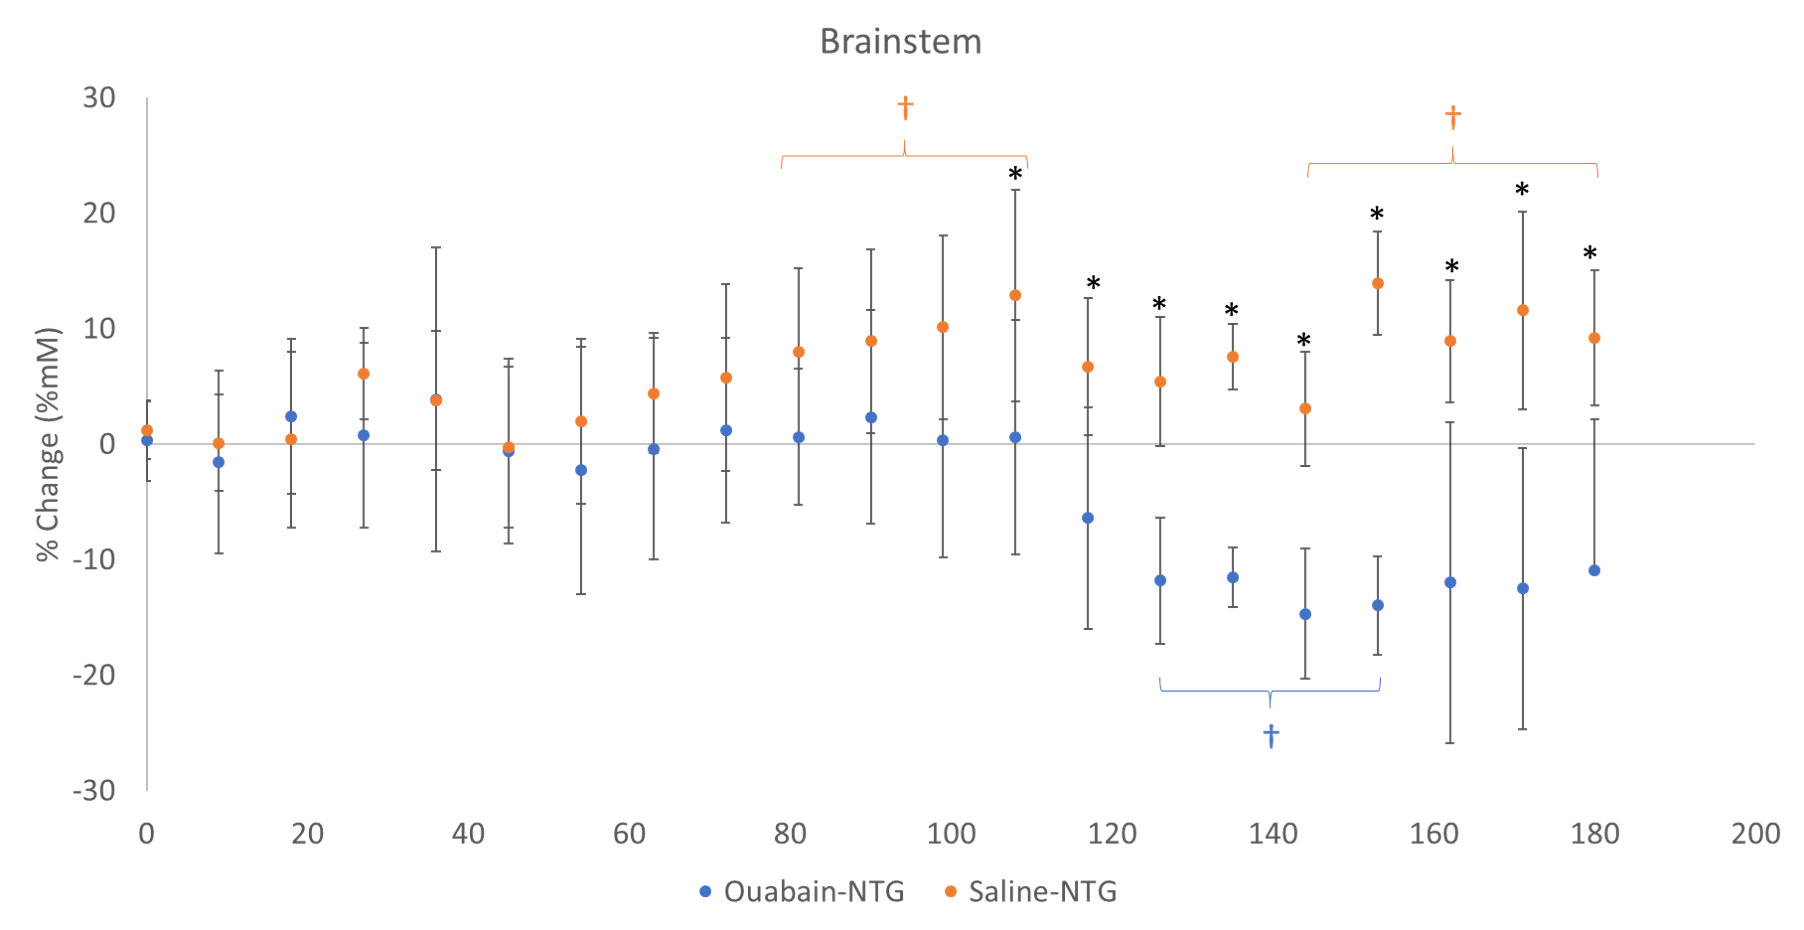
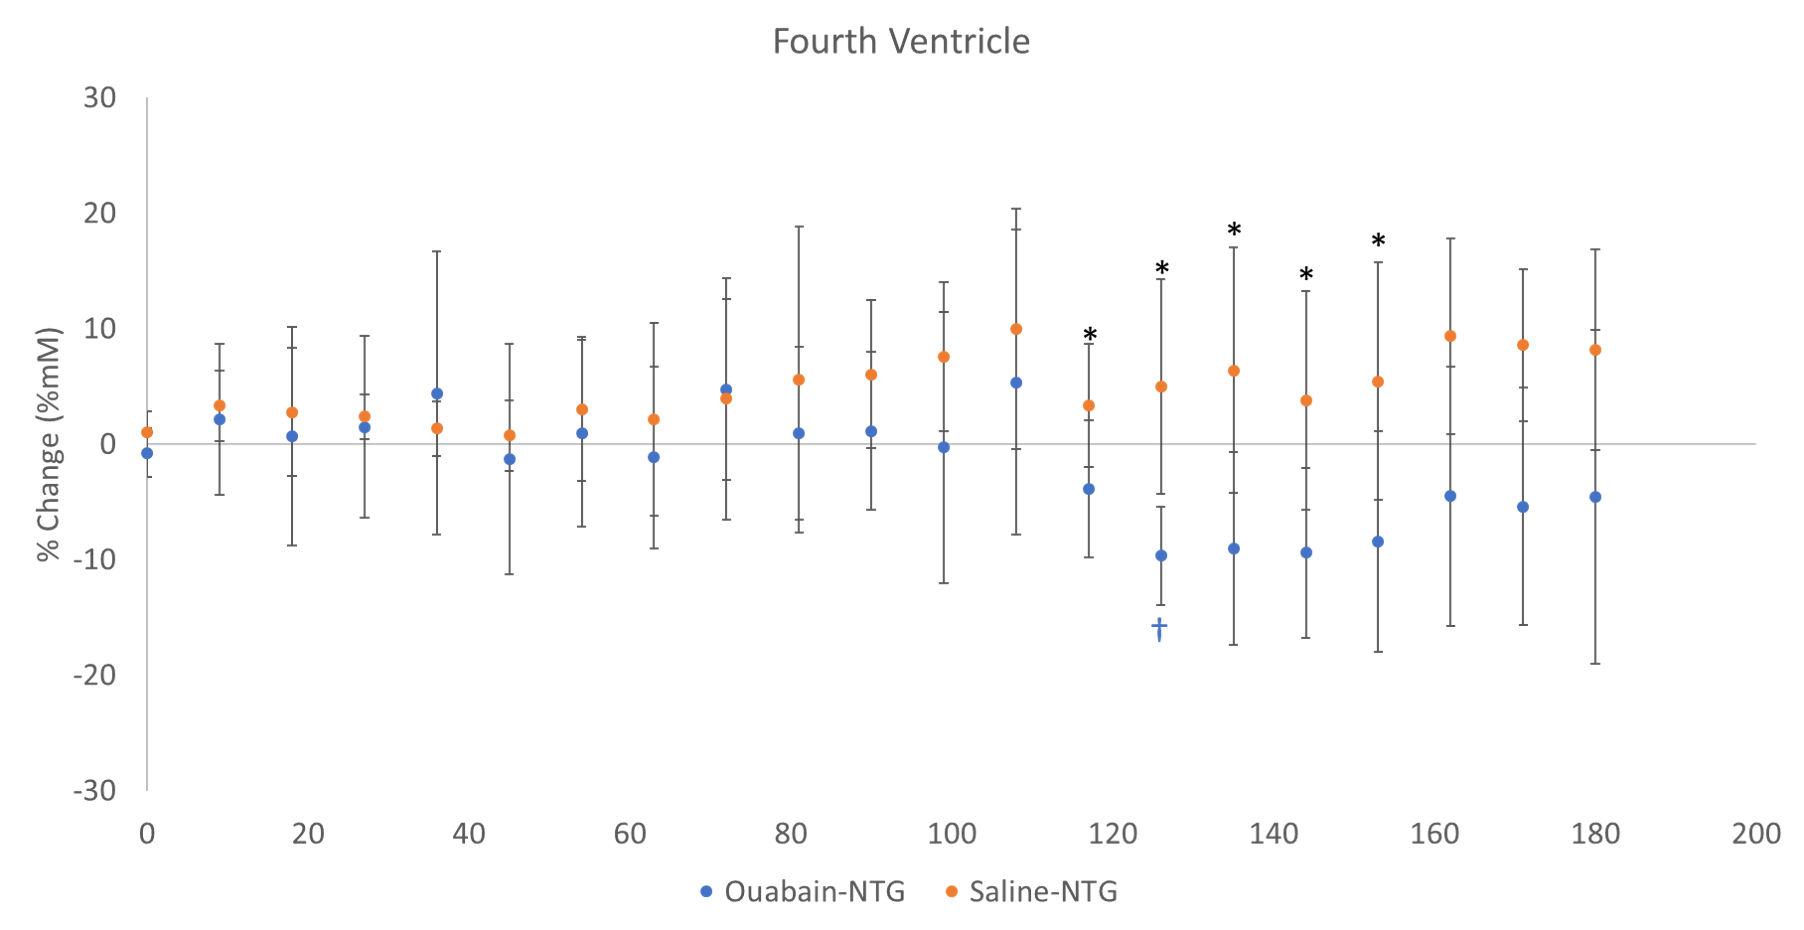
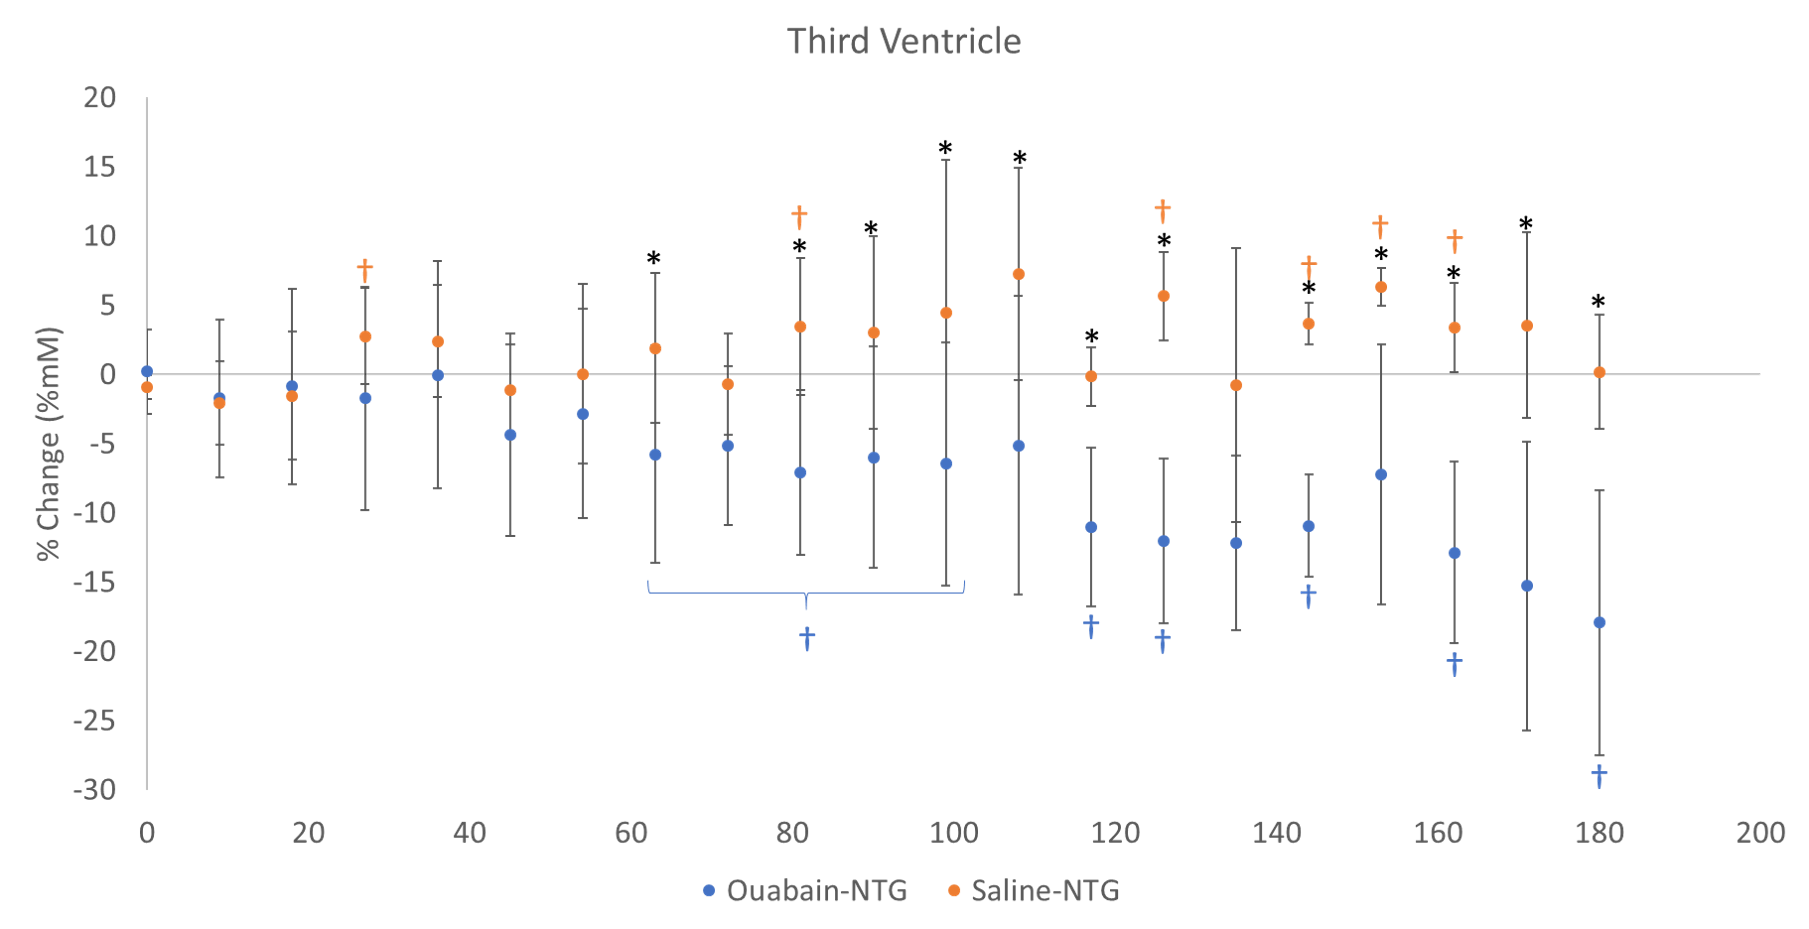
Data Analysis: 2D CSI datasets were zero-filled to a 64 x 64 matrix to achieve an image resolution of 0.5 x 0.5 x 2 mm (Figure 1). Images were segmented manually with ROIs corresponding to the aforementioned anatomy. Mean signal intensities in the ROIs were calibrated to phantom measurements to estimated total tissue sodium concentration, and are presented as percent change from baseline concentrations (Figure 2-5)
Results
As hypothesized, the ouabain cohort demonstrated stable or decreasing sodium fluxes in line with the expected inhibition (Figure 2-5). Without ouabain inhibition of Na,K-ATPase, sustained significant increases in 23Na signal after administration of NTG, are evident in the cisterna magna, (Figure 2), brainstem (Figure 3) and third ventricle (Figure 5), demonstrating reproducibility of previously published results [1]. The fourth ventricle shows increasing trends and delayed significance for the saline-NTG cohort, with stability evident for the ouabain group (Figure 4).Discussion
These dynamic changes in sodium concentration for the migraine analogue compared to the Na,K-ATPase-inhibited (ouabain) cohort indicate that sodium fluxes related to central sensitization are dependent on Na,K-ATPase activity in specific neuroanatomical regions. Given the CSF and brainstem-based alterations, both with and without inhibition, the time course of sodium changes links the involvement of the ventricular system as either a primary source or conduit for ionic imbalances. The kinetic characteristics of different Na,K-ATPase functional groups and isomers has been reported to be different in the choroid plexi associated with the three ventricles [5], and interestingly, the differential impacts of ouabain and NTG on the ventricular system potentially reflect these distinct Na,K-ATPase properties.
Time-dependent fluctuations provide insights into the dysregulation of migraine, and further study of modulation of sodium fluxes with conventional and alternative treatment modalities could help explain the dynamic features of migraine and inform efforts to correct the associated sodium imbalance.
Conclusions
The current study presents novel insights regarding longitudinal changes in intracellular brain [Na+] in an in vivo acute rodent model with and without Na,K-ATPase inhibition. Acute sodium increases—and decreases with ouabain inhibition of Na,K-ATPase —precede behavioral changes in support of the theory of sodium flux as causative to the onset and progression of central sensitization.Acknowledgements
This work was supported by the NIH (R01-NS072497 and RO1-NS102395) and User Collaborations Grant Program (to SCG) from the National High Magnetic Field Laboratory, which is funded by the NSF (DMR-1644779) and the State of Florida.References
[1] Abad N, Rosenberg JT, Hike DC, Harrington MG, Grant SC. Dynamic sodium imaging at ultra-high field reveals progression in a preclinical migraine model. Pain 2018;159:2058-2065.
[2] Harrington M, Fonteh A, Cowan R, Perrine K, Pogoda J, Biringer R, Huhmer A. Cerebrospinal fluid sodium increases in migraine. Headache 2006;46:1128-1135.
[3] Harrington MG, Chekmenev EY, Schepkin V, Fonteh AN, Arakaki X. Sodium MRI in a rat migraine model and a NEURON simulation study support a role for sodium in migraine. Cephalalgia 2011;31:1254-1265.
[4] Harrington MG, Fonteh AN, Arakaki X, Cowan RP, Ecke LE, Foster H, Huehmer AF, Biringer RG. Capillary Endothelial Na plus , K plus , ATPase Transporter Homeostasis and a New Theory for Migraine Pathophysiology. Headache 2010;50:459-478.
[5] Kudo K, Harada T, Kameda H, Uwano I, Yamashita F, Higuchi S, Yoshioka K, Sasaki M. Indirect Proton MR Imaging and Kinetic Analysis of (17)O-Labeled Water Tracer in the Brain. Magn Reson Med Sci 2018;17:223-230.
Figures