2516
Comparison of Relaxometry-Weighted Sodium MRI and IDH Status in Cerebral Gliomas1Forschungszentrum Juelich, INM-11, Juelich, Germany, 2Forschungszentrum Juelich, INM-4, Juelich, Germany, 3JARA - BRAIN - Translational Medicine, Aachen, Germany, 4Department of Nuclear Medicine, RWTH Aachen University, Aachen, Germany, 5Department of Neurology, RWTH Aachen University, Aachen, Germany
Synopsis
Patients with cerebral gliomas were investigated using an enhanced SISTINA sequence to estimate sodium relaxation and its correlation to the IDH mutational status. Sodium MRI is used for the indirect assessment of sodium relaxation parameters through the relative change at two echo times in
INTRODUCTION
Sodium imaging is a non-invasive imaging modality, which can deliver information about in vivo metabolism in disease as an adjunct to conventional diagnostics. The gene mutation encoding for the isocitrate dehydrogenase enzyme (IDH) is of growing importance for treatment strategy1. Patients, that show a positive IDH mutation status, have an improved outcome compared to the patients with IDH wildtype gliomas. In this pilot study, the relationship between relaxation-weighted sodium MRI in patients with cerebral gliomas in relation to the mutational status of the IDH was explored. The aim was to demonstrate how the enhanced SISTINA sequence2 can be used to assess tissue sodium relaxation and investigate possible correlations between IDH status and relaxation abnormalities.METHODS
Ten patients suffering from untreated cerebral gliomas were investigated using proton sequences and sodium MRI to estimate the relative relaxation properties of total(NaT), weighted restricted(NaR), and weighted non-restricted(NaNR) sodium in tumours and normal brain tissue. The IDH mutational status was determined through biopsy or resection.
Proton and sodium images were acquired on a home-assembled 4T MRI scanner based around a Siemens console with a dual-tuned Na/H birdcage coil (Rapid Biomed, Germany) using the enhanced SISTINA sequence which consists of a triple quantum filter with an ultrashort echo time (UTE) readout after the first 90° pulse, and a Cartesian MGRE readout after the third 90° pulse2. UTE images give information on NaT, while MGREs are weighted due to the presence of NaR and NaNR, after application of an appropriate phase cycle3. Sequence parameters and echo spacing were the same as in Worthoff et al.2, with a measurement time of approximately 10min. The data were regridded to 2.5mm isotropic voxel size in the UTE images, while Cartesian images had a voxel size of 10mm isotropic.
Two ROIs were segmented manually using the normal proton images: the tumour area, which corresponds either to T1- or T2-signal abnormalities, and contralateral brain tissue (CL). The proton images were coregistered with the UTE and Cartesian sodium images, using the FSL library (FMRIB, Oxford, UK)5-7.
Signal amplitudes at the following echo times were used for the calculations: after the first RF pulse TEUTE,1=0.36ms, TEUTE,5=4.53ms, and after the third pulse TECART,1=7ms,TECART,5=52.8ms.
The following sodium parameters were estimated:ΔNaT(TE)=NaT(TEUTE,5)/NaT(TEUTE,1) for total sodium change,ΔNaNR(TE)=NaNR(TECART,5)/NaNR(TECART,1) reflecting non-restricted sodium change,ΔNaR(TE)=NaR(TECART,5)/NaR(TECART,1) reflecting restricted sodium change. These values reflect the decrease in signal in the chosen ROI during the measurement.
Relaxation behaviour and the signal amplitude of the tumour tissue were compared to that in CL and provided for all patients as well as for IDH mutated and IDH wildtype groups. To compare sodium MRI parameters in patients with and without IDH mutation, the F-test and the Student t-test for independent samples were used. The threshold for the significant difference for the p-value due to a low sample size was assumed 0.07. Statistical analysis was performed using the R software4.
RESULTS
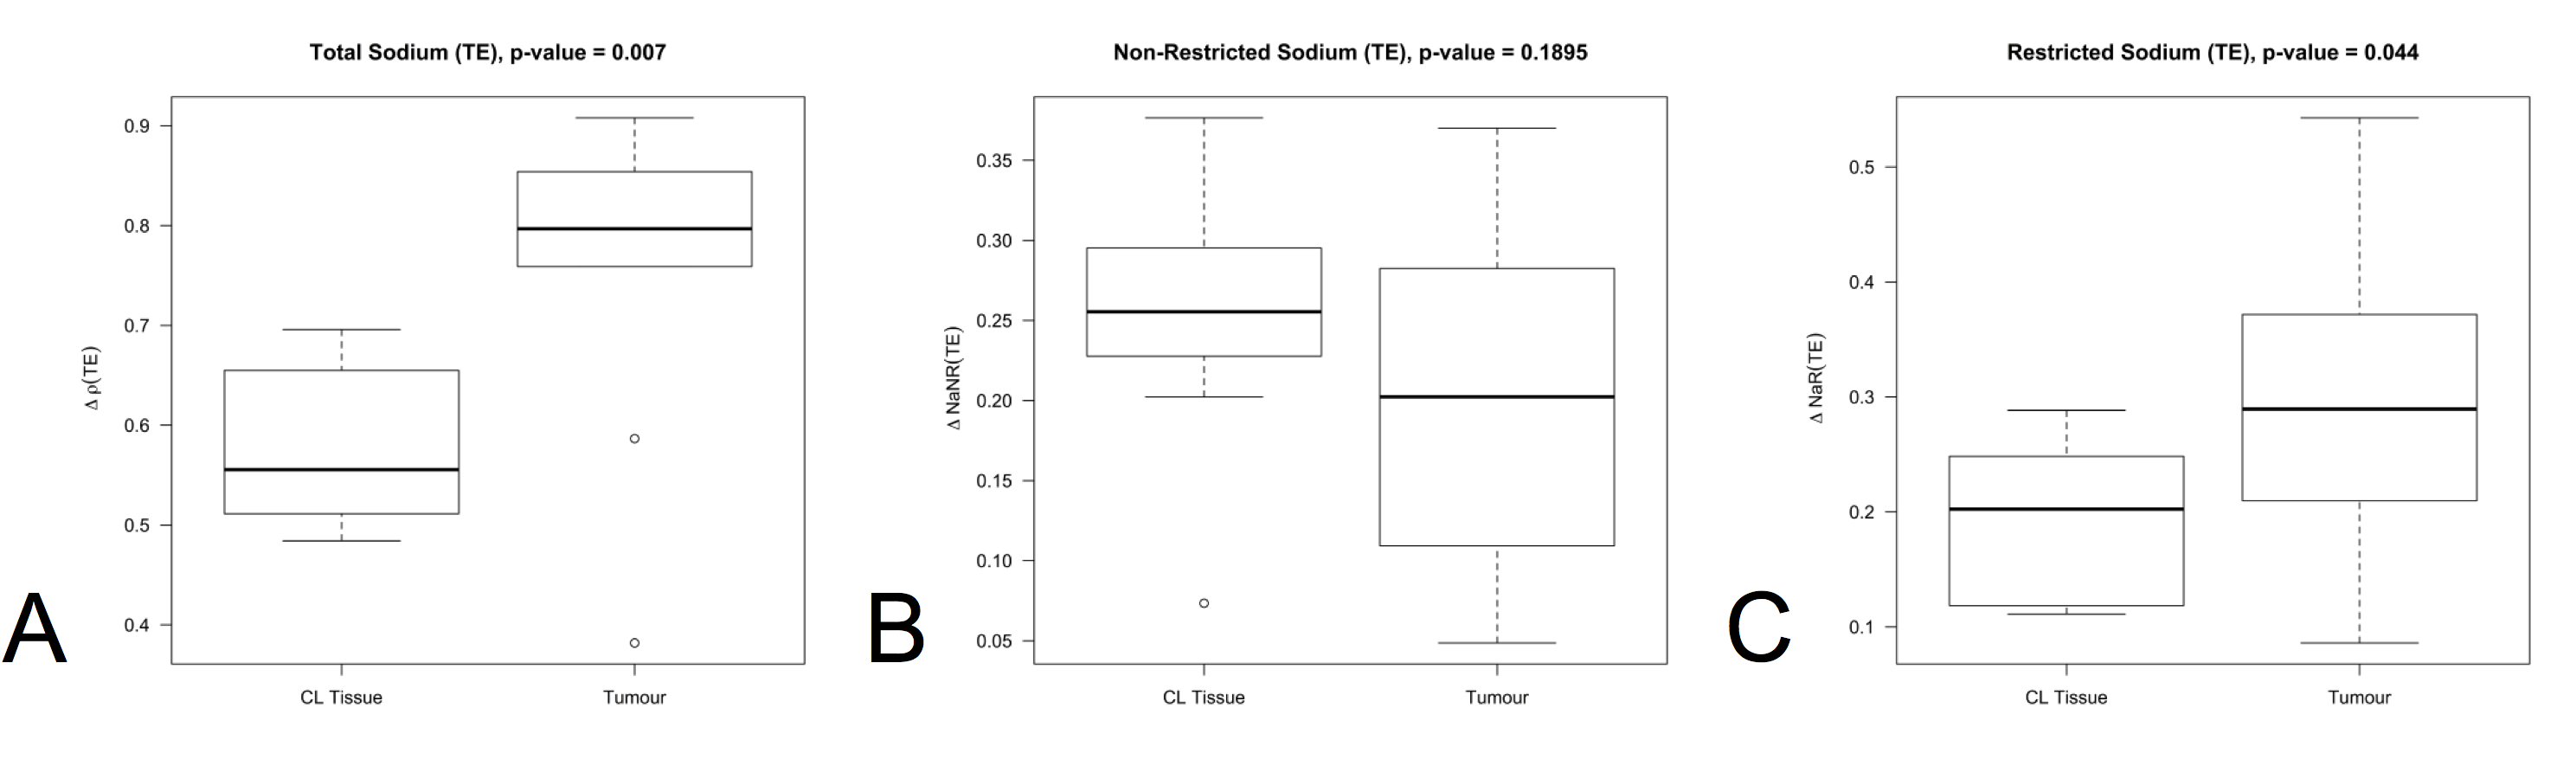
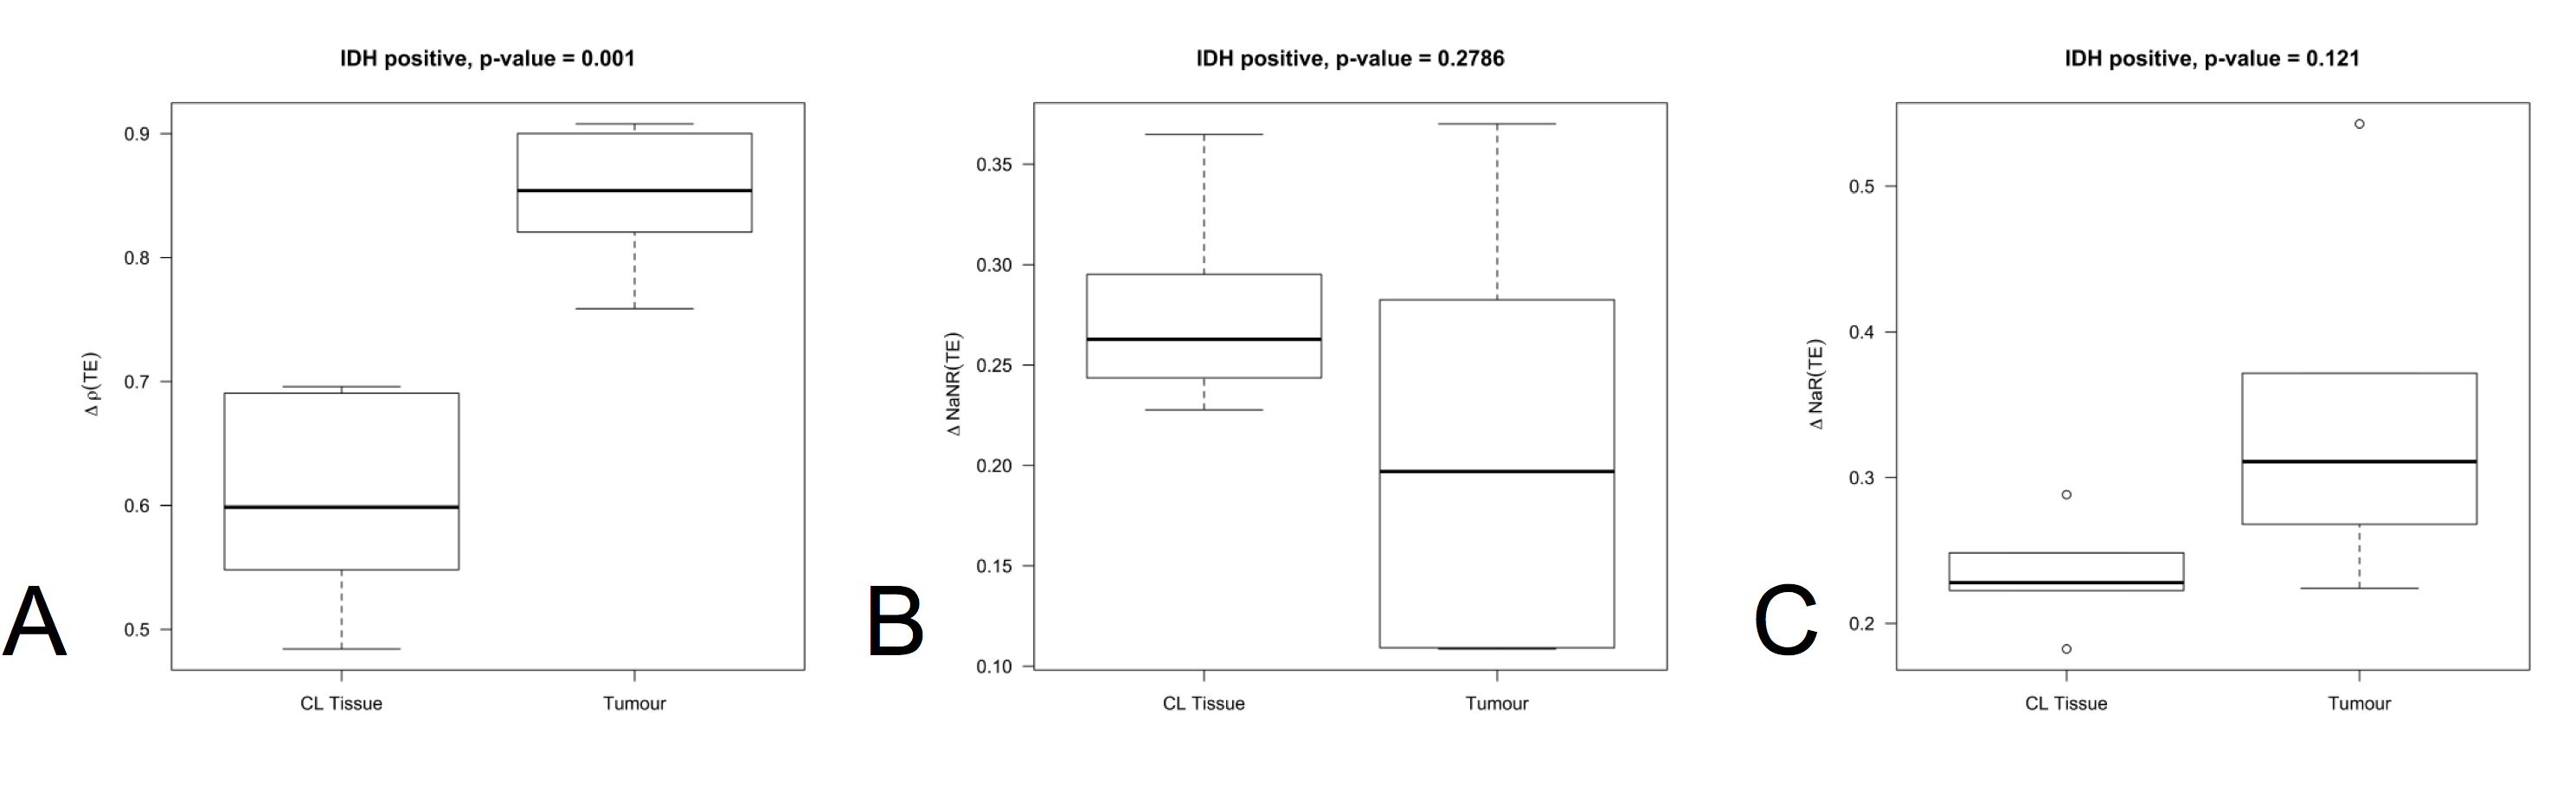
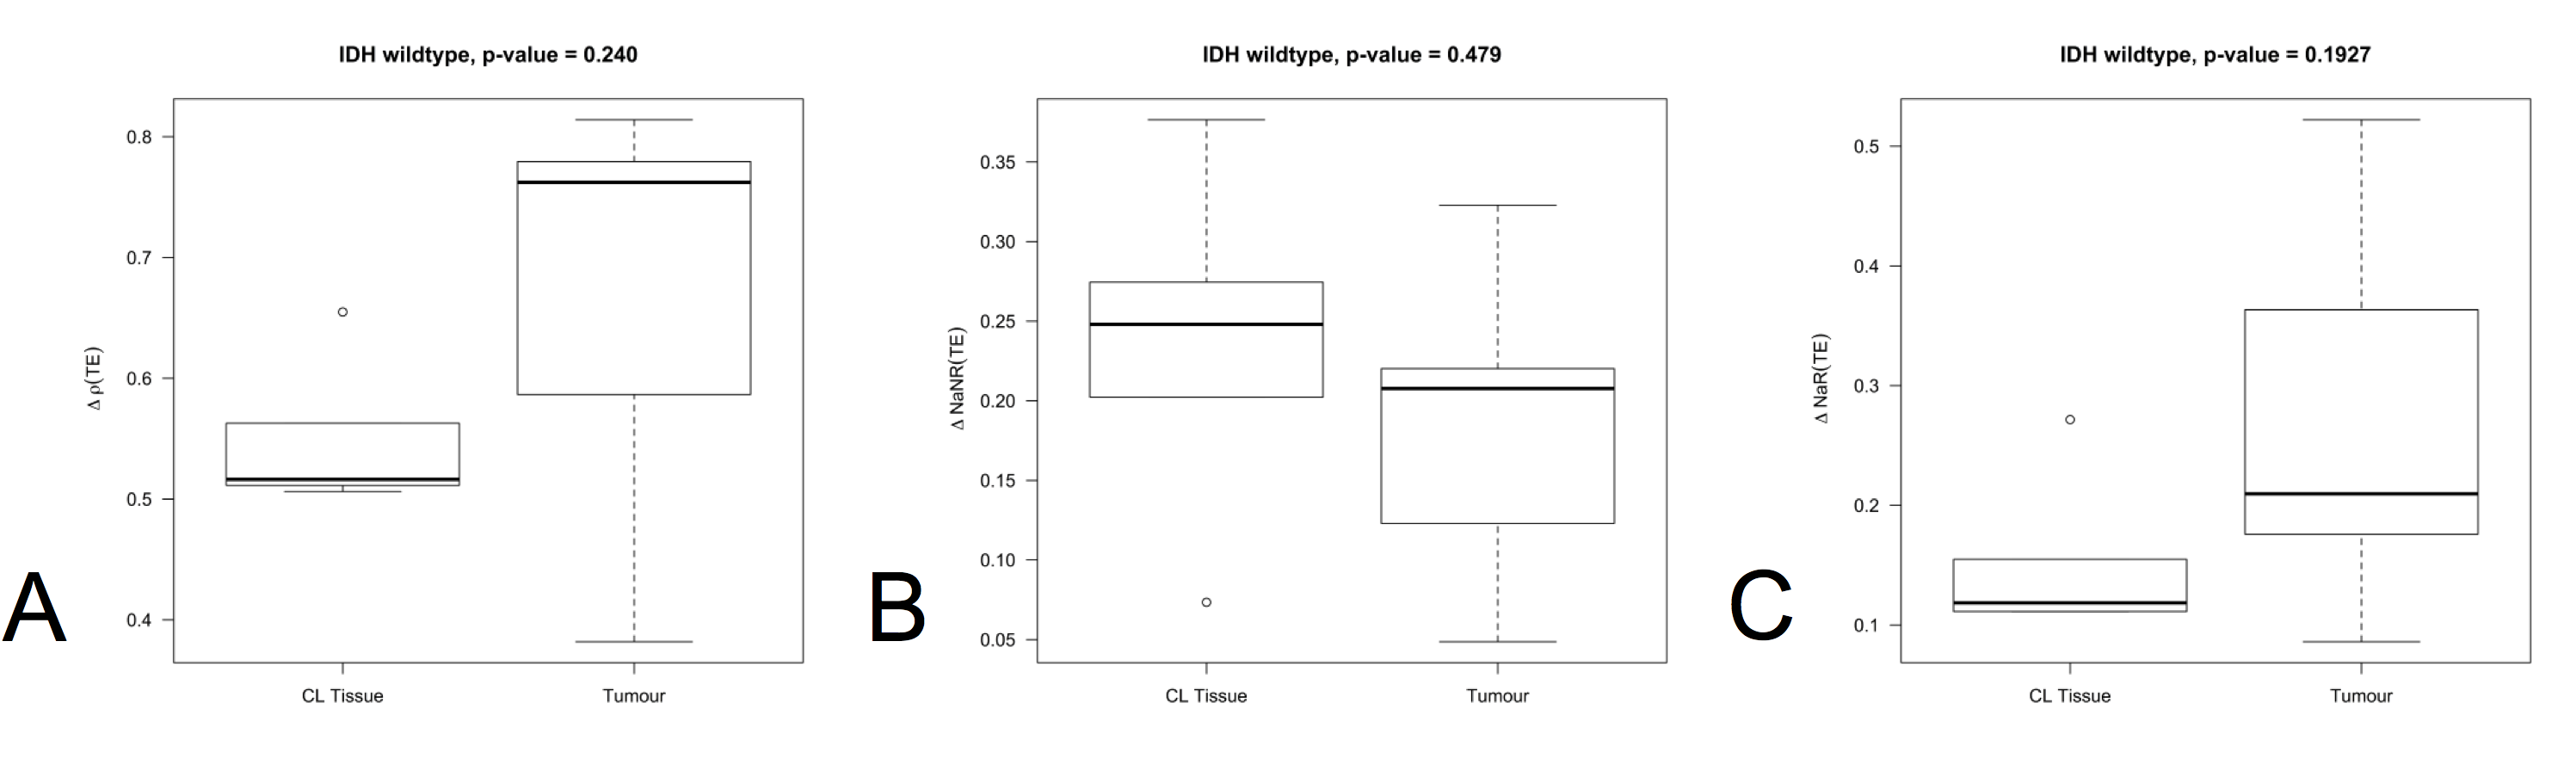
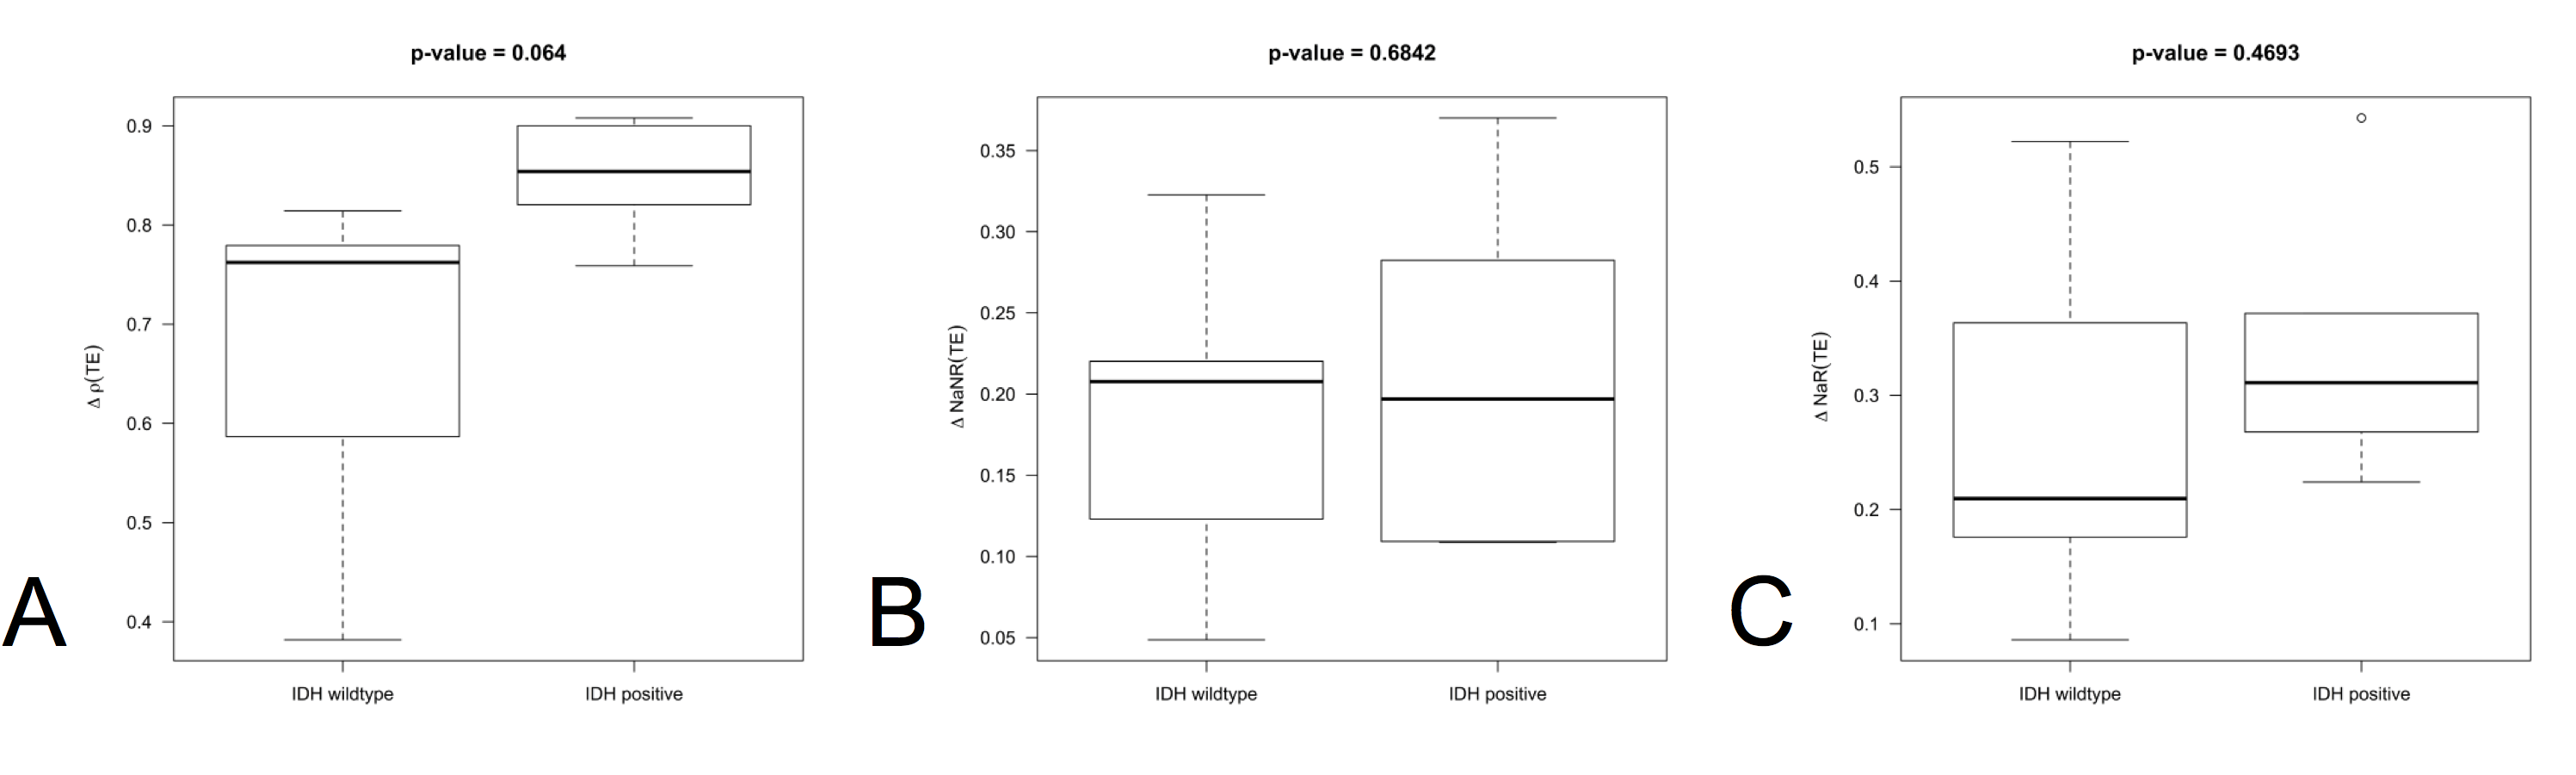
The patient cohort showed significant differences in relaxation behaviour and magnitude of ΔNaT(p=0.007) and ΔNaR(p=0.044) compared to contralateral tissue (Fig.1A,Fig.1C). ΔNaNR(p=0.190) does not show significant differences (Fig.1B). The group of patients (n=5) with IDH mutation showed significant differences in relaxation behaviour and magnitude of ΔNaT(p=0.001)(Fig.2A). However, no significant differences in ΔNaNR(p=0.279) and ΔNaR(p=0.121)(Fig.2B,Fig.2C) were observed. Furthermore, the patients with IDH wildtype gliomas (n=5) showed no significant differences in ΔNaT(p=0.240), ΔNaNR(p=0.479) and ΔNaR(p=0.193)(Fig.3A,Fig.3B,Fig.3C). The both groups, separated based on the IDH mutation status, were compared and significant differences were observed in ΔNaT(p=0.064)(Fig.4A), while ΔNaNR(p=0.684) and ΔNaR(p=0.469) showed no significant differences (Fig.4B,Fig.4C).DISCUSSION
There is a significant difference in UTE signal relaxation in tumour compared to the healthy contralateral tissue, especially in patients with IDH mutation. These results might lead to the conclusion that signal amplitude comparison performed on the short timescale is more sensitive to tissue viability. This is supported by the significant difference in NaR in tumours compared to healthy tissue. Differences in the amplitude such as increased DNaT in IDH positive tumours might be attributed to the redistribution in sodium between restricted and unrestricted compartments, or changes in the relaxation time. IDH wildtype tumours did not show any significant changes compared to the healthy tissue in sodium relaxation characteristics, leading to the observed significant difference in total sodium behaviour on the short timescale between patients with different IDH status. An absence of significant difference in NaR between two patient groups might be due to small sample size.CONCLUSION
Relaxation weighted total sodium MRI parameters acquired on the short time scale appear to be related to the IDH mutational status. A further evaluation of the combination of the two methods in gliomas seems promising.Acknowledgements
No acknowledgement found.References
(1) Louis DN, Perry A, Reifenberger G, von Deimling A, Figarella-Branger D, Cavenee WK, et al. The 2016 World Health Organization Classification of Tumors of the Central Nervous System: a summary. Acta neuropathologica. 2016;131:803-20. doi:10.1007/s00401-016-1545-1.
(2) Worthoff WA, Shymanskaya A, Shah NJ. Relaxometry and quantification in simultaneously acquired single and triple quantum filtered sodium MRI. Magn Reson Med. 2018;00:1-13. doi:10.1002/mrm.27387.
(3) Ivchenko N, Hughes CE, Levitt MH. Multiplex phase cycling. J Magn Reson. 2003;160:52-58.
(4) R Core Team (2014). R: A language and environment for statistical computing. R Foundation for Statistical Computing, Vienna, Austria. URL http://www.R-project.org/.
(5) Woolrich MW, Jbabdi S, Patenaude B, Chappell M, Makni S, Behrens T, et al. Bayesian analysis of neuroimaging data in FSL. NeuroImage. 2009;45:S173-86. doi:10.1016/j.neuroimage.2008.10.055.
(6) Smith SM, Jenkinson M, Woolrich MW, Beckmann CF, Behrens TE, Johansen-Berg H, et al. Advances in functional and structural MR image analysis and implementation as FSL. NeuroImage. 2004;23 Suppl 1:S208-19. doi:10.1016/j.neuroimage.2004.07.051.
(7) Jenkinson M, Beckmann CF, Behrens TE, Woolrich MW, Smith SM. Fsl. NeuroImage. 2012;62:782-90. doi:10.1016/j.neuroimage.2011.09.015.
Figures