2514
Optimizing Compressed Sensing for quantitative Sodium MRI of the human brain1Biomedical Engineering, University of Melbourne, Parkville, Australia, 2Melbourne Brain Centre Imaging Unit, University of Melbourne, Parkville, Australia, 3Medicine & Radiology, University of Melbourne, Parkville, Australia
Synopsis
The clinical application of Sodium MRI is hampered due to relatively low image quality and associated long acquisition times (TA). Compressed Sensing (CS) aims at a reduction of TA, but has been found to encompass quantitative estimation bias when used in low SNR x-Nuclei imaging. This work analyses CS in human brain Sodium MRI from both angles, acquisition speed-up and quantification, and presents an optimized setup allowing an up to four-fold TA reduction with recommendations for quantitative assessments. The demonstrated global optima of CS weighting parameters and achievable reduction in TA greatly support the transition of Sodium MRI into clinical routine.
Introduction
The clinical application of Sodium MRI is hampered due to relatively low image quality and associated long acquisition times (TA). Compressed Sensing (CS)1,2 aims at a reduction of TA, but has been found to encompass quantitative estimation bias when used in low SNR x-Nuclei imaging3,4. This work analyses CS in human brain Sodium MRI from both angles, acquisition speed-up and quantification, and presents an optimized setup allowing an up to four-fold TA reduction with recommendations for quantitative assessments.Methods
Imaging was performed on a research 7T MRI scanner (Siemens Healthcare, Erlangen, Germany) with a transmit/receive dual-tuned 1H-23Na head coil (QED, USA). Data was collected with a custom-built 3D-radial sequence. Five healthy volunteers were imaged with the following parameters: TR=160ms, TE=0.4ms, FA=90°, 10,000 projections, FOV=(20cm)3, TA=26min40s.
Image reconstruction was performed offline in Matlab onto an isotropic 3.1mm-grid. A standard NUFFT5-reconstruction of the full raw-data (Iref) was compared with randomly undersampled reconstructions (Iu) from NUFFT and CS. The employed CS optimization was
$$\hat{x}=\arg\min_x\|\mathcal{F}_u(x)-y\|_2^2+\lambda_1\|\Psi x\|_1+\lambda_2 \text{TV}(x)$$
where $$$\|\cdot\|_1$$$ and $$$\|\cdot\|_2$$$ denote the l1 and l2-norm, respectively, $$$\mathcal{F}_u$$$ is the undersampled NUFFT-operator, x is the reconstructed image, y the undersampled raw-data, Ψ the applied sparsity transform and λ1 and λ2 the weights on the transform sparsity and total variation (TV), respectively. Reconstructions were investigated for undersampling factors (USF) ranging from 2 to 10 with increments of 1 and across regularization weights, λ1 (sparsity domain) = [0,1.0] step size 0.1; λ2 (TV) = [0,0.0001,0.0005,0.001,0.005,0.01,0.05,0.1,0.5]. The employed sparsity domains Ψ were identity, i.e. the inherent image sparsity, Discrete CosineTransform (DCT) and Wavelet transform (WT).
Image reconstruction performance of each Iu was assessed by calculating the MSE, pSNR and sSim with respect to Iref.
Results
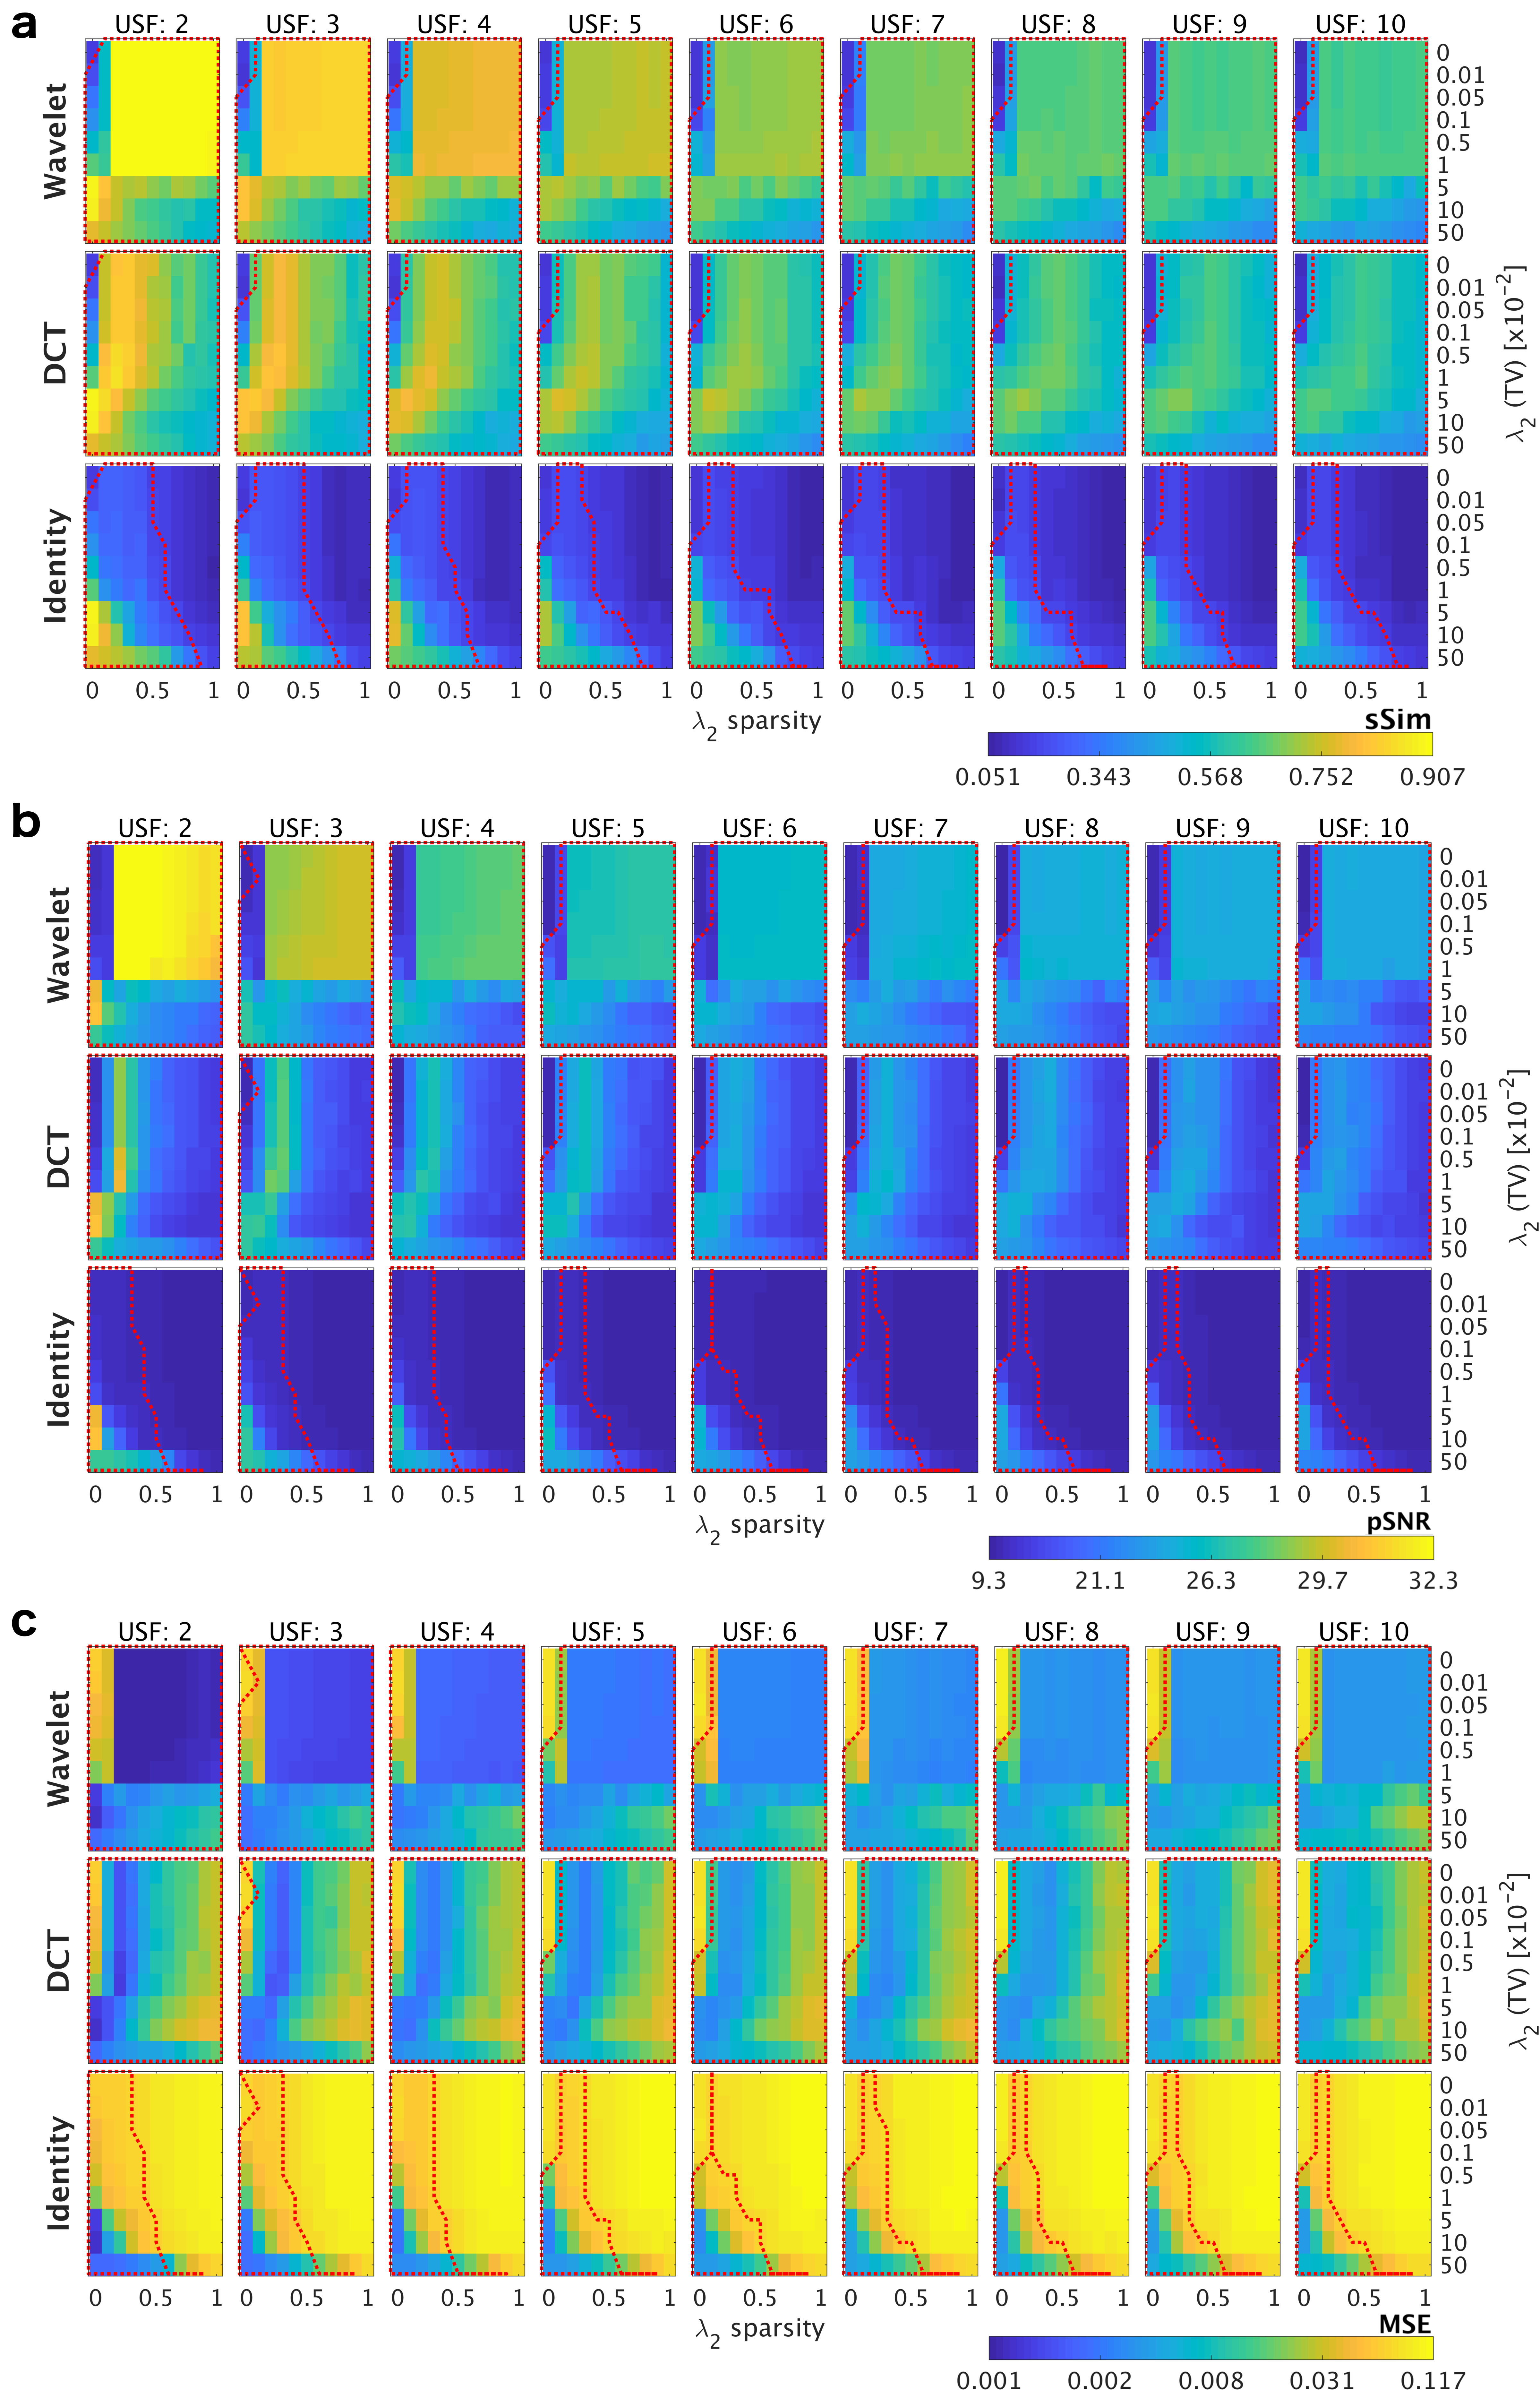
Figure 1 illustrates reconstruction performance of CS for all investigated regularization weights and USF; red line surrounds area where CS reconstruction achieves higher scores than NUFFT-based reconstruction at the same USF. DCT and WT clearly outperform image-sparsity based and standard NUFFT-reconstructions in all investigated quality measures. WT shows a robust performance over a wide range of parameters (moderate to high λ1, low to moderate λ2).
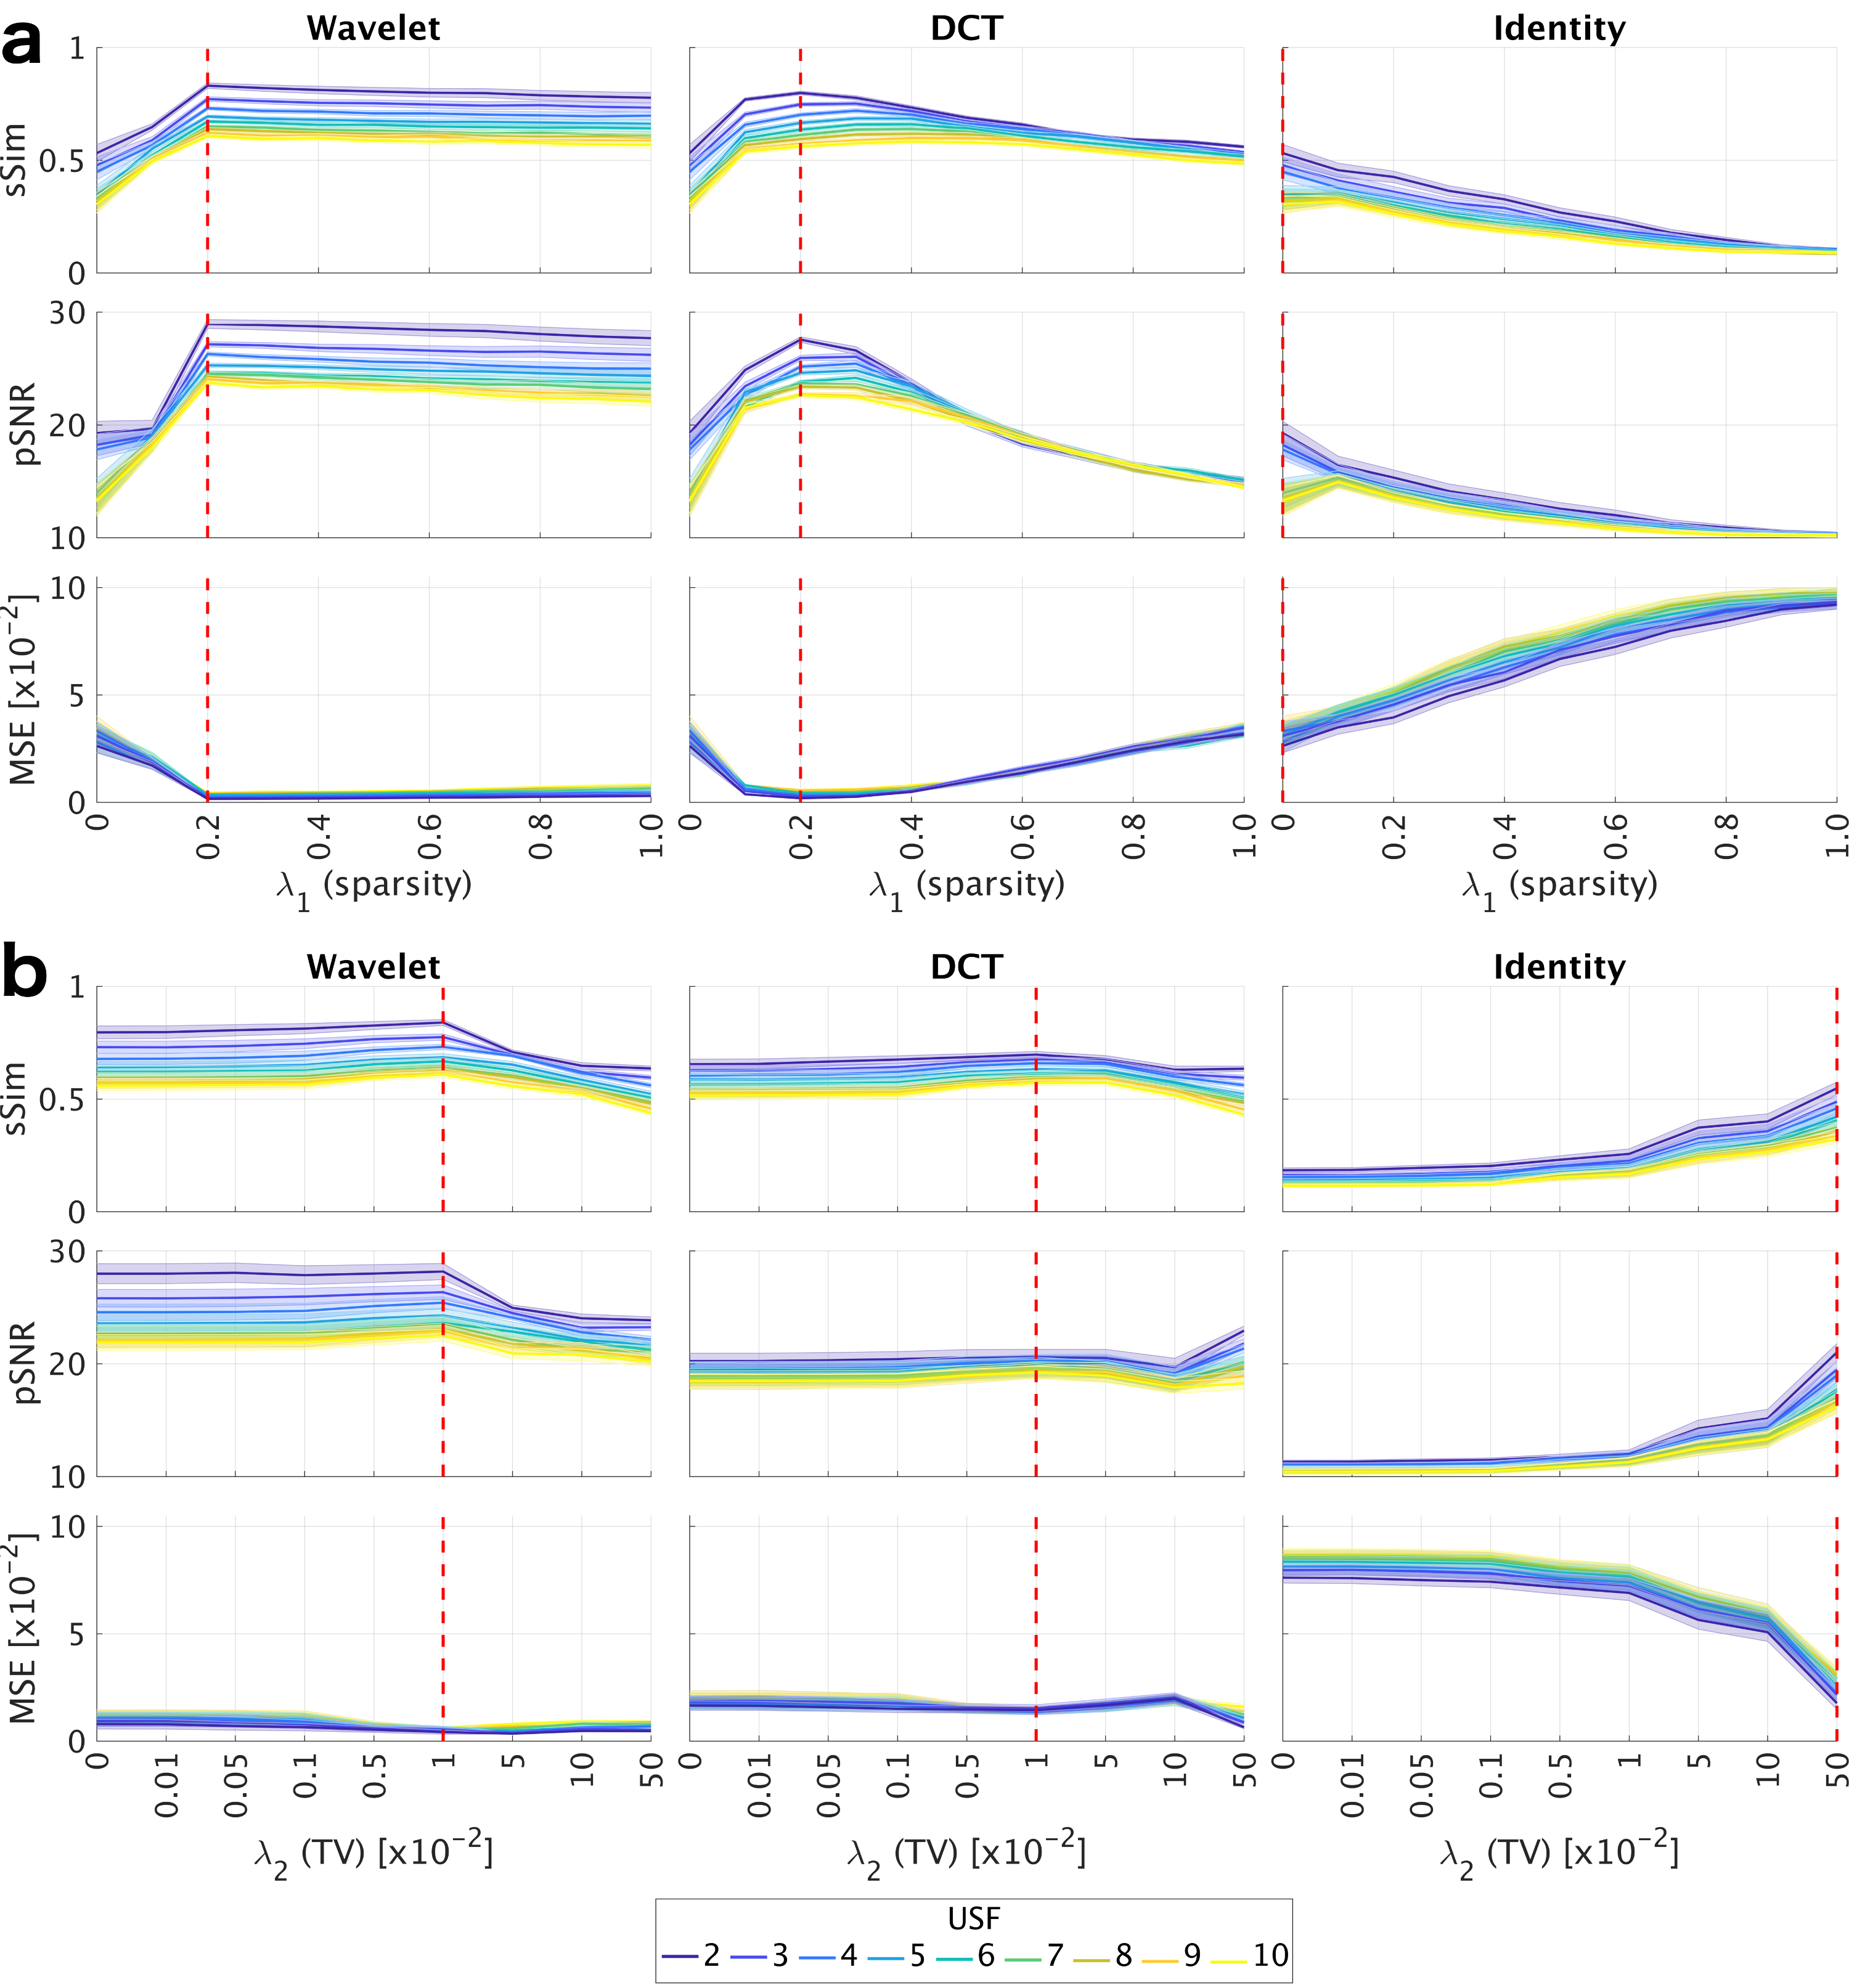
Figure 2 shows mean and standard errors of quality scores with regards to λ1 (Figure 2a) and λ2 (Figure 2b) across subjects for all USF. The curves re-emphasize the overall better performance of WT reconstructions. Vertical red lines indicate the joint optimum across all image quality measures at λ1=0.2 and λ2=0.01. sSim scores were found to show good agreement with visual assessments; MSE and pSNR show a bias towards higher TV weights where images were visually smoothed.
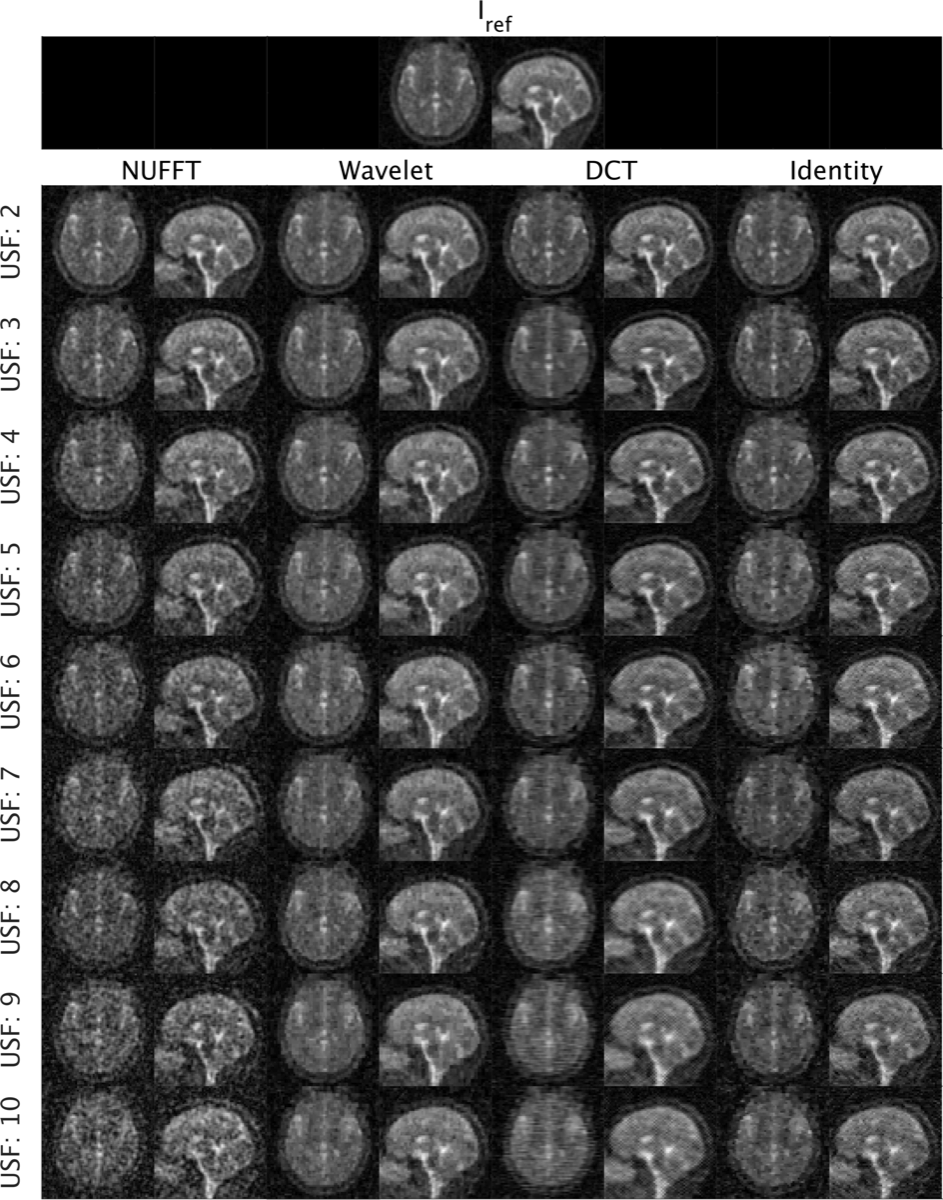
Figure 3 illustrates cross sections of Iref and Iu. CS reconstructions with highest sSim score are displayed. Up to an USF of 4, WT reconstructions show good structural detail.
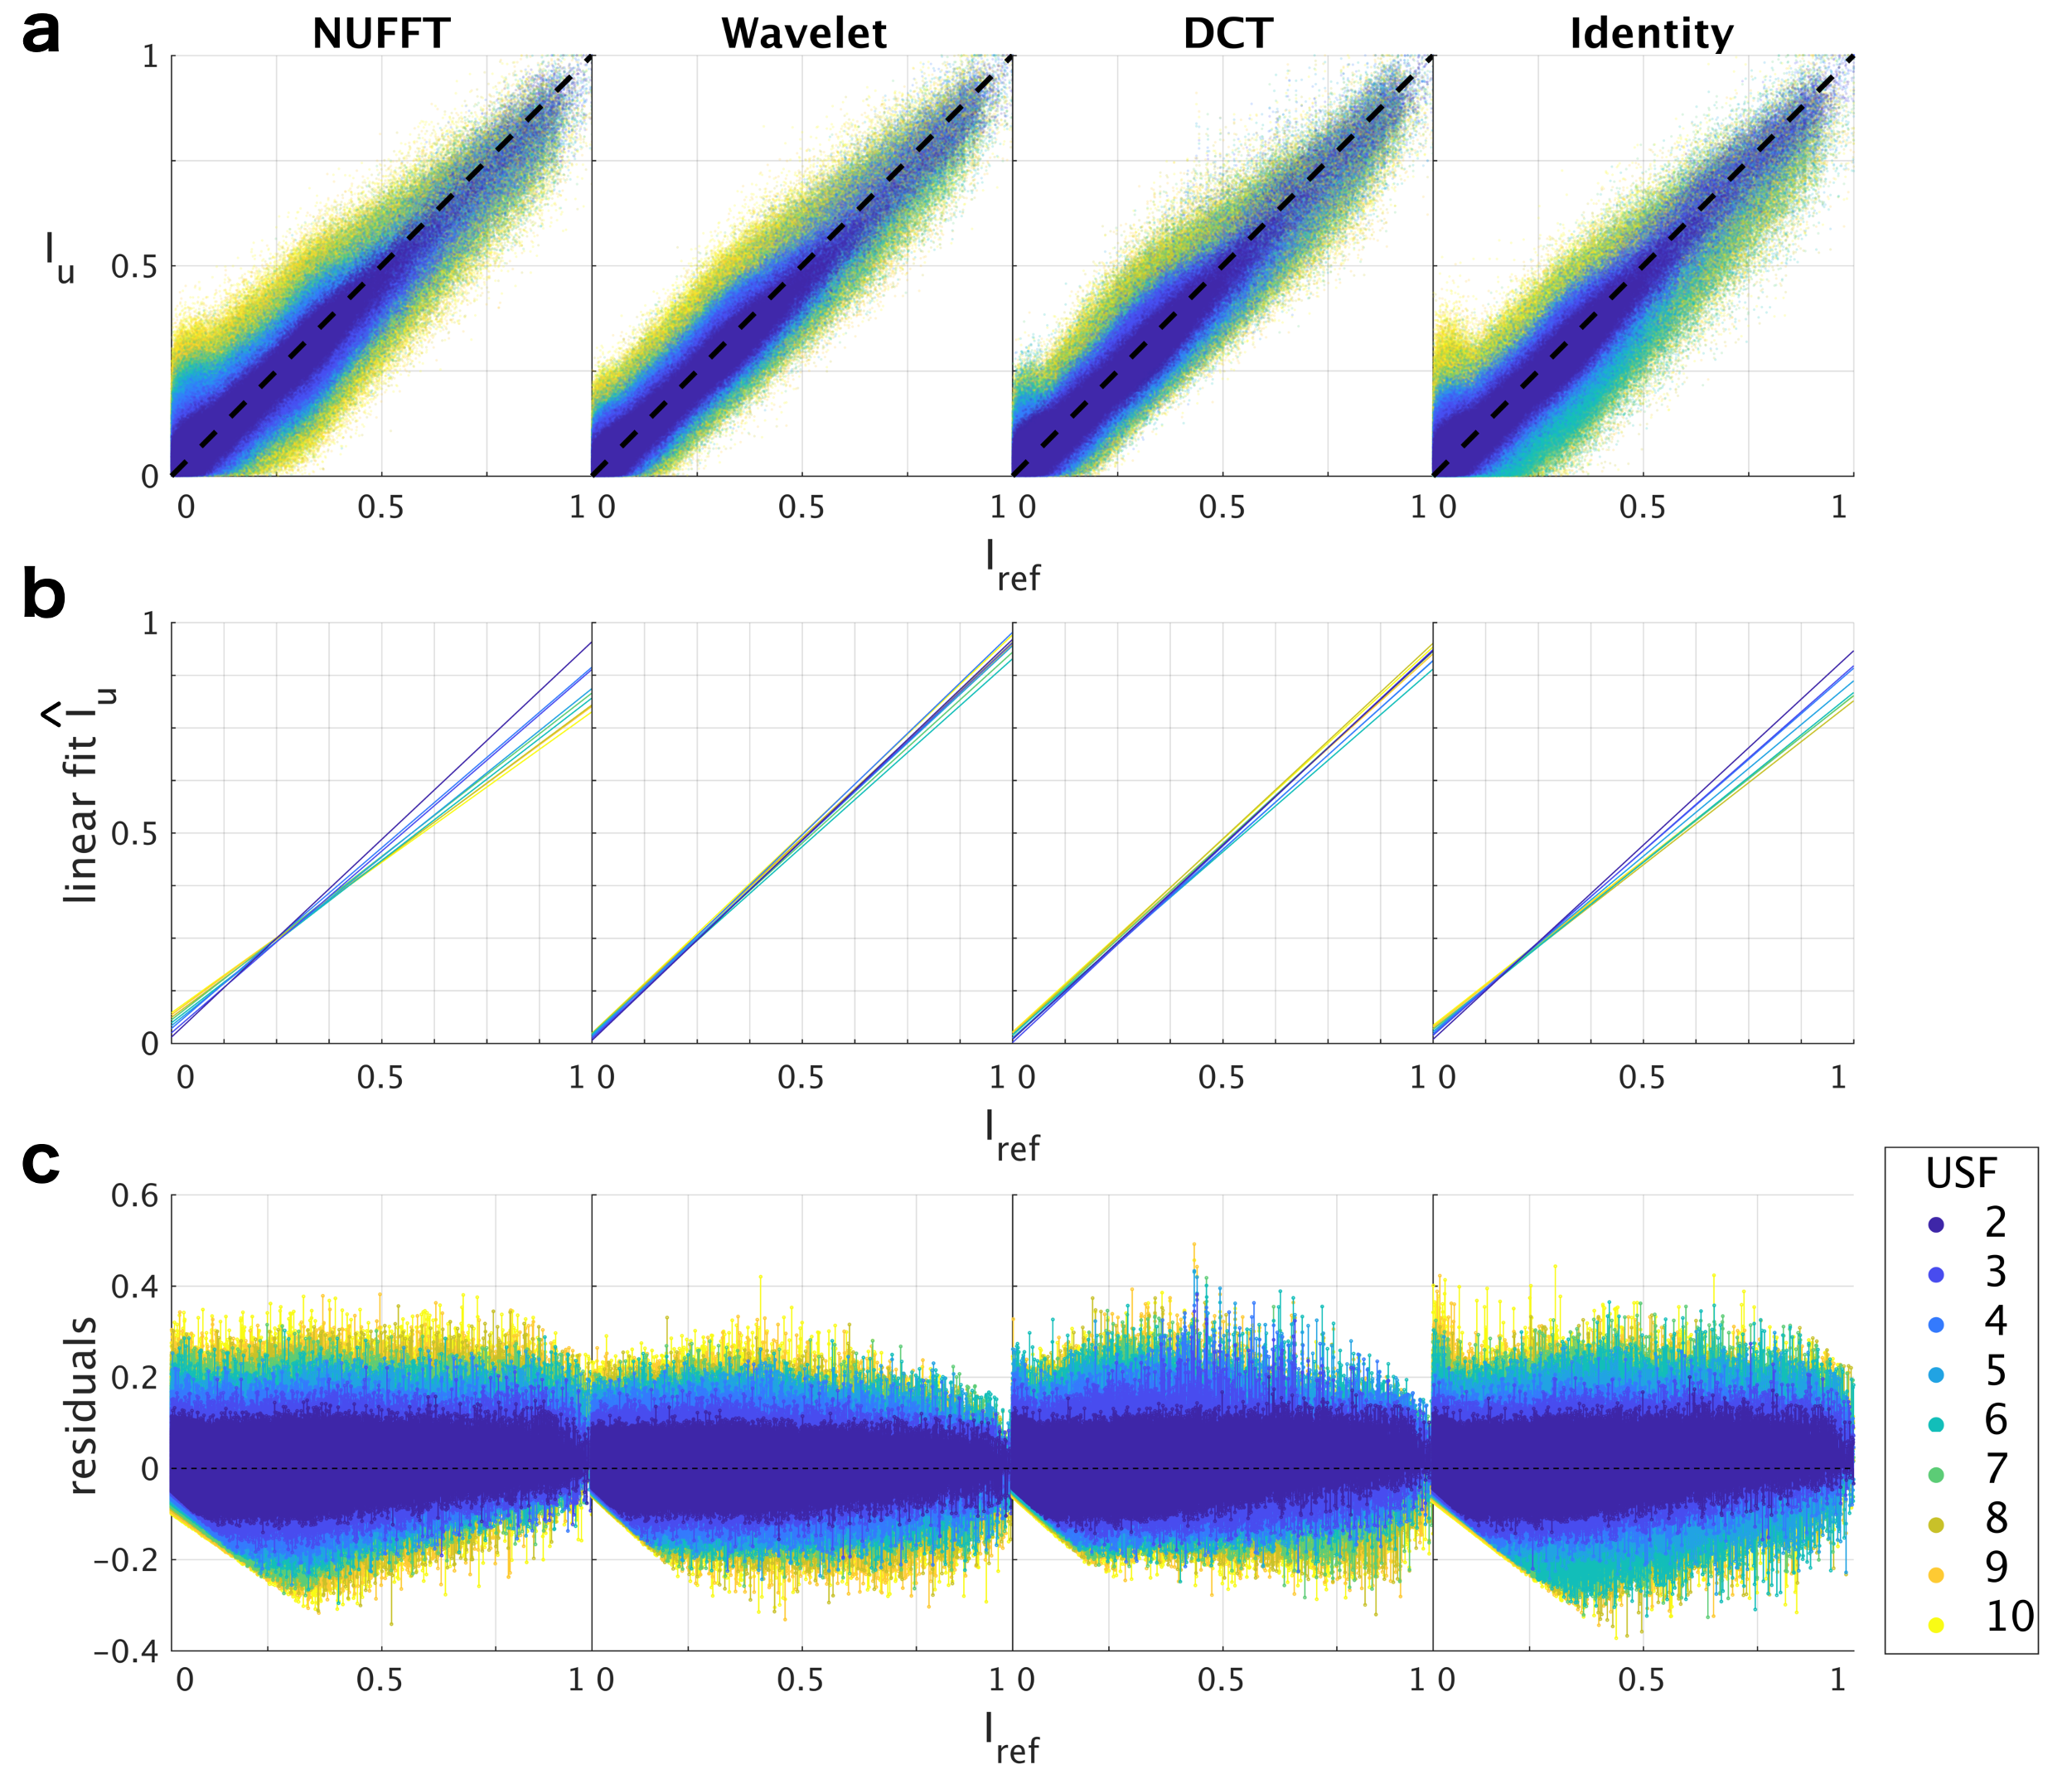
Figure 4 plots the correlation between Iref and Iu for all USF. Point clouds show some non-linear behavior, particularly for DCT and Identity-based CS reconstructions. Linear fits through point clouds (Figure 4b) show a decreasing slope manifested in an overall increase in noise and decrease in high image intensities. WT reconstruction fit residuals are distributed around zero highlighting the good linear correlation (Figure 4c).
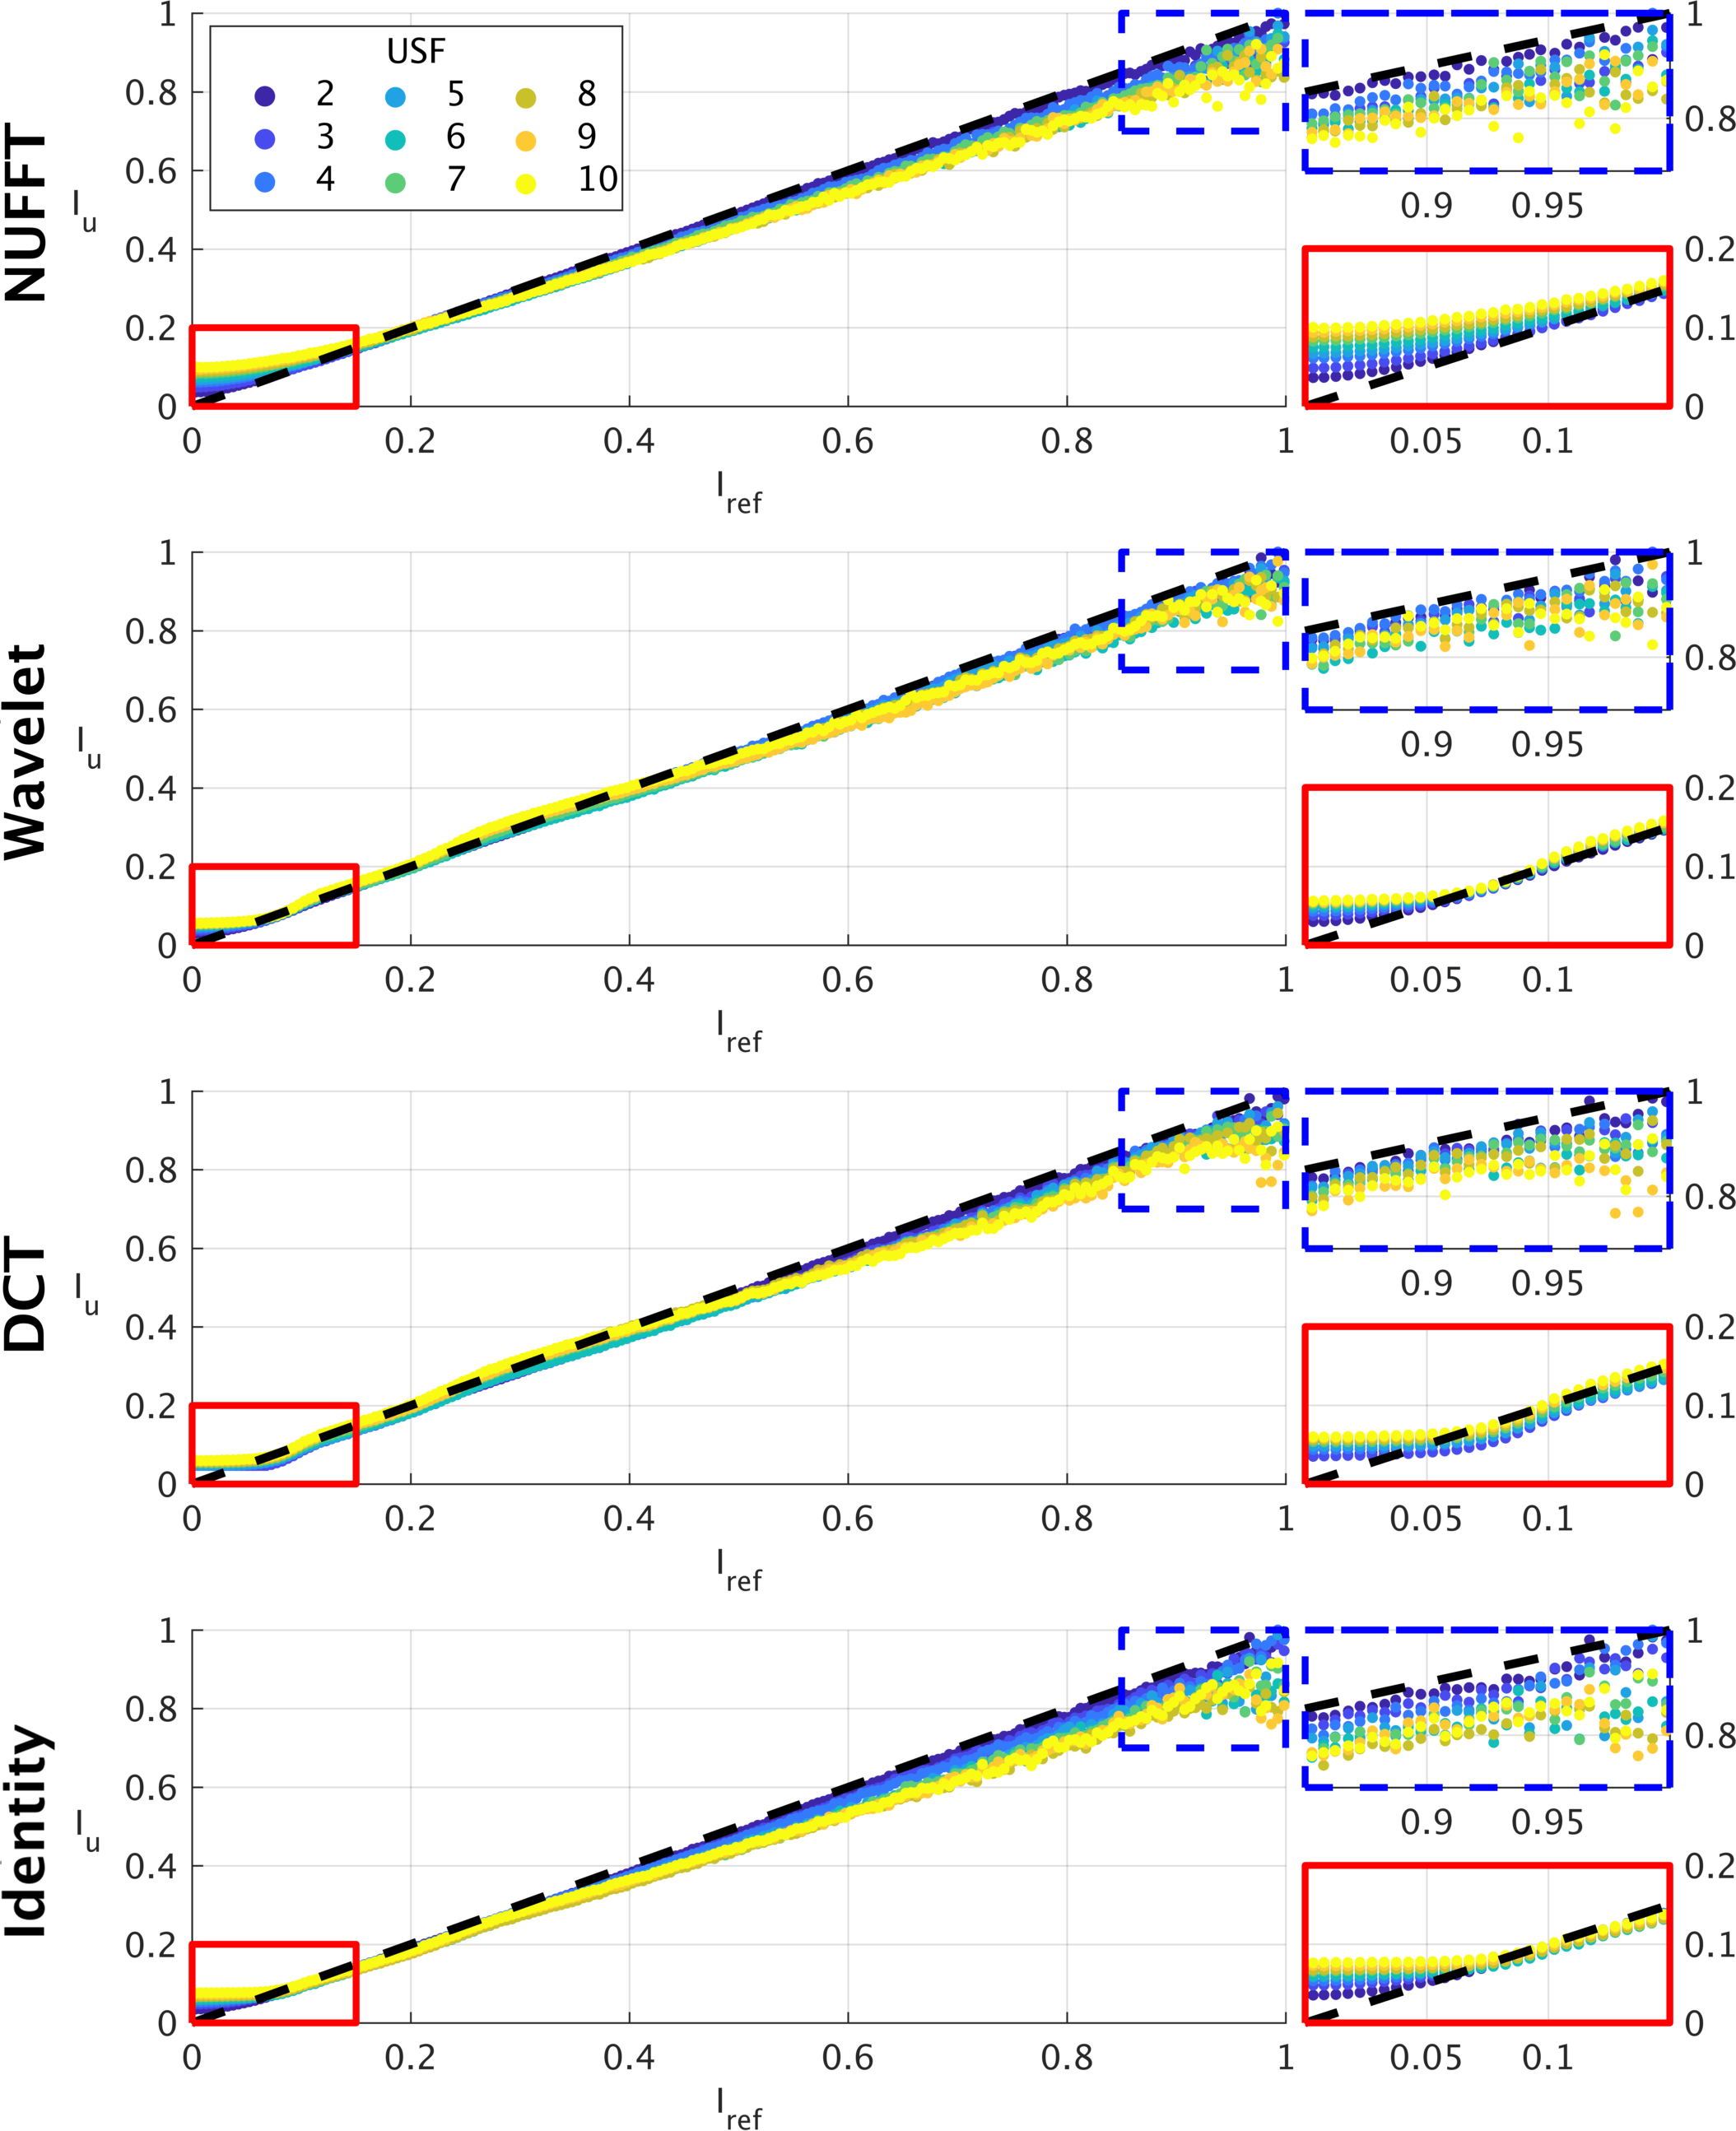
In Figure 5 mean intensities of 200 evenly spaced intensity intervals in Iref and Iu are plotted for all undersampled reconstruction schemes. The non-linear intensity reconstruction behavior is re-accentuated, dynamic ranges decrease with higher USF. Iterative CS reconstruction show better noise suppression. Wavelet-based reconstructions follow a more linear trend and lead to smaller drop in high intensities.
Discussion & Conclusion
This work investigated the optimization of sparsity and TV-regularized CS reconstructions with regards to TA reduction, image quality and intensity accuracy. A clear advantage towards Wavelet-based CS results was found, enabling USF=4 with great image quality and structural detail while maintaining good signal intensity reconstruction performance (mean linear bias slope: 0.96±0.02, Figure 4). Nevertheless, the use of a range of Sodium concentration phantoms across the whole spectrum of brain Sodium concentrations (20-150mM) is advised if quantitative information of Sodium content are to be extracted from CS reconstructed images; the use of background signal as a 0mM reference should be avoided due to the non-linear denoising properties of iterative reconstructions.
Apart from TA reduction, CS reconstructions can be further exploited for SNR enhancements. Additional regularization terms, e.g. 1H-constraints6 or learned dictionaries7, have shown great SNR results and could be included in Eq[1]. The radial acquisition scheme can furthermore be used for flexible time-resolved imaging8,9,10.
In summary, the demonstrated global optima of CS weighting parameters and achievable reduction in TA greatly support the transition of Sodium MRI into clinical routine.
Acknowledgements
We acknowledge the facilities, and the scientific and technical assistance of the Australian National Imaging Facility at the Melbourne Brain Centre Imaging Unit. We appreciate the high performance computing facility for imaging and visualisation provided by the Multi-modal Australian ScienceS Imaging and Visualisation Environment (MASSIVE).References
[1] Donoho DL. Compressed Sensing. IEEE Transactions on Information Theory 2006;52(4):1289–1306.
[2] Lustig M, Donoho D, Pauly JM. Sparse MRI: The application of compressed sensing for rapid MR imaging. Magnetic Resonance in Medicine 2007;58(6):1182–95.
[3] Madelin G, Chang G, Otazo R, Jerschow A, Regatte RR. Compressed sensing sodium MRI of cartilage at 7T: preliminary study. Journal of Magnetic Resonance 2012;214(1):360–5.
[4] Zhong J, Mills PH, Hitchens TK, Ahrens ET. Accelerated fluorine-19 MRI cell tracking using compressed sensing. Magnetic Resonance in Medicine 2013;69(6):1683–90.
[5] Fessler JA, Sutton BP. Nonuniform fast Fourier transforms using min-max interpolation. IEEE Transactions on Signal Processing 2003;51(2):560–574.
[6] Gnahm C, Bock M, Bachert P, Semmler W, Behl NG, Nagel AM. Iterative 3D projection reconstruction of 23Na data with an 1H MRI constraint. Magnetic Resonance in Medicine 2014;71(5):1720–32.
[7] Behl NG, Gnahm C, Bachert P, Ladd ME, Nagel AM. Three-dimensional dictionary-learning reconstruction of 23Na MRI data. Magnetic Resonance in Medicine 2016;75(4):1605–16.
[8] Chan RW, Ramsay EA, Cunningham CH, Plewes DB. Temporal stability of adaptive 3D radial MRI using multidimensional golden means. Magnetic Resonance in Medicine 2009;61(2):354–63.
[9] Riemer F, Solanky BS, Golay X, D’Angelo EU, Wheeler-Kingshott CAM. Sodium fMRI detects grey and white matter activations: neuronal firing or blood volume change? In: Proc. Intl. Soc. Mag. Reson. Med., vol. 23 Toronto, Canada; 2015. p. 3924.
[10] Bydder M, Zaaraoui W, Schad L, Guye M, Ranjeva JP. Validation and Initial Results from Dynamic 23Na fMRI. In: Proc. Intl. Soc. Mag. Reson. Med., vol. 25 Hawaii, USA; 2017. p. 5632.
Figures