2512
Combined 23Na/39K MRI for the quantification of Na+ and K+ concentrations in human skeletal muscle at 7 T1Institute of Radiology, University Hospital Erlangen, Friedrich-Alexander-Universität Erlangen-Nürnberg (FAU), Erlangen, Germany, 2Center for Medical Physics and Engineering, Friedrich-Alexander-Universität Erlangen-Nürnberg (FAU), Erlangen, Germany, 3Division of Medical Physics in Radiology, German Cancer Research Center (DKFZ), Heidelberg, Germany
Synopsis
A non-invasive determination of Na+ and K+ concentrations in skeletal muscle tissue is desirable to gain insights into pathological processes connected to various diseases. In this work, the feasibility of combined quantitative 23Na/39K MRI at 7 T using a double-tuned 23Na/39K birdcage calf coil was examined. In phantom measurements, a 23Na/39K SNR ratio of 46.8 was found. Moreover, Na+ and K+ concentrations close to the real concentrations were determined. In skeletal muscle tissue, fast transverse relaxation of 39K leads to underestimation of K+ concentrations if no relaxation correction is applied.
Introduction
Sodium (Na+) and potassium (K+) ions play a vital role in many cellular processes. In healthy tissue, Na+ exhibits a high concentration in the extracellular space ([Na+ext] = 145 mM) and a low concentration in the intracellular space ([Na+int] = 10-15 mM).1 In contrast, K+ ions are mainly concentrated in the intracellular space ([K+int] = 140 mM) with only a small extracellular concentration ([K+ext] = 2.5-3.5 mM). However, currently alterations of the K+ in ion homeostasis can be analyzed only in extracellular body fluids (e.g. blood samples). Therefore, a non-invasive determination of the Na+ and K+ concentration using 23Na and 39K MRI might help gaining insights into pathological processes also connected to the intracellular space. For example, in dialysis patients, excessive K+ cannot be excreted by the kidneys and is partly buffered in the intracellular space.2 A major challenge of 23Na and especially 39K MRI is the low SNR due to low in vivo concentrations and gyromagnetic ratios (γNa = 11.27 MHz/T, γK = 1.99 MHz/T). So far, 39K MRI in humans was performed using single-tuned coils.3,4,5 The aim of this work was to examine the feasibility of combined 23Na/39K MRI at 7 T using a double-tuned 23Na/39K coil.
Methods
Measurements were performed on a 7 T whole-body MR system (Magnetom Terra, Siemens Healthineers, Erlangen, Germany) using a double-tuned 23Na/39K birdcage coil with inner diameter 20 cm (Rapid Biomedical, Rimpar, Germany). A phantom containing 50/120 mM of NaCl/KCl in combination with 4% agarose was used for the verification of the quantification procedure. Moreover, the lower leg of two healthy male volunteers was examined. For the determination of Na+ and K+ concentrations, a five-compartment reference phantom containing NaCl and KCl solution (see Fig. 1) was used.
23Na and 39K images were acquired with a 3D density-adapted radial readout.6 To minimize relaxation weighting, a long repetition time (TR = 150 ms) and echo times as short as possible were used. Parameters: 23Na MRI: TR/TE= 150/0.3 ms, FA = 90°, nominal spatial resolution Δx = 4x4x16 mm3, acquisition time TAcq = 11 min 7 s; 39K MRI: TR/TE =150/0.55 ms, FA = 90°, Δx = 10x10x30 mm3, TAcq = 9 min 59 s.
For the calculation of the Na+ concentration, a linear fit of the signal intensities, measured within the five reference compartments, to their nominal concentrations was performed to determine the conversion factor between signal intensity and concentration. 39K signal intensities were transformed to concentrations using the signal intensity of the reference compartment containing KCl solution:
$$$\left[K^+\right] = \frac{S_{^{39}K}}{S_{^{39}K,ref}} \left[K^+\right]_{ref} = \frac{S_{^{39}K}}{S_{^{39}K,ref}} \text{150 mM}$$$
SNR was determined according to the National Electrical Manufacturers association (NEMA) definition 7 using the mean signal intensities of unfiltered 23Na and 39K images acquired with the same nominal resolution (Δx = 10x10x30 mm3) and the magnitude signal of corresponding noise-only images.
Results
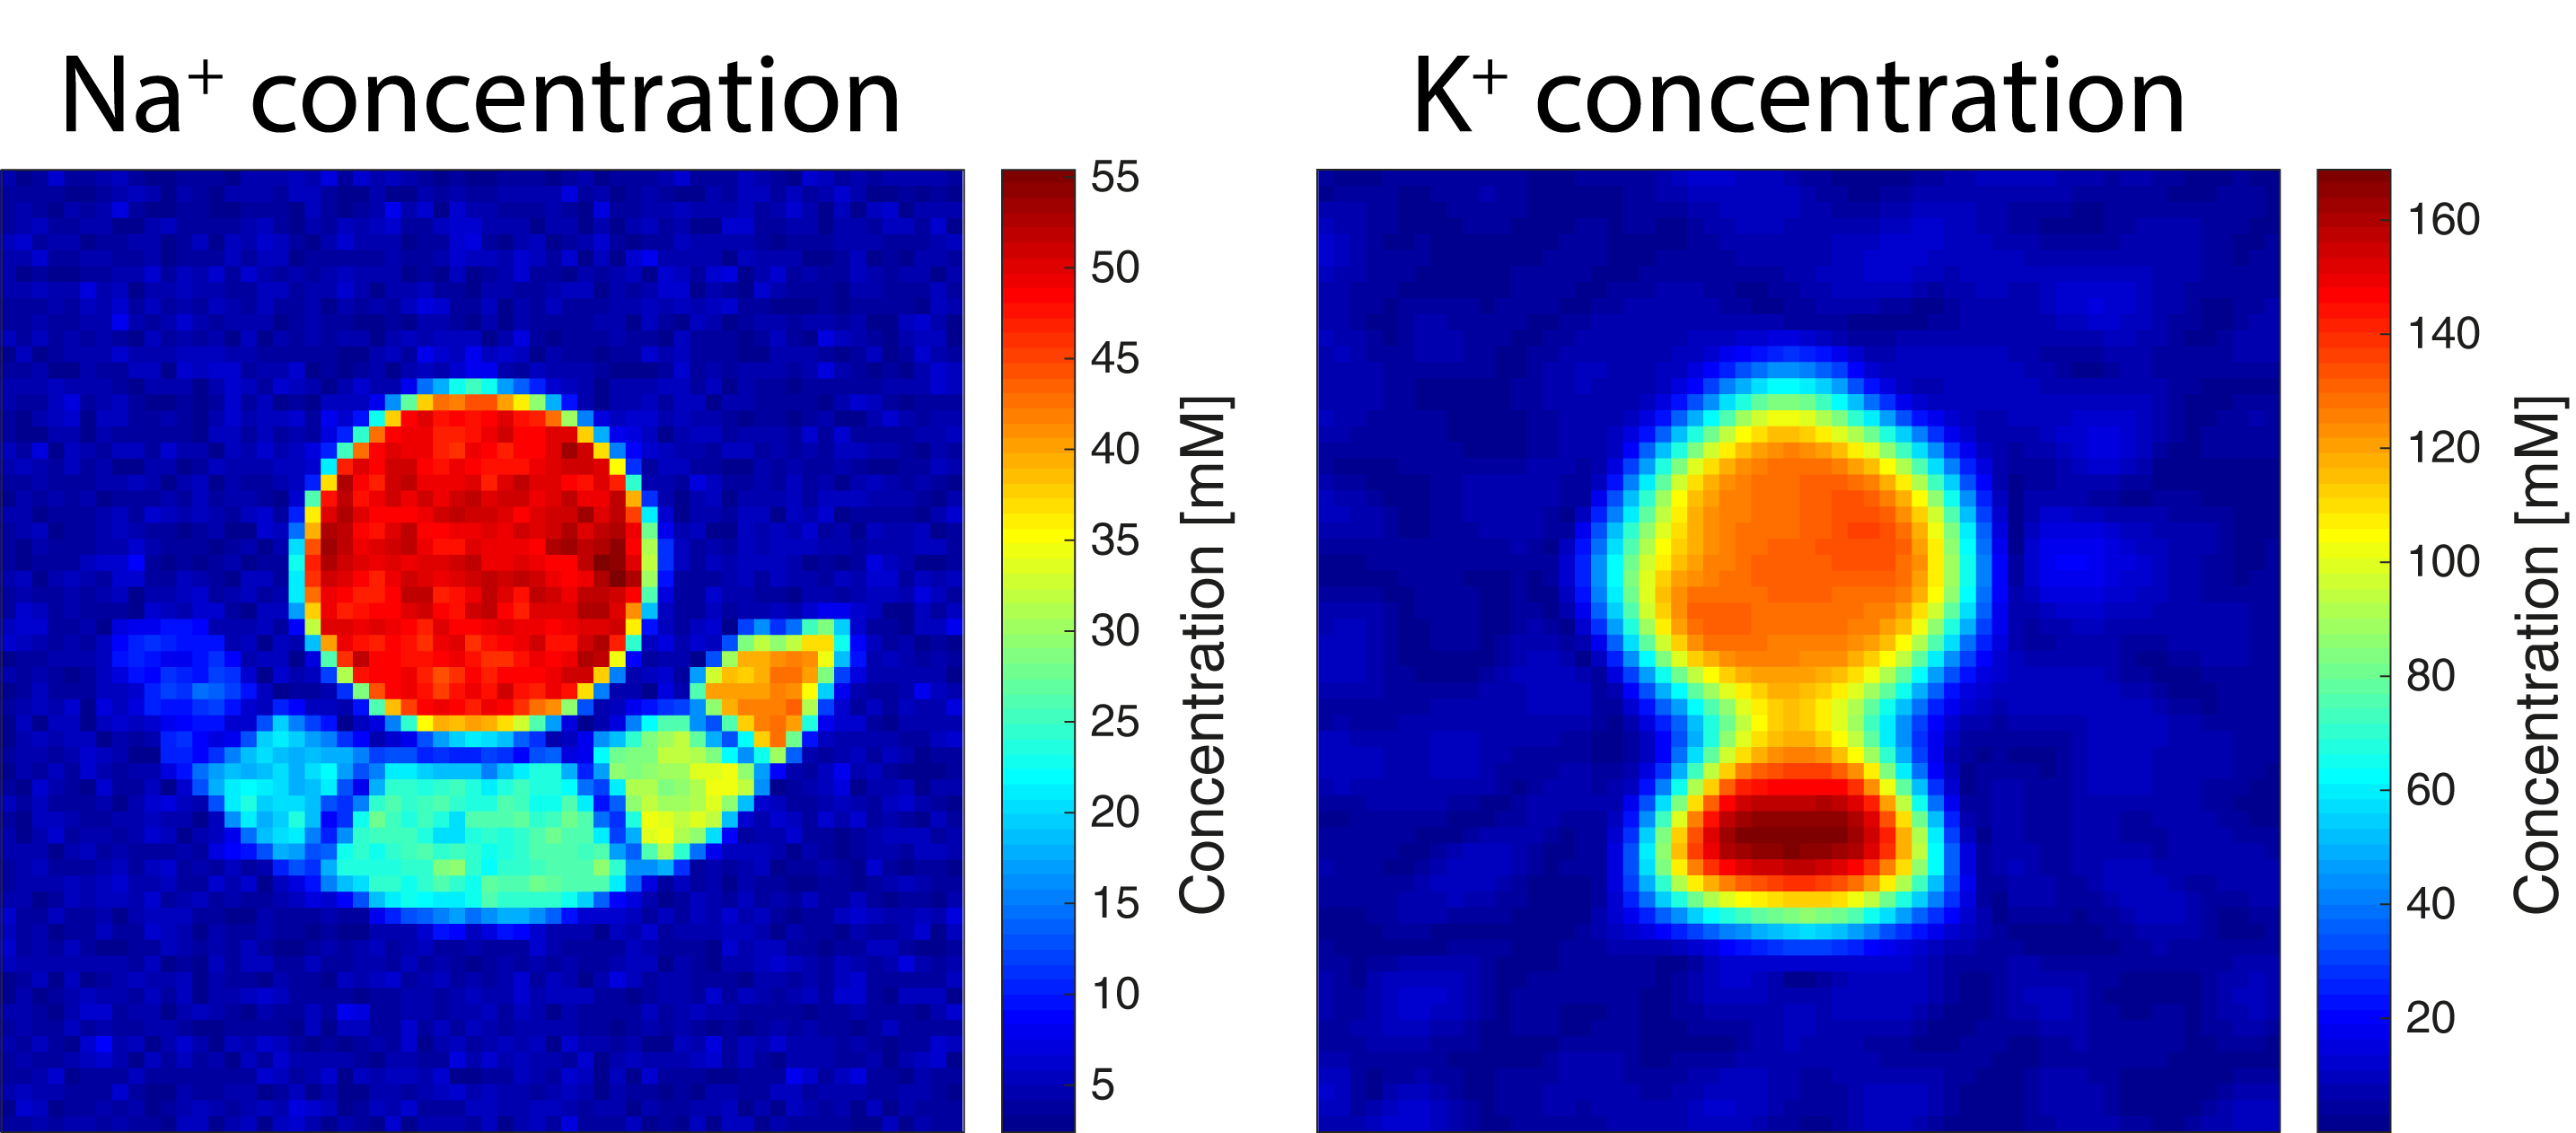
Figure 2 shows Na+ and K+ concentration maps of the agarose phantom. Mean concentrations of [Na+] = 50±2 mM and [K+] = 119±13 mM were determined. Moreover, a 23Na/39K SNR ratio of 46.8 was calculated. The concentration maps of the in vivo measurements are shown in Figure 3. Mean muscle tissue concentrations of [Na+] = 18±2 mM/ 20±4 mM and [K+] = 72±8 mM/ 74±7 mM (volunteer 1/2) were measured.39K nuclei in muscle tissue exhibit very short relaxation times compared to KCl solution (see Table 1). To account for signal losses due to T2 relaxation as well as T1 weighting, relaxation correction factors were calculated.3 A comparison of the uncorrected and relaxation corrected K+ concentration values is given in Table 2.Discussion
Na+ and K+ concentrations determined for the agarose phantom are in good agreement with the real concentrations. Moreover, the measured 23Na/39K SNR ratio of 46.8 is within the range of theoretically expected values based on the noise model (32.0–117.5, sample-dominated or electric loss dominated).9 In human muscle tissue, because of fast 39K T2 relaxation and the relatively long TE (0.55 ms), necessary due to hardware restrictions, a significant 39K signal proportion has already decayed at the start of the signal acquisition. Therefore, K+ concentrations in muscle tissue are underestimated when calculated based on a KCl solution reference. This effect can be mitigated using a relaxation correction. However, the assumed relaxation times might deviate from the real relaxation, which might introduce a bias. A further improvement of the concentration determination could be achieved using a partial volume correction.Conclusion
Combined Na+ and K+ concentration determination is feasible using a dual-tuned 23Na/39K coil at 7 T. However, fast transverse relaxation of 39K ions in muscle tissue leads to an underestimation of the K+ concentration if no corrections are applied.Acknowledgements
No acknowledgement found.References
1. Robinson JD, Flashner MS. The (Na+ + K+)-activated ATPase: enzymatic and transport properties. Biochim Biophys Acta 1979;549(2):145–176.
2. Palmer BF. Regulation of Potassium Homeostasis. Clin J Am Soc Nephrol. 2015; 10(6): 1050-60.
3. Umathum R, Rösler MB, Nagel AM. In Vivo 39K MRI of Human Muscle and Brain. Radiology 2013; 269(2): 569-576.
4. Rösler MB, Nagel AM, Umathum R, Bachert P and Benkhedah N. In vivo observation of quadrupolar splitting in 39K magnetic resonance spectroscopy of human muscle tissue. NMR in Biomed 2016; 29: 451-457.
5. Thulborn: Atkinson IC, Claiborne TC, Thulborn KR. Feasibility of 39-potassium MR imaging of a human brain at 9.4 Tesla. Magn Reson Med 2014;71(5):1819-25.
6. Nagel AM, Laun FB, Weber MA, et al. Sodium MRI using a density-adapted 3D radial acquisition technique. Magn Reson Med 2009: 62:1565–1573.
7. National Electrical Manufacturers Association 2001.
8. Nagel AM, Umathum R, Rösler MB et al. 39K and 23Na relaxation times and MRI of rat head at 21.1T. NMR in Biomed 2016; 29: 759-766.
9. Hoult and Lauterbur. The Sensitivity of the Zeugmatographic Experiment Involving Human Samples. J Magn Reson 1969; 34(2):425-433.
Figures