2511
Enhanced sodium quantification accuracy in a 3T clinical 23Na MR stroke study1Computer Assisted Clinical Medicine, Medical Faculty Mannheim, Heidelberg University, Mannheim, Germany, 2Biomedical Engineering, Politecnico di Milano, Milan, Italy, 3Department of Dermatology, Venereology and Allergology, University Medical Center and Medical Faculty Mannheim, Heidelberg University, Mannheim, Germany, 4Department of Neuroradiology, University Medical Centre Mannheim, Heidelberg University, Mannheim, Germany, 5Department of Neurology, Medical Faculty Mannheim, Heidelberg University, Mannheim, Germany
Synopsis
Tissue sodium quantification from sodium magnetic resonance acquisitions is a promising biomarker in ischemic stroke diagnostics and can be incorporated
Introduction
The sodium ion is involved in essential physiological processes and its concentration is a promising biomarker for various pathologies1 including ischemic stroke2,3. Quantitative 23Na-MRI non-invasively determines tissue sodium concentration (TSC). Since no gold standard of protocol design and post-processing exist yet, we investigated three research questions to enhance the accuracy of sodium quantification:
Q1: Is a correction for transmission field (B1+) inhomogeneities necessary?
Q1: Should relaxation effects during transmission be corrected for TSC quantification?
Q3: Is automatic whole brain segmentation beneficial compared to manual determination of the region of interest (ROI)?
Methods
We scanned 20 stroke patients, nine of whom were females, of 75.2±10.3 years old with a clinical stroke 1H/23Na-MR-protocol described before2. All measurements were approved by the local ethical review committee. TSC was calculated by a linear fit between reference vials (50mM and 100mM sodium content with 2% agarose each) placed inside the field-of-view during measurements. A dual-tuned 1H/23Na birdcage head coil was used (Rapid Biomedical, Rimpar, Germany) on 3T whole-body MR system (MAGNETOM Trio, Siemens Healthineers, Erlangen, Germany). Stroke ROIs were drawn manually under the supervision of a neuroradiologist. Contralateral stroke regions (cl Stroke) were evaluated by mirroring the stroke regions with respect to the brain’s midline. Quantification results were assessed by paired two-tailed t−tests.
To correct B1+ inhomogeneities, the protocol was extended by a sodium flip angle mapping sequence based on the phase sensitive method4. The phase sensitive pulse pattern was incorporated into a density-adapted 3D ultra-short echo time sequence5 with 15mm isotropic resolution, 0.4ms echo time, 100ms repetition time, and 122s acquisition time.
Relaxation effects were corrected in post-processing by
$$[\text{Na}]_\text{tiss} =\frac{[\text{Na}]_\text{ref}}{S_\text{ref}}\cdot S_\text{tiss}\cdot \frac{1-\exp(-T_R/T_{1,\text{ref}})}{1-\exp(-T_R/T_{1,\text{tiss}})}\cdot \frac{0.6\exp(-T_E/T^\star_{2f,\text{ref}})+0.4\exp(-T_E/T^\star_{2s,\text{ref}})}{0.6\exp(-T_E/T^\star_{2f,\text{tiss}})+0.4\exp(-T_E/T^\star_{2s,\text{tiss}})}$$
using relaxation time components T1, T*2f and T*2s of reference vials (ref) from measurements and of tissues (tiss) from literature6,7,8.
Segmentations were performed using Statistical Parametric Mapping (SPM12)9. We used 1H turbo inversion recovery images (TRIM) as input data. Parameters were a low-frequency bias regularization of 0.001, smoothness of bias Gaussian was kept medium-low at 60mm cutoff and a safety margin on tissue borders of one nominal quantification scan resolution (4mm) was subtracted from tissue masks to reduce partial volume effects. We assessed white matter (WM), gray matter (GM) and ventricles of cerebrospinal fluid (CSF) by SPM12 segmentation on the one hand and manually drawn ROIs on the other hand.
Results and Discussion
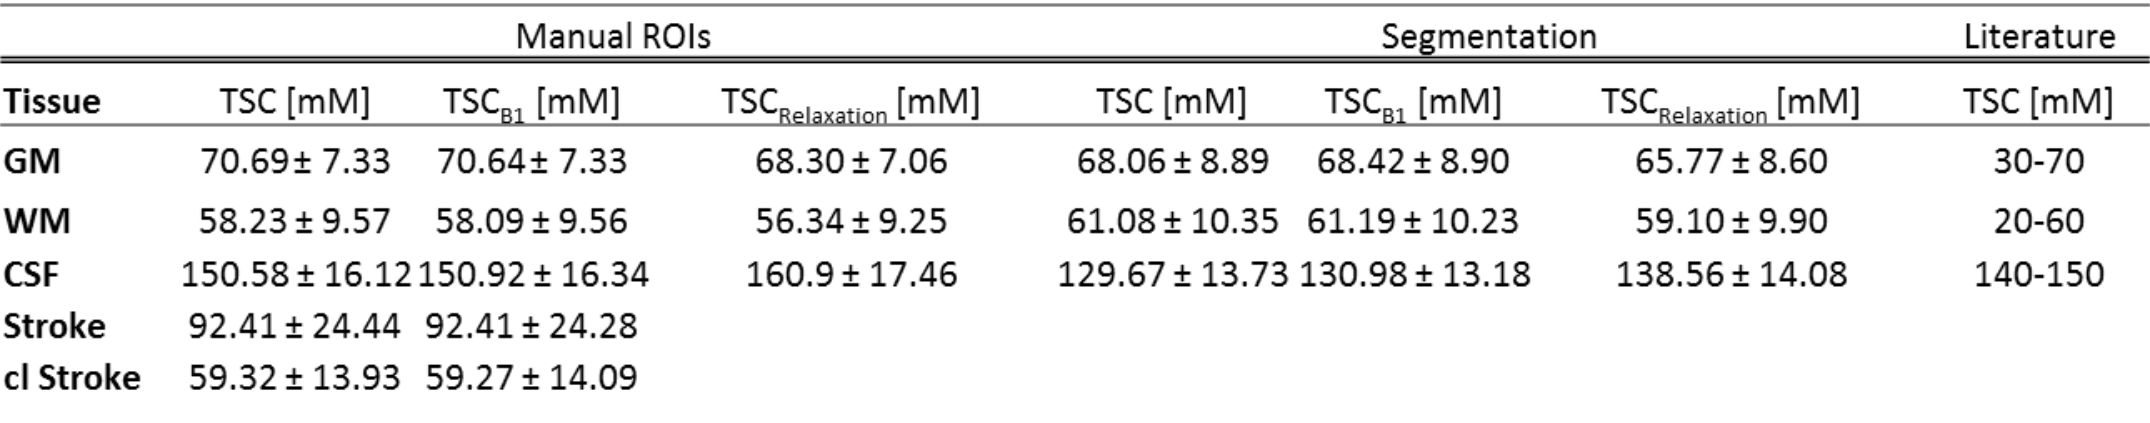
TSC was evaluated in GM, WM, CSF, Stroke and cl Stroke (Figure 1). In all subjects, stroke regions were defined in contrast to the surrounding tissue in TSC maps and coincided well with the impaired area identified in diffusion-weighted and apparent-diffusion-coefficient images. Significant differences (p<0.01) could be found between the stroke areas and their corresponding contralateral stroke areas as well as between GM and WM. TSC corrected values for B1+ incorporation (Q1) and relaxation effects (Q2) both in manually drawn ROIs and tissue segmentations (Q3) are listed.
Flip angles (Figure 2) deviated by (14.1±13.6)% from 90°; this correlated to a reduced signal of 2.4% until 9.3% for mean deviations. However, this resulted in no significant changes (p>0.05) when comparing B1+ corrected and uncorrected TSC tissue values. Although B1+ correction has been recommended for 23Na head acquisitions10, our research found no significant influence of B1+ correction on TSC quantification. The used birdcage coil provided a sufficiently homogeneous transmission profile. Hence, 23Na sequences for transmission field correction could be skipped using head birdcage coils if time-consuming acquisitions are harmful to the patient.
When relaxation behavior was accounted for in the quantification pipeline, TSC was found to be higher in CSF and lower in GM and WM. Relaxation-corrected TSC values differed significantly (p<0.01) from uncorrected values. Incorporating the relaxation behavior significantly improved the quantification, since the corrected TSC fitted better in literature ranges.
Masks for different tissue types could be calculated for TIRM images (Figure 3). TSC values obtained from segmentation in GM, WM and CSF showed significant variations compared with those obtained from ROI evaluations (p<0.01). Particularly, CSF TSC values from segmentation were in limits of literature values. Additionally, user-dependent variances can be avoided. Therefore, we suggest integrating segmentation into post-processing routines.
Conclusion
In this work, a clinical 3T stroke protocol was successfully applied to 20 stroke patients. Based on TSC values, tissues impaired by the stroke could be distinguished from their surrounding tissue. Three methods to enhance the accuracy of sodium quantification were investigated. In conclusion, corrections of transmission inhomogeneities in birdcage head coils can be neglected while the relaxation behavior and automatic segmentation approaches should be included to enhance the accuracy of TSC quantification avoiding user-dependent biases.Acknowledgements
The project was funded by Dietmar Hopp Stiftung GmbH “Na-MRI for acute stroke” project number 23014019.References
- M. Suhail. Na+, K+-ATPase: ubiquitous multifunctional transmembrane protein and its relevance to various pathophysiological conditions. Journal of Clinical Medicine Research, 2(1):1, 2010.
- E. Neumaier-Probst, S. Konstandin, J. Ssozi, C.Groden, M. Hennerici, L. R. Schad, and M. Fatar. A double-tuned 1H/23Na resonator allows 1H-guided 23Na-MRI in ischemic stroke patients in one session. International Journal of Stroke, 10:56–61, 2015.
- M. S. Hussain, R. W. Stobbe, Y. A. Bhagat, D. Emery, K. S. Butcher, D. Manawadu, N. Rizvi, P. Maheshwari, J. Scozzafava, A. Shuaib, and C. Beaulieu. Sodium imaging intensity increases with time after human ischemic stroke. Annals of Neurology, 66(1):55–62, 7 2009.
- G. R. Morrell. A phase-sensitive method of flip angle mapping. Magnetic resonance in medicine, 60(4):889—894, 2008.
- A. M. Nagel, F. B. Laun, M. Weber, C. Matthies, W. Semmler, and L. R. Schad. Sodium MRI using a density adapted 3D radial acquisition technique. Magnetic resonance in medicine, 62(6):1565—1573, 2009.
- G. Madelin, J. Lee, R. R. Regatte, and A. Jerschow. Sodium MRI: Methods and applications. Progress in Nuclear Magnetic Resonance Spectroscopy, 79:14 – 47, 2014.
- S. Romanzetti, C. C. Mirkes, D. P. Fiege, A. Celik, J. Felder, and N. J. Shah. Mapping tissue sodium concentration in the human brain: A comparison of MR sequences at 9.4 tesla. Neuro Image, 96:44–53, 2014.
- Y. Blunck, S. Josan, S. W. Taqdees, B. A. Moffat, R. J. Ordidge, J. O. Cleary, and L. A. Johnston. 3D-multi-echo radial imaging of 23Na (3D-MERINA) for time-efficient multi-parameter tissue compartment mapping. Magnetic Resonance in Medicine, 79(4):1950–1961, 2018.
- J. Ashburner. Computational anatomy with the SPM software Magnetic Resonance Imaging, 27: 1163-1174, 2009.
- J. Lommen, S. Konstandin, P. Krämer, and L. R Schad. Enhancing the quantification of tissue sodium content by MRI: time efficient sodium B1 mapping at clinical field strengths. NMR in biomedicine, 29(2):129—136, 2016.
Figures